What Is IBM Turbonomic?
IBM Turbonomic is an application resource management solution that optimizes IT workloads automatically. It ensures applications receive necessary resources by analyzing resource utilization across the entire stack, including application, compute, storage, and network layers.
Turbonomic operates by continuously monitoring and analyzing real-time data. It automates optimization processes without manual intervention, ensuring constant alignment between demand and resources. This aids organizations in maintaining service levels and improving capacity planning.
This is part of an extensive series of guides about cybersecurity
Key Features of Turbonomic
IBM Turbonomic offers several key features to optimize IT infrastructure performance while controlling costs:
- Continuous resource optimization: Turbonomic automatically adjusts compute, storage, and network resources in real-time to ensure optimal application performance. It continuously analyzes data across different layers of the infrastructure and executes optimization actions without the need for human intervention.
- AI-powered insights: The platform leverages artificial intelligence to deliver actionable insights, helping organizations make informed decisions. These AI-driven recommendations enable better resource allocation and optimization opportunities.
- What-if planning scenarios: Turbonomic allows teams to simulate different scenarios for capacity planning, enabling businesses to predict resource needs for future workloads or cloud migrations. This helps prevent over-provisioning and supports cost-effective scaling.
- Multi-cloud and hybrid cloud support: The platform supports optimization for public, private, and hybrid cloud environments, including AWS, Azure, Google Cloud, and VMware. This broad compatibility ensures that businesses can optimize across different cloud providers.
- Automation and trust across teams: Turbonomic fosters collaboration between engineering, operations, and application teams by providing trusted automation that is transparent and effective. This reduces friction across siloed teams.
Related content: Read our guide to IT mapping
How IBM Turbonomic Works
IBM Turbonomic ensures optimal application performance by continuously managing and balancing resources in real-time. It supports application resource management (ARM), which focuses on meeting application demands while maintaining efficient use of IT infrastructure. This involves monitoring various resources like compute, storage, and network, and automating the adjustments needed to keep the system in an appropriate state.
To achieve this, Turbonomic models the IT environment as a marketplace of buyers and sellers. In this marketplace, applications (the buyers) seek resources like memory and CPU (offered by the sellers). The platform uses a virtual currency to assign costs to these resources, allowing it to assess and optimize resource usage across different tiers of the environment — from physical datacenters to virtualized and cloud-based systems.
As resource demands change, prices fluctuate based on supply and demand. Turbonomic’s economic scheduling engine analyzes these price changes and makes decisions to dynamically adjust resources. For example, if an application needs more CPU, Turbonomic reallocates resources or provisions new instances. This closed-loop system allows the platform to automatically maintain the desired balance between resource efficiency and performance.
Instead of relying on static thresholds, Turbonomic operates proactively, using real-time data to recommend or execute actions that maintain the environment within its desired state. This state balances performance (measured by low delay) and resource utilization (measured by efficiency).
IBM Turbonomic Pricing
IBM Turbonomic offers several pricing tiers tailored to different business needs:
- Trial: This plan is free for 30 days and does not require a credit card. It provides unlimited optimization of application resources and cloud costs for AWS, Azure, and GCP accounts.
- Essentials: Priced at $40,000 USD per year, the Essentials package is suitable for startups and growing businesses. This plan supports public cloud optimization, Kubernetes optimization, and application and database resource optimization, with a focus on environments that spend less than $2 million USD annually on cloud resources.
- Standard: Aimed at enterprises, the Standard plan is priced per monitored cost. It offers broader functionality, including optimization across hybrid cloud environments and enterprise-level features like SLO-driven optimization and on-premises data center optimization. This plan is suitable for organizations with more than $2 million USD in annual cloud spend or those managing 200 or more virtual servers.
IBM Turbonomic Limitations
While IBM Turbonomic provides optimization tools, it’s important to be aware of its limitations. Users have reported the following issues on the G2 platform:
- Limited third-party integrations: Despite supporting a broad range of platforms, some users have noted gaps in integrations with specific third-party tools and services.
- Customization requirements for large organizations: Out-of-the-box functionality may not fully meet the needs of larger enterprises. Significant customization is often required to tailor the platform to specific requirements, adding to setup complexity.
- Scheduling complexity: The platform’s scheduling feature for tasks like application and server initiation can be rigid. Users must select from predefined schedules, limiting flexibility for custom setups. Additionally, there is a learning curve in configuring these schedules.
- Limited cloud service coverage: Turbonomic’s optimization capabilities are primarily focused on virtual machine (VM) stacks, which can leave organizations seeking better support for other cloud services.
- Cost concerns: IBM Turbonomic is often regarded as more expensive than alternatives. Its wide array of features might not be necessary for all users.
- Storage forecasting limitations: Some users expected more advanced storage forecasting features, but found the current tools insufficient for precise predictions.
IBM Turbonomic Alternatives and Competitors
Application Dependency Mapping and Discovery
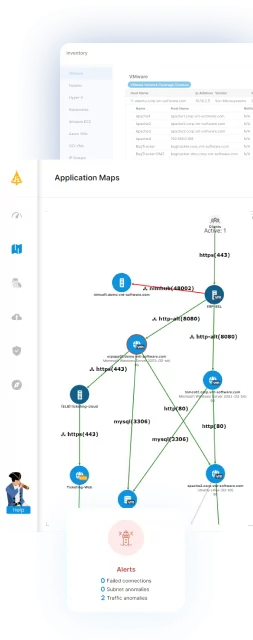
1. Faddom

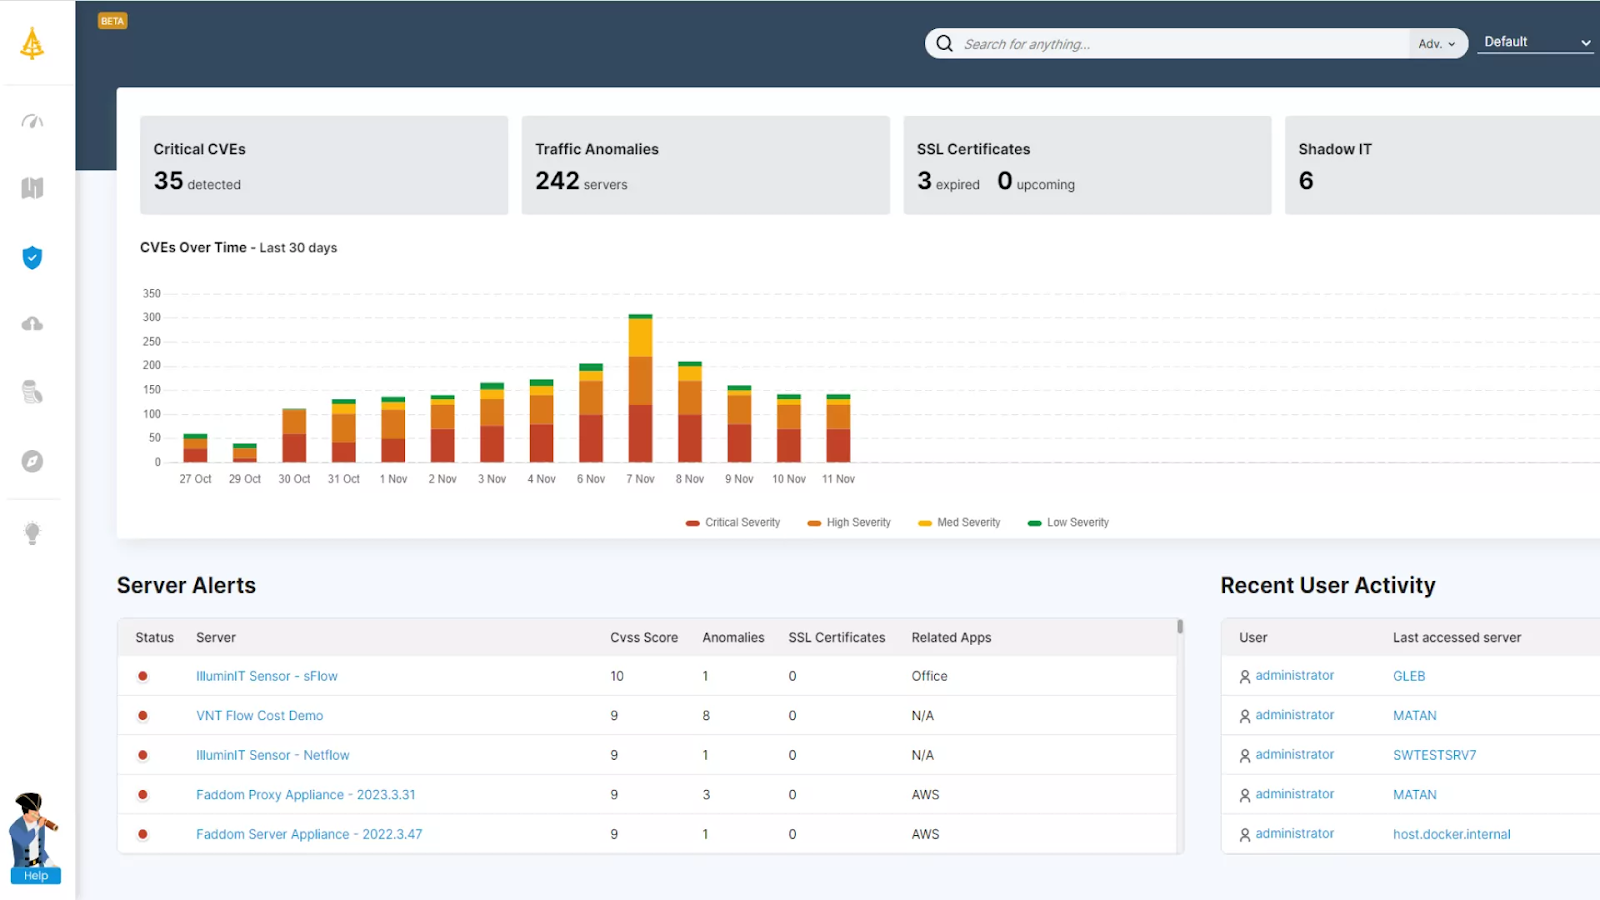
Faddom is an agentless application dependency mapping platform that turns raw network data into real-time maps of servers, applications, and the connections between them across on-premises, cloud, and hybrid environments. It uses AI-driven correlation and analysis to build an operational context layer that IT and security teams can use to understand, operate, and secure complex topologies. The platform installs without agents, credentials, or firewall changes and can produce a first map within an hour of deployment, automatically grouping servers into business applications. It runs passively and read-only, so all data stays inside the customer’s environment and the platform can even operate offline, while the map continues to update around the clock as the environment changes. Faddom supports a range of use cases built on that map, including asset discovery and documentation, change management and impact analysis, data center and cloud migration, resource and cost optimization, audit and compliance, and cybersecurity.
Key features include:
- Agentless, passive discovery: Faddom reads a copy of network traffic rather than installing agents, supplying server credentials, or reconfiguring firewalls, which keeps all data inside the environment and allows the platform to run offline. Deployment is automated and lightweight, typically completing in under 60 minutes, so teams can begin seeing data without a lengthy rollout.
- Real-time dependency mapping: The platform continuously maps servers, applications, and traffic flows and automatically groups servers into the business applications they support. Maps update 24/7 to reflect changes in the environment, providing a continuously current view rather than a point-in-time snapshot that quickly goes stale.
- Hybrid and multi-cloud coverage: Faddom connects to on-premises, cloud, and virtualized data sources and discovers hybrid business applications across them. It is platform-agnostic, presenting dependencies that span different environments in a single view instead of separate, siloed tools per platform.
- Change management and impact analysis: By tracking changes and showing the dependencies between servers and applications, the platform lets teams understand the potential impact of a change before they make it. This supports planning for migrations, segmentation, and routine operational changes with less risk of unexpected disruption.
- Migration and cost optimization support: Faddom provides wave-based migration planning to organize workloads into phased moves and surfaces resource and cost information to highlight optimization opportunities. This is used to plan data center and cloud migrations and to identify where resources can be reallocated or reduced.
- Security and compliance insights: The platform detects vulnerabilities and exposure across the mapped environment and supports audit and compliance processes with continuously updated documentation. Because the map is always current, it can serve as a source of truth for security reviews and governance work.
Limitations (as reported by users on G2):
- Depth in restricted-visibility environments: Because the platform works passively from network traffic, environments with heavily encrypted traffic or tightly segmented network zones may not surface every dependency at full granularity.
- Focused scope: Faddom concentrates on mapping and visibility, and some users note it is most effective when used alongside broader CMDB or AIOps platforms rather than as a replacement for them.
- Initial onboarding: A few users mention that planning the initial deployment and working through the documentation can take some time before they get the most value from the tool.
Learn more about Faddom by downloading our latest comparative analysis on application discovery and dependency mapping, or start a free trial using the column on the right!
2. ServiceNow IT Operations Management
ServiceNow IT Operations Management (ITOM) is a suite on the ServiceNow AI Platform that applies AIOps to give visibility across IT estates and to act on issues automatically. It federates signals from systems, services, and applications, maps service dependencies, and identifies issues with the goal of avoiding incidents, integrating natively with ServiceNow IT Service Management. ITOM builds dynamic service maps using the Common Services Data Model (CSDM), providing business context across hybrid and cloud environments in a unified service graph. It correlates and de-duplicates alerts from different monitoring tools to reduce noise and prioritize incidents, and it can drive remediation through orchestrated, policy-based workflows and AI agents. The suite is positioned to help organizations shift from reactive firefighting toward proactive, service-aware operations.
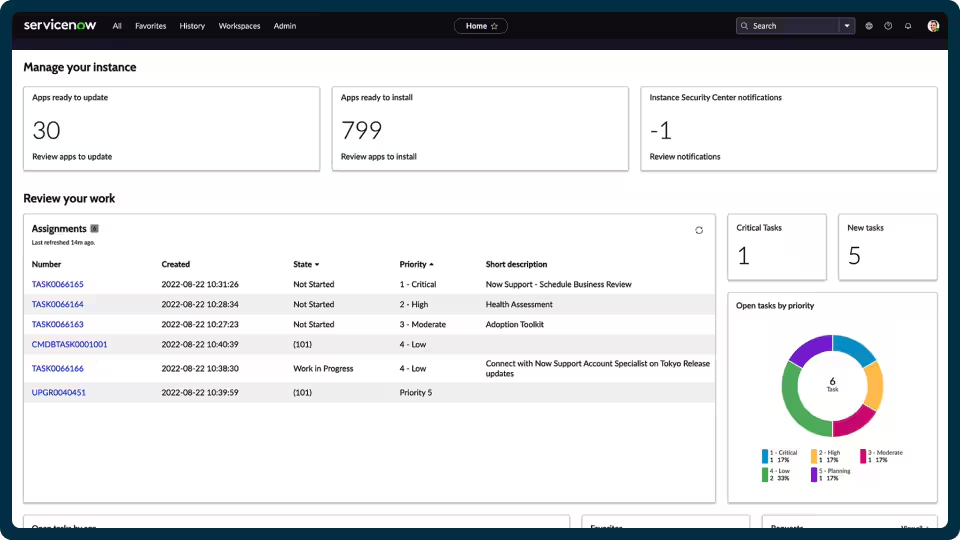
Source: ServiceNow
Key features include:
- Dynamic discovery: ITOM automatically discovers and maps end-to-end service dependencies in real time, drawing on first- and third-party discovery data. This populates and maintains the configuration management database (CMDB) and supports faster root-cause analysis, prioritization, and impact assessment.
- Service mapping: The suite builds dynamic service maps with the Common Services Data Model embedded, linking infrastructure components to the business services they support. The resulting service graph spans hybrid and cloud environments to provide business context across the estate.
- Event intelligence: ITOM correlates and de-duplicates alerts across disparate monitoring tools and uses AIOps to reduce noise before creating and prioritizing incidents. The intent is to cut alert fatigue and accelerate resolution by surfacing actionable alerts.
- Agentic AI remediation: The platform identifies recurring root-cause patterns and uses AI agents to trigger and run orchestrated remediation workflows automatically. This is aimed at reducing repeat incidents and the manual effort involved in resolving them.
- Change impact analysis: ITOM shows the downstream impact of a planned change so that one update does not unintentionally disrupt another service. This helps teams schedule and approve service changes with more confidence.
- Service availability and observability: The suite centralizes data from monitoring and observability tools, cloud providers, and AI agents into a full-stack view of service health. Service Graph Connectors unify data from specialized tools and cloud platforms into a single governed system.
Limitations (as reported by users on TrustRadius):
- Cost for smaller organizations: Users note that the suite is oriented toward larger organizations and can be expensive relative to the needs of small-scale businesses.
- Dependency on data quality: The value of mapping and automation depends on clean, consistent configuration data; when the underlying data is unreliable, the resulting maps and workflows lose value.
- Learning curve: The platform is broad and can require prior ServiceNow experience or dedicated expertise to plan, implement, and tune effectively.
Learn more in our detailed guide to ServiceNow service mapping
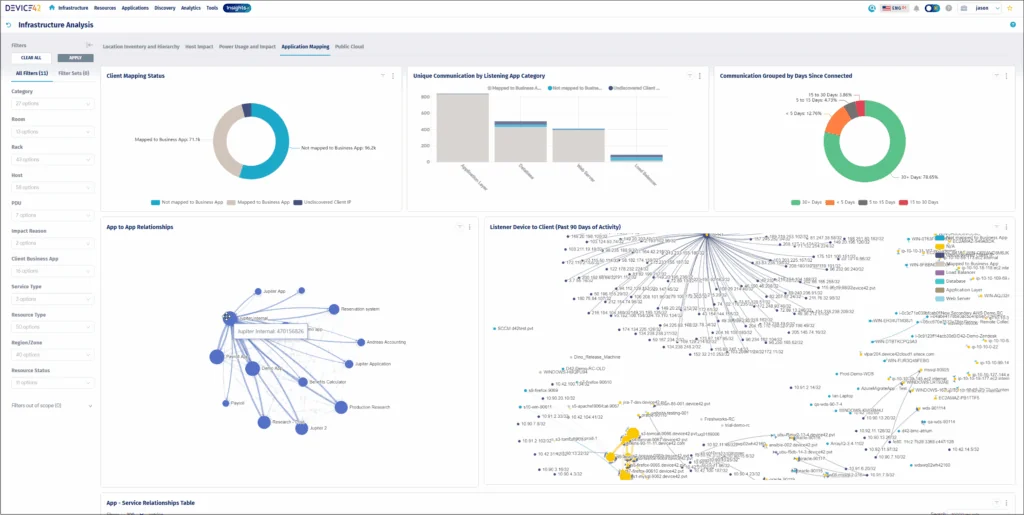
3. Device42
![]()
Device42 is an agentless discovery and dependency mapping platform for hybrid IT, covering assets from legacy mainframes to cloud containers. It continuously discovers infrastructure and applications across data centers and cloud, builds a near real-time CMDB, and maps how applications, assets, and services connect. Discovery uses standard agentless protocols such as SNMP, WMI, SSH, and APIs, and the platform maintains a complete inventory of on-premises, virtual, and cloud assets in a single interface. Built-in application dependency mapping groups workloads by application affinity to support migrations, modernization, and change management. Device42 also includes related modules for cloud, network, storage, software, operating system, database, and SSL certificate discovery, along with IP address management and reporting.
Key features include:
- Agentless infrastructure discovery: Device42 uses agentless protocols such as SNMP, WMI, SSH, and APIs to discover servers, network devices, operating systems, virtual machines, and more across on-premises and cloud environments. Scans run on a schedule the team chooses and continuously update the inventory so records stay current.
- Application dependency mapping: Native ADM groups discovered workloads into Affinity Groups based on how applications, servers, and services communicate with each other. This clarifies dependencies to support migration move-group planning, modernization, and faster troubleshooting during incidents.
- CMDB: The platform maintains a near real-time, automated CMDB intended to serve as a single source of truth. EnrichAI normalizes and enriches configuration item data using third-party sources, including end-of-life and end-of-support details for tracked assets.
- Cloud and network discovery: Device42 discovers cloud platform consumption, configurations, and running services for providers such as AWS and Azure, and inventories switches, routers, firewalls, load balancers, and other network devices. This extends visibility consistently across the hybrid estate.
- Storage, software, and certificate discovery: The platform collects performance, configuration, and capacity data from storage arrays; tracks software installations, license models, and EOL/EOS data; and discovers and manages SSL certificates with expiration tracking. These functions support capacity planning, license management, and avoiding certificate-related outages.
- Integrations and reporting: Device42 offers more than 30 integrations and REST APIs to feed normalized discovery data into other IT tools, plus Insights+ dashboards with natural-language querying through InsightsAI. This supports reporting for audit, compliance, and capacity-planning work.
Limitations (as reported by users on PeerSpot):
- Dependency mapping speed: Some users would like faster performance when generating dependency maps in larger environments.
- Manual upgrades: Product upgrades are largely manual and can require significant effort, including building a new virtual appliance.
- Setup and configuration effort: Initial setup and scan configuration can be time-consuming in large environments that require different credentials for various discovery jobs.
- Bulk operations and licensing: Bulk actions such as mass deletion of assets can be time-consuming, and some users find the licensing model confusing.
Application Performance Monitoring and Observability
3. Splunk AppDynamics
Splunk AppDynamics is a full-stack application performance monitoring (APM) product, now part of the Splunk Observability portfolio following Cisco’s acquisition. It identifies hybrid and on-premises application issues in real time, ties performance to business context, and traces root cause across the stack down to the line of code. The product automatically discovers business transactions and builds a real-time topology map of how traffic flows through an application, establishing dynamic baselines to generate intelligent alerts. Its capabilities span APM, infrastructure monitoring, digital experience monitoring, network monitoring through Cisco ThousandEyes, application security, and business performance analytics. It can be deployed as SaaS, on-premises, or as a self-contained Kubernetes-based virtual appliance.
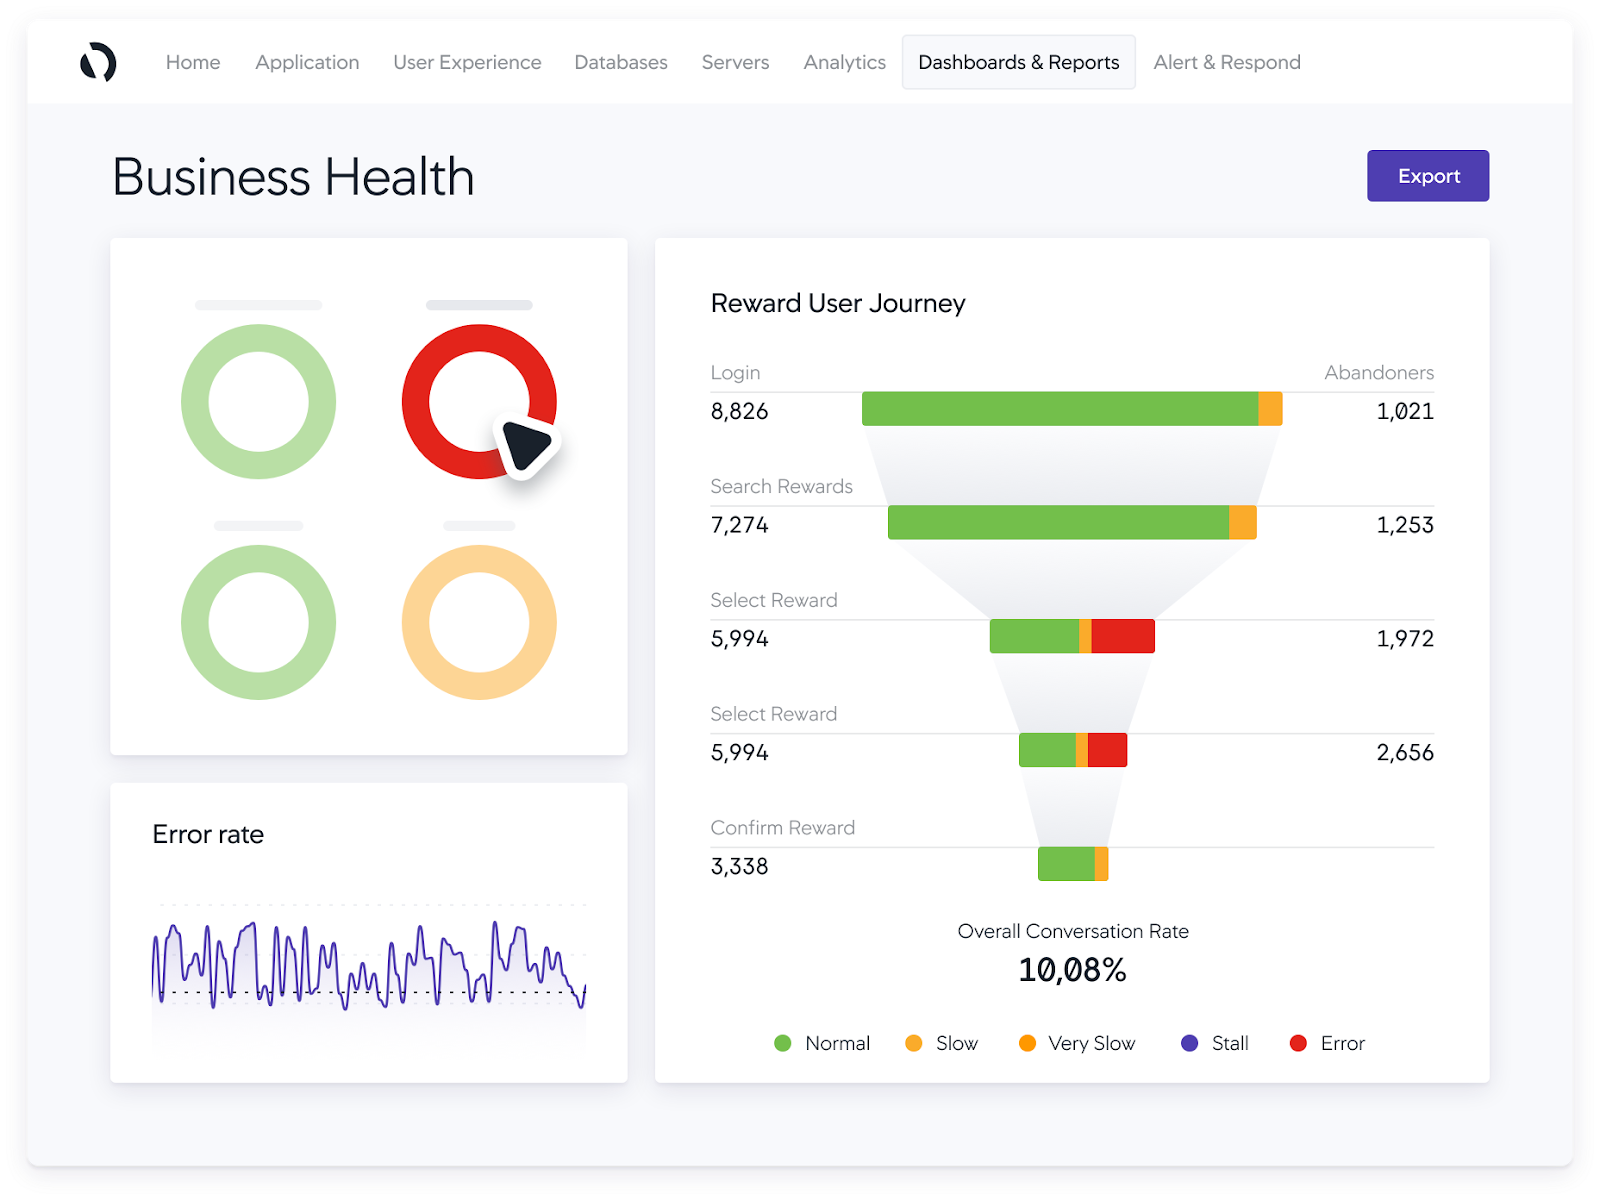
Source: AppDynamics
Key features include:
- Application performance monitoring: AppDynamics detects performance issues in hybrid and on-prem applications in real time and diagnoses root cause anywhere in the stack, from third-party APIs and the network down to the code level. It ties issues to business metrics so teams can prioritize which problems to remediate first.
- Business transaction monitoring and snapshots: The product automatically discovers known and unknown business transactions and maps how traffic flows through the application in real time. Transaction snapshots capture method-level detail to pinpoint exactly which line of code is taking longest to execute.
- Baselining and AI-driven anomaly detection: AppDynamics learns normal performance ranges with dynamic baselining and uses machine learning to detect anomalies without preconfiguration. This reduces noisy, false alerts and surfaces a wider range of issues than fixed health rules would catch.
- Digital experience and network monitoring: Real-user monitoring for browsers and mobile devices and synthetic monitoring track end-user experience, while integration with Cisco ThousandEyes adds visibility into owned and unowned network, ISP, API, and third-party services. Correlating these signals with APM data is aimed at faster identification and resolution.
- Business iQ performance monitoring: The product correlates application performance with business metrics across the customer journey, from conversions to revenue, using user journey maps. It is used to validate new releases and migrations against defined performance goals.
- Application security and deployment options: The Secure Application add-on provides vulnerability detection and runtime threat detection enriched with business context. AppDynamics is available as SaaS, on-premises, or a Kubernetes-based virtual appliance, with Smart Agent for centralized agent lifecycle management.
Limitations (as reported by users on PeerSpot):
- Cost and licensing complexity: Users describe the product as expensive with complex, tiered licensing, sometimes requiring separate licenses for development and production environments.
- Setup and agent management: The agent-based architecture and agent installation and management can be complex, and users say the documentation could be clearer and more streamlined.
- User interface and learning curve: The interface can be complex, and users report it takes time to learn the product’s full behavior.
- Cloud-native gaps and post-acquisition support: Some users want stronger support for serverless and emerging technologies such as Kubernetes, and report higher renewal costs and slower support timelines since the acquisition.
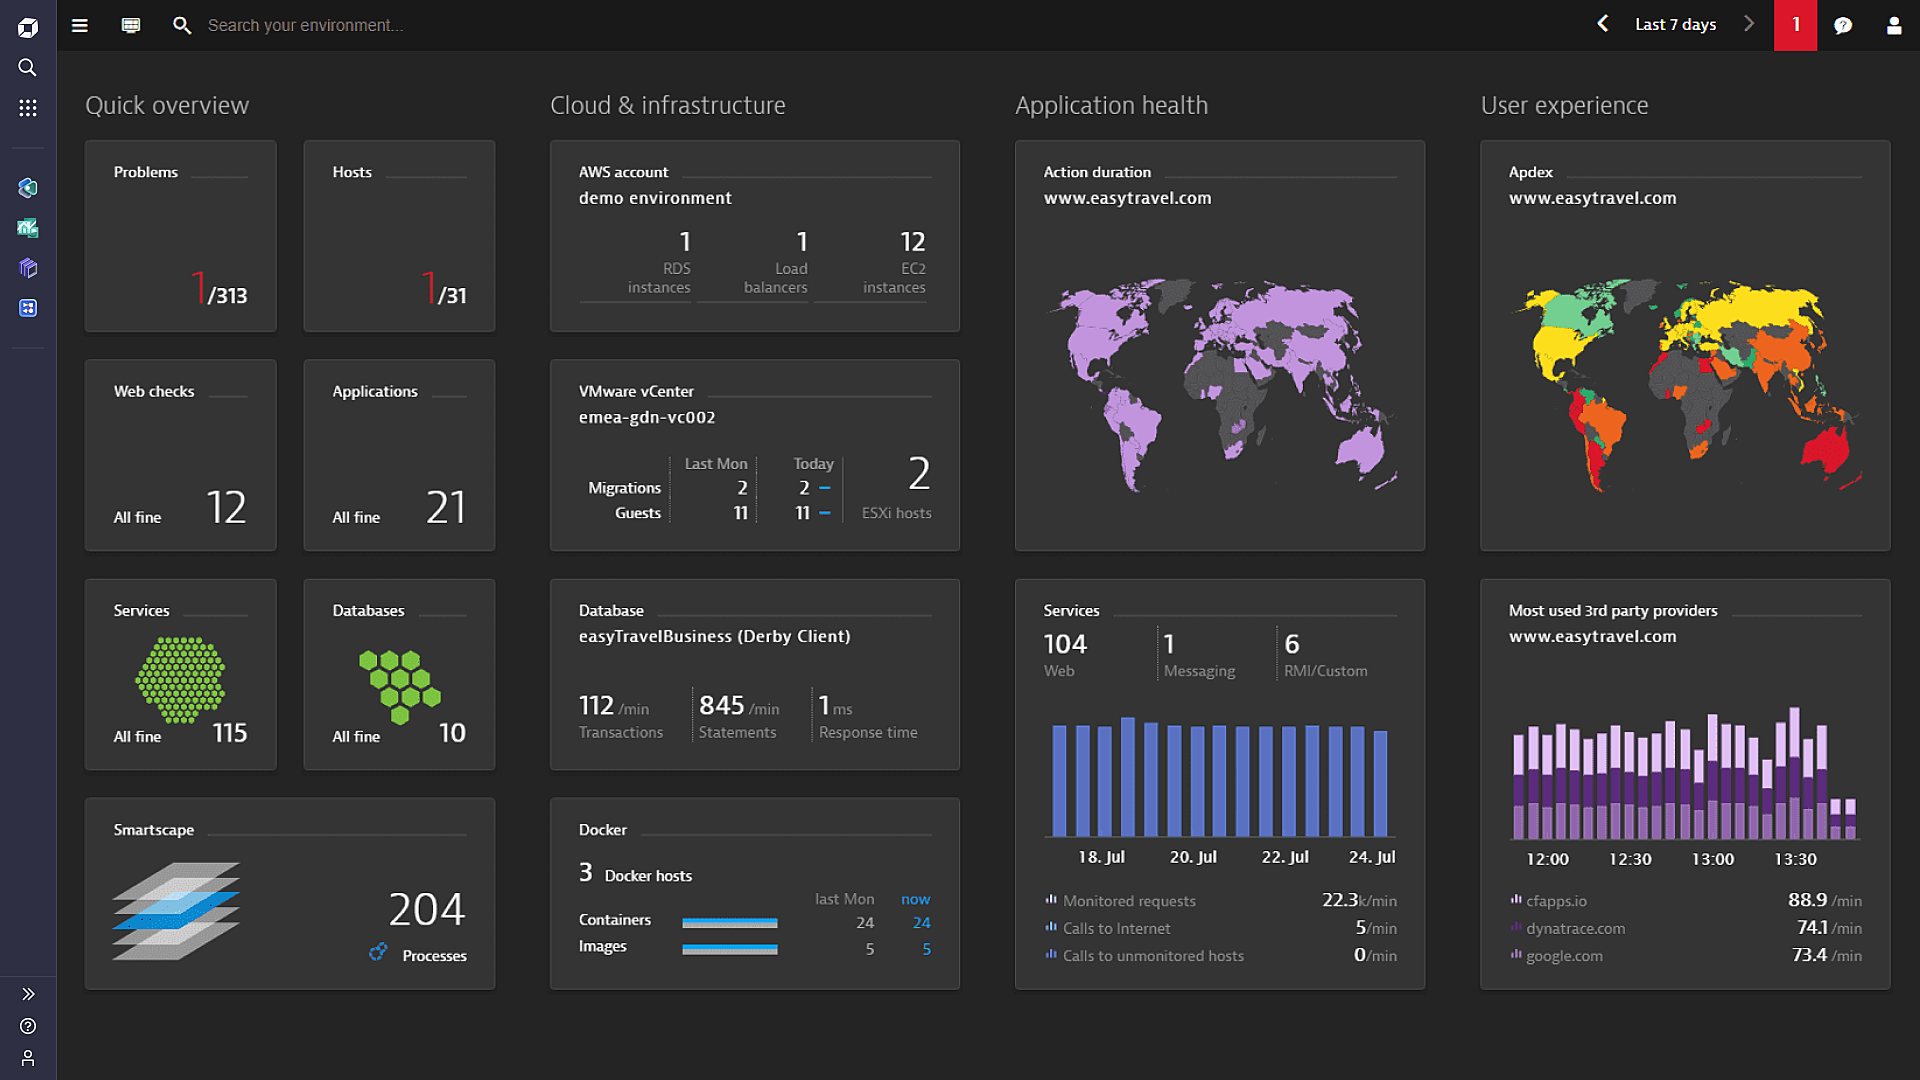
5. Dynatrace
Dynatrace is an AI-powered observability platform for cloud and hybrid environments. It extends the traditional observability pillars of metrics, logs, and traces with user-experience, security, and topology data to provide full context for observed data. Its OneAgent automatically discovers and instruments applications, containers, services, processes, and infrastructure on start-up with no manual configuration, and keeps itself updated across the environment. A real-time entity topology map unifies dependencies across all observability data, and Dynatrace’s causation-based AI uses that context to automate root-cause analysis even in highly dynamic microservice environments. The platform supports OpenTelemetry as an additional data source and is built to scale across multi-cloud environments.

Source: Dynatrace
Key features include:
- Automatic discovery and instrumentation: The Dynatrace OneAgent detects all applications, containers, services, processes, and infrastructure on start-up and instruments them automatically with zero configuration or code changes. This is intended to provide complete coverage as environments scale and change.
- Real-time topology mapping: Dynatrace captures and unifies the dependencies between all observability data, combining metrics, logs, traces, user experience, and security data into a single real-time entity topology map. This map is the basis for the platform’s analysis and correlation.
- Causation-based AI: Dynatrace Intelligence automates anomaly detection and root-cause analysis and provides precise answers rather than dashboards alone, including in dynamic microservice environments. The goal is to remove much of the manual investigation that traditional monitoring requires.
- Contextual full-stack observability: The platform extends metrics, logs, and traces with UX, security, and topology data so issues can be understood from user impact through entity interdependencies. This provides context across the full stack instead of isolated signals.
- Automatic baselining: Smart baselining automatically learns normal performance and adapts dynamically as the environment changes. This supports anomaly detection without teams having to set and maintain static thresholds.
- OpenTelemetry support and scalability: Dynatrace works with OpenTelemetry as an additional data source and automates data collection and analysis, so observability scales across microservices running on many hosts in multi-cloud environments.
Limitations (as reported by users on G2):
- Pricing and licensing: Users report that Dynatrace can be expensive with complex licensing, which can be a barrier for smaller teams and some larger deployments.
- Complexity and learning curve: The breadth of features and configuration options can be overwhelming, with a steep learning curve for new users.
- User interface: Some users find parts of the management interface and navigation less intuitive than expected.
- Integration costs and gaps: Integrating with some third-party tools can incur additional licensing costs, and users note certain monitoring areas that could be improved.
6. LogicMonitor

LogicMonitor is a SaaS-based hybrid observability platform whose core product, LM Envision, unifies metrics, logs, events, and traces in a single platform. It monitors infrastructure across networks, servers, virtual machines, SD-WAN, databases, storage, and configuration, and extends to cloud and multi-cloud environments (AWS, Azure, Google Cloud, and Oracle Cloud Infrastructure) and containers. Onboarding uses lightweight, agentless collectors with automated discovery, and the platform offers AI-powered anomaly detection, dynamic thresholds, and usage forecasting. It includes more than 3,000 integrations and an AIOps layer, Edwin AI, that correlates alerts across tools, filters noise, and surfaces issues in plain language. Topology mapping links infrastructure components to support root-cause analysis and trend identification.
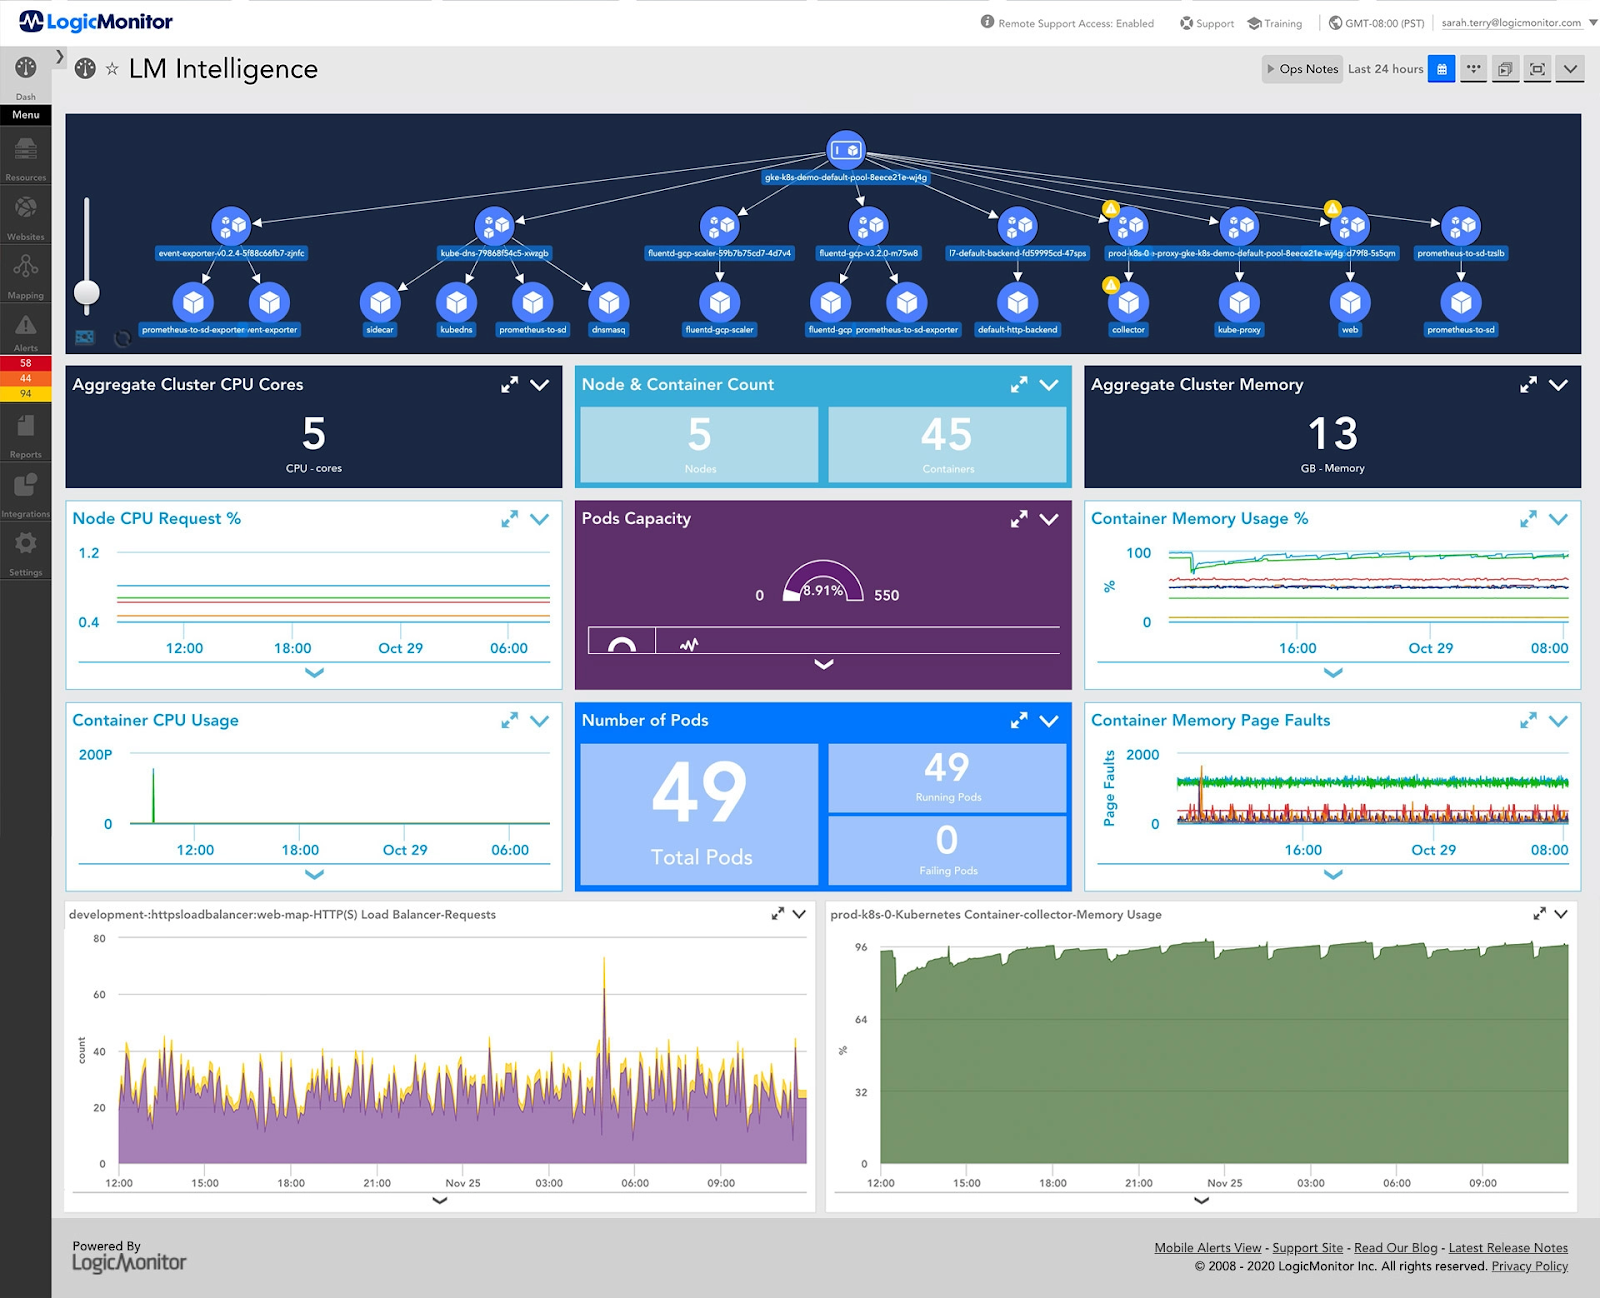
Source: LogicMonitor
Key features include:
- Agentless infrastructure monitoring: LogicMonitor onboards infrastructure in minutes using lightweight, agentless collectors and automated discovery, without scripting or manual configuration. It covers networks, servers, virtual machines, SD-WAN, databases, storage, and configuration within one platform.
- Cloud and hybrid coverage: The platform consolidates visibility across on-premises, cloud, and hybrid environments, with monitoring for AWS, Azure, Google Cloud, and Oracle Cloud Infrastructure as well as containers. This is delivered through the unified LM Envision platform rather than separate tools.
- AI-driven anomaly detection and forecasting: LogicMonitor identifies risks using AI-powered anomaly detection, dynamic thresholds, and usage forecasting so teams can act before performance degrades. Dynamic thresholds adjust automatically with the aim of reducing false positives.
- Intelligent alerting and Edwin AI: The platform reduces alert noise with intelligent alerting that surfaces what is urgent and actionable, and the Edwin AI agent correlates alerts across tools, filters noise, and explains issues in plain language. This is aimed at lowering mean time to resolution and alert fatigue.
- Topology mapping: LogicMonitor maps the relationships between infrastructure components to accelerate root-cause analysis and to identify trends over time. This provides context that helps teams trace issues back to their source.
- Integrations and log management: The platform connects with more than 3,000 technologies out of the box across infrastructure, cloud, networking, and applications, and includes log management and analytics alongside metrics in the same platform.
Limitations (as reported by users on G2):
- Learning curve: Advanced configuration and tuning can be laborious, and users may need training before they can use the platform’s more advanced features.
- Cost: Users find the platform expensive, particularly for smaller teams or organizations with limited budgets.
- Reporting and dashboard customization: Some users want more flexibility in customizing report and dashboard visuals.
- Feature and integration gaps: Some users report feature deficiencies that require workarounds, along with challenges configuring certain integrations and managing alerts.
Learn more in our detailed guide to Turbonomic Competitors
Conclusion
IBM Turbonomic is a solution for optimizing application performance and managing IT resources efficiently across complex infrastructures. Its continuous real-time analysis and automation capabilities make it an effective tool for maintaining a balance between resource allocation and performance.
However, organizations should consider customization requirements and integration limitations before full implementation. A lightweight, agentless approach can deliver faster results with fewer security concerns, making it ideal for businesses that prioritize scalability, simplicity, and performance without added complexity.
Learn more about Faddom for IT environment mapping by booking a demo with our expert team!
See Additional Guides on Key Cybersecurity Topics
Together with our content partners, we have authored in-depth guides on several other topics that can also be useful as you explore the world of cybersecurity.
Solarwinds SAM
Authored by Faddom
- [Guide] SolarWinds SAM: Key Features,Pricing, Limitations, and Alternatives
- [Guide] PRTG Network Monitor vs. SolarWinds: 4 Key Differences and How to Choose
Device42
Authored by Faddom
- [Guide] Device42: 5 Key Features, Limitations, and Alternatives
- [Guide] Device42 Pricing: The 5 Pricing Tiers Explained – Faddom
- [Product] Faddom | Instant Application Dependency Mapping Tool
Disaster Recovery
Authored by Cloudian

