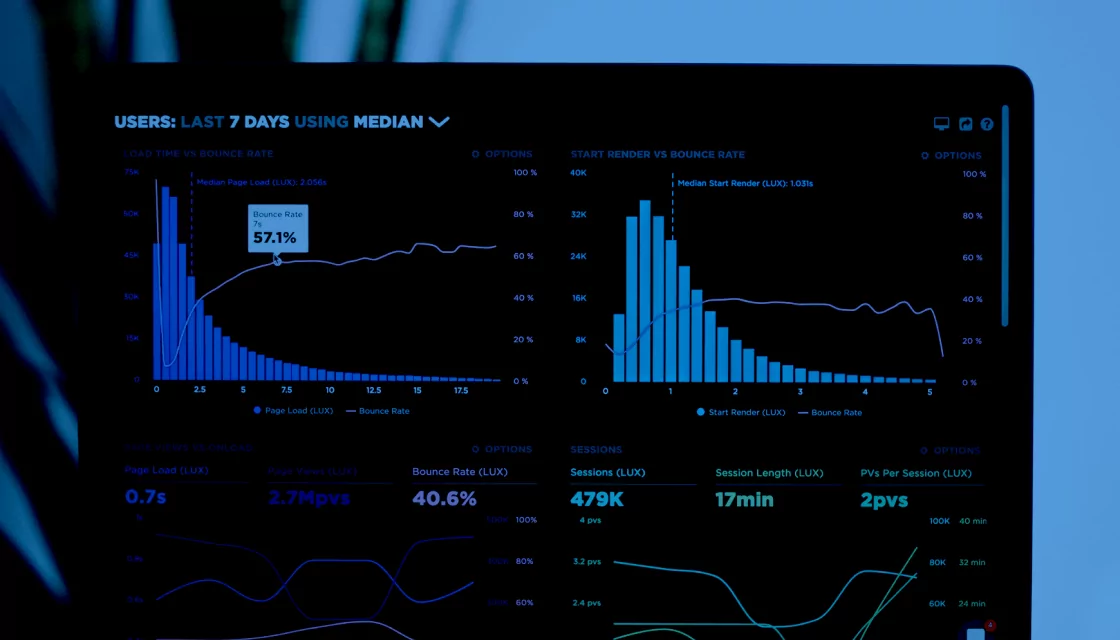
What Is Paessler PRTG Monitoring?
Paessler PRTG is an IT monitoring solution that enables system administrators to monitor the health, performance, and availability of network devices, services, and applications across on-premises, cloud-based, or hybrid environments. It provides three main products: PRTG Network Monitor, suitable for small to mid-size IT infrastructure, PRTG Enterprise Monitor, suitable for large IT infrastructure, and PRTG Hosted Monitor, a cloud-based solution.
By providing real-time data and alerts for potential issues, PRTG helps IT systems operate smoothly. Its features include automatic network discovery, customizable dashboards and reports, distributed monitoring capabilities, and support for multiple technologies such as SNMP, WMI, SSH, HTTP requests, and flow protocols like NetFlow.
This is part of an extensive series of guides about cybersecurity
Paessler PRTG Monitoring Products
PRTG Network Monitor
PRTG Network Monitor is designed for small to medium-sized IT environments, offering comprehensive monitoring capabilities. It provides a centralized view of the network, making it easier for system administrators to track the performance and availability of various devices, applications, and services. This solution supports a range of monitoring technologies, including SNMP, WMI, SSH, and flow protocols, ensuring compatibility with diverse IT setups.
The software includes features like automatic network discovery, which simplifies the setup process by identifying and categorizing all networked devices. Additionally, PRTG Network Monitor offers customizable dashboards and reports, enabling users to tailor their monitoring experience to specific needs.
PRTG Enterprise Monitor
PRTG Enterprise Monitor extends Paessler’s monitoring capabilities to large IT infrastructure. It enables organizations to monitor their entire IT environment, including business services and SLAs. Its architecture supports an unlimited number of PRTG servers, allowing for increased flexibility in monitoring extensive networks across various locations.
This enterprise solution includes features like centralized overview through PRTG MultiBoard, service-based SLA monitoring with ITOps Board, and offline monitoring capabilities. These functionalities cater to the needs of large-scale environments, providing a consolidated view of multiple installations and ensuring security for air-gapped systems.
PRTG Hosted Monitor
PRTG Hosted Monitor delivers cloud-based monitoring for IT infrastructure, suitable for both small and large environments. This service allows users to monitor systems, devices, applications, and traffic without installing dedicated hardware. Hosted on AWS servers, it’s easy to set up and use, providing flexibility through a subscription-based pricing model.
The service is designed for ease of maintenance with automatic updates and backups, allowing customers to avoid the complexity and overhead of managing PRTG infrastructure.
Learn more in our detailed guide to PRTG monitoring
Paessler PRTG Monitoring Features
PRTG offers the following features:
- Distributed monitoring: Allows organizations to oversee multiple remote locations through a single interface, useful for geographically dispersed sites. System administrators can centrally manage and analyze the health and performance of all IT assets.
- Automatic network discovery: Simplifies the initial setup and ongoing management of IT monitoring. It automatically identifies all devices within a network, such as servers, routers, switches, and printers, and creates appropriate monitoring sensors for them.
- Maps and dashboards: Offer users a visual representation of their IT infrastructure, allowing for real-time monitoring and quick access to data from various devices and services. With the PRTG map designer, users can create custom maps that display live status information, making it easier to understand the network’s performance.
- Customizable reporting: Allows users to generate detailed reports on the status and performance of their IT infrastructure. Administrators can select specific data points, set the reporting period, and design the layout of reports to meet their unique requirements.
Paessler PRTG Monitoring Limitations
When evaluating PRTG, you should be aware of the following limitations, reported by users on the G2 platform.
Alarm Management Complexity
Managing alarms in PRTG can become complex due to the volume and variety of alerts generated across the IT infrastructure. As networks expand and diversify, system administrators may face challenges in prioritizing and responding to alarms. They need to fine-tune alert thresholds and filter out false positives to minimize unnecessary notifications.
Cost
The cost of PRTG is influenced by the scale of deployment and the monitoring needs of an organization. PRTG offers a free version with limited sensors for small networks, but larger deployments can be expensive, with associated software licensing and maintenance costs.
Customization Requirements
Customizing PRTG to fit specific monitoring needs requires understanding both the IT infrastructure and the tool’s capabilities. Users may need to invest time in setting up custom sensors, maps, and reports that align with their operational objectives, which can require significant time and effort.
Paessler PRTG Alternatives
Application Dependency Mapping and Visibility Tools
1. Faddom

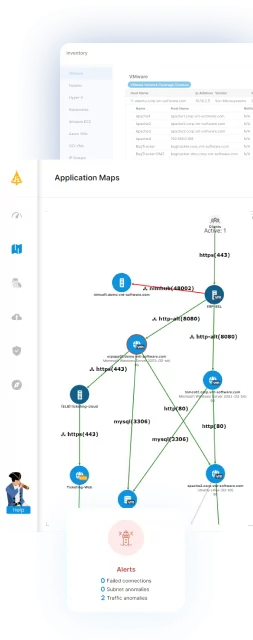
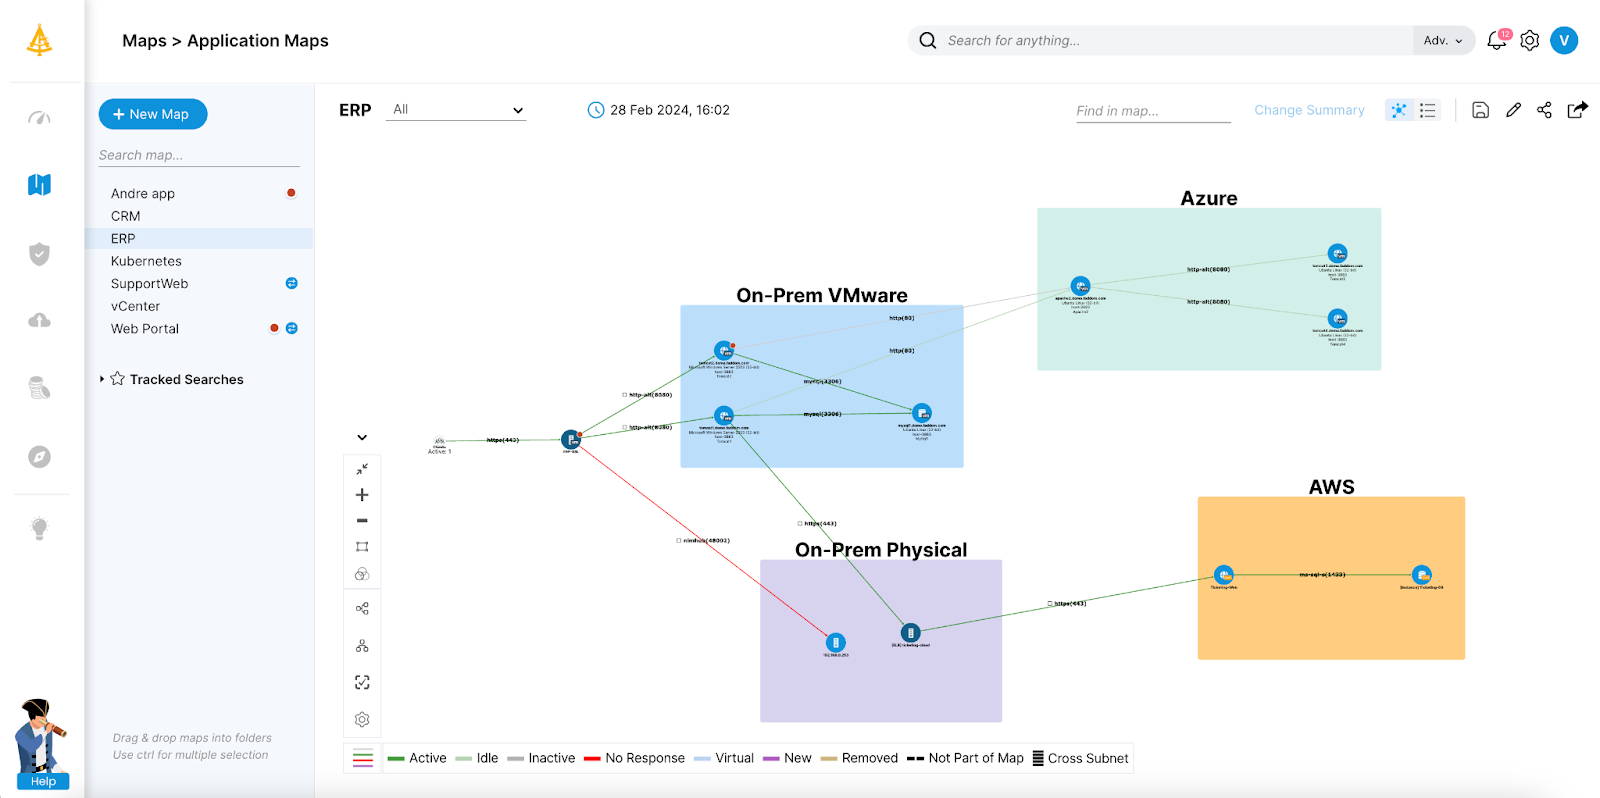
Faddom is an agentless application dependency mapping tool that discovers servers and automatically groups them into the business applications they support. It builds a real-time map of on-premises and cloud infrastructure, typically producing a first map within about an hour of deployment, without installing agents, opening firewalls, supplying server credentials, or sending data outside the environment. Faddom works by analyzing a copy of network traffic, optionally supplemented by credentials for deeper detail, and it continuously updates the map 24/7 as the environment changes. It is used for change management, cloud and data center migration planning, microsegmentation, IT audit and compliance documentation, cost optimization, and detecting external connections and vulnerabilities. The platform is positioned as an operational context layer that turns raw network data into application and dependency maps for IT and security teams.
Key features include:
- Agentless, passive discovery: Faddom maps dependencies from a copy of network traffic, so no agents are installed on servers, no server credentials are required, and no firewall changes are needed. Data stays inside the environment, and the tool can also operate offline, which suits highly segmented or sensitive networks.
- Automatic application grouping: The tool discovers all types of servers and automatically groups them into the business applications they support. Users can select an entry point such as a host or database and build out an application map from there, reducing reliance on manual documentation.
- Hybrid and multi-cloud mapping: Faddom maps on-premises and cloud infrastructure together in a single view, connecting multiple data sources and virtualization platforms such as VMware. This gives teams one picture of dependencies across hybrid estates rather than separate, siloed views.
- Real-time, continuously updated maps: The platform maps the entire environment in real time and updates 24/7, tracking changes as they happen. Users can also view earlier versions of maps to understand what changed before an issue appeared.
- Change tracking and alerting: Faddom tracks communication flows and changes between systems and can apply rules and send alerts. This supports change control, flow troubleshooting, and segmentation planning by surfacing how systems actually communicate.
- Security and risk insights: A secure section includes SSL certificate tracking, external network discovery, and software vulnerability detection (for example, identifying outdated software versions such as old Java components). These features help surface exposed external traffic and risks across the mapped environment.
Limitations (as reported by users on G2):
- Learning curve: The terminology and full breadth of features take some time to become familiar with, and the tool delivers the most value through ongoing use rather than a one-time setup.
- Reporting and export options: Some users would like more polished exportable reports and larger working areas for certain views, such as when exporting lists.
- Duplicate device entries: When a virtual machine is migrated or an IP address changes, the same device can occasionally appear under more than one hostname, which requires manual cleanup.
2. Device42

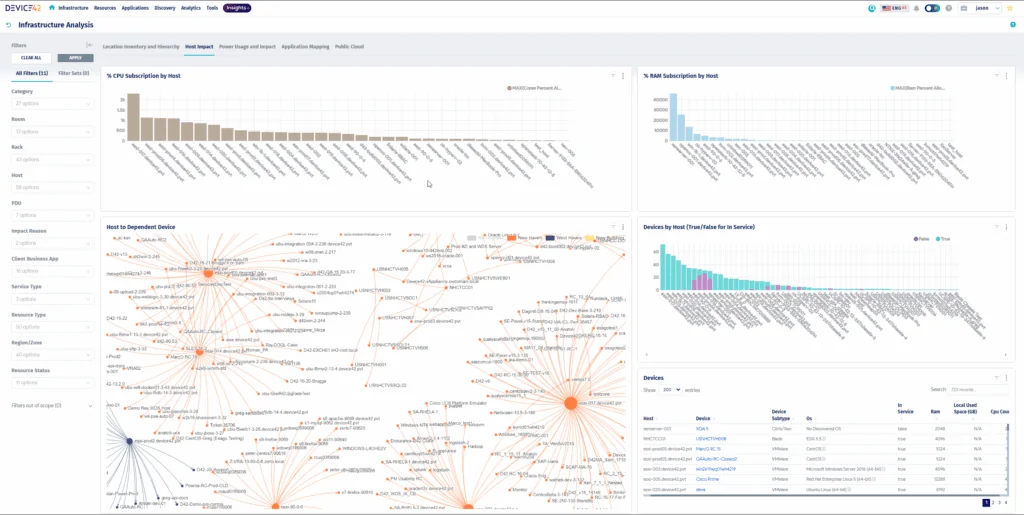
Device42, now part of Freshworks, is an agentless discovery and dependency mapping platform for hybrid and multi-cloud environments. It automatically discovers infrastructure and applications and visualizes how they connect across on-premises, cloud, and hybrid estates. The platform groups assets into Application Groups based on real communication patterns and assembles Business Services views that show how components combine into critical services. It is used for incident response and root-cause tracing, change management and modernization, compliance documentation, and migration planning. As part of Freshworks, it also feeds asset and dependency data into ITSM and ITAM workflows.
Key features include:
- Automated service discovery: Device42 discovers active services and the ports they use across on-premises, cloud, and hybrid environments. It identifies inter-service dependencies by recognizing communication patterns, without requiring costly span ports to be configured.
- Application Groups: The platform automatically groups assets based on real communication patterns, and calculation rules let teams define what belongs in a group using criteria such as service type and start or end points. A timeline view tracks how groups change over time.
- Business Services views: Teams can build a visual representation of how components, devices, and resources form critical business services. These views hold metadata such as application type, owners, SLAs, and disaster recovery details, and charts can be printed or exported.
- Impact charts and impact lists: Auto-generated diagrams show service connections and potential ripple effects, while impact lists reveal which services and organizational groups are affected when a single device changes or fails. This helps teams scope the effect of incidents and changes.
- Dependency mapping for migrations: Device42 reveals legacy systems and their connections to active applications and shows upstream and downstream relationships. This supports planning migrations or asset consolidation while reducing the risk of unexpected disruptions.
- Continuously updated documentation: The platform keeps dependency documentation current to support audits and governance, including frameworks such as ISO 27001, SOC 2, and HIPAA. This reduces the manual effort of preparing for audits.
Limitations (as reported by users on G2):
- Setup and learning curve: The tool can feel complex to set up and navigate at first, particularly for smaller teams, and some users wanted more standardized, self-serve training early in onboarding.
- Performance at scale: Users report occasional performance slowdowns when handling very large datasets or high volumes of requests.
- Add-on pricing: Some capabilities are priced separately as add-ons rather than included in a single all-inclusive product price.
3. Lansweeper

Lansweeper is an IT discovery and inventory platform that automatically finds and catalogs every connected asset across IT, OT, IoT, and cloud environments. It builds a continuously updated inventory of hardware, software, and users using a mix of active scanning, passive discovery, cloud API connectors, and lightweight agents. Beyond identifying devices, it records hardware specifications, installed software, configurations, and OS versions, and it surfaces vulnerabilities, lifecycle risks, and shadow IT. Organizations use Lansweeper as a single source of truth to support asset management, security, audits, and CMDB or ITSM processes across distributed environments.
Key features include:
- Multi-method discovery: Lansweeper combines active scanning, passive discovery, cloud API connectors for AWS, Azure, and Google Cloud, agents for Windows, macOS, and Linux, third-party imports from SCCM and Intune, and manual CSV or XLS uploads. Combining these methods is intended to provide complete asset coverage.
- Full-spectrum asset coverage: The platform discovers workstations, servers, printers, switches, routers, virtual machines, cloud instances, mobile devices, and OT or IoT assets such as PLCs. This spans physical, virtual, and cloud environments in one inventory.
- Centralized asset inventory: Lansweeper maintains a single, continuously updated inventory that normalizes hardware, software, user, and configuration data into one record per asset. The aim is a living source of truth that does not rely on manual scans.
- Risk and shadow IT detection: The tool detects and classifies unmanaged or rogue devices as they join the network, alerts when new devices appear, and surfaces vulnerabilities and end-of-life software. This helps reduce blind spots and improve response time.
- Relationship and topology diagrams: Lansweeper generates diagrams that show relationships between assets, such as network topologies and virtual environments, layered on top of the inventory data. This helps teams understand how assets connect.
- Integrations and exports: Asset data can be fed into ITSM, security, and governance platforms, and exported to formats such as Excel, CSV, and PDF. This makes inventory data usable across other tools in the stack.
Limitations (as reported by users on G2):
- Interface learning curve: The interface can feel overwhelming for new users, and locating or changing configuration settings is not always intuitive.
- Data freshness: New scan results and changed IP addresses can take time to propagate, and cached data can be difficult to clear.
- Feature scope: The platform focuses on discovery and inventory and does not natively include patch management or software metering, so additional tools are needed for those tasks.
- Cloud-first development: Most newer features are developed for the cloud version, which can leave the on-premises edition with fewer major updates.
4. Auvik
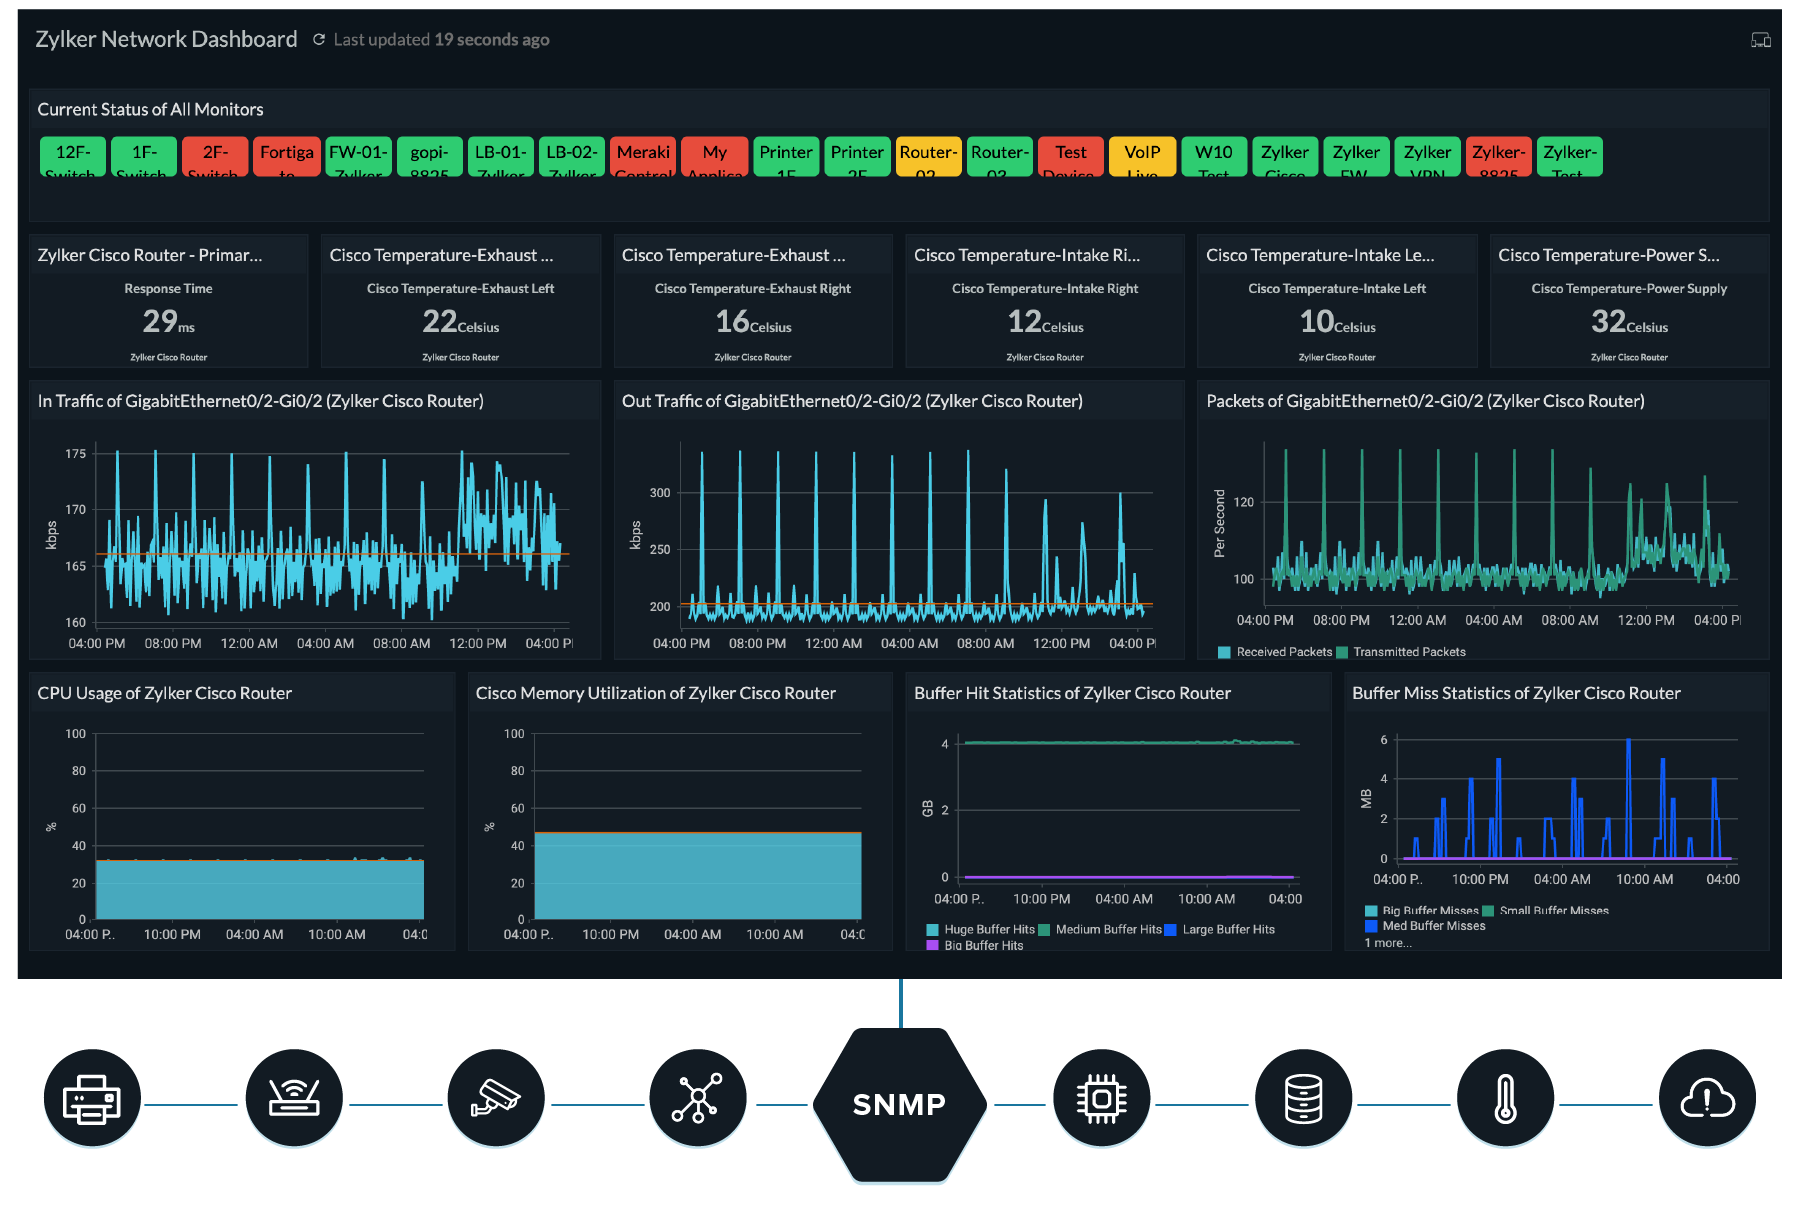
Auvik is a cloud-based network monitoring and management solution. After deploying a lightweight collector, it automatically discovers network devices and provides real-time visibility into performance across the infrastructure. Auvik collects data through SNMP, flow protocols, and syslog, tracking metrics such as bandwidth usage, latency, packet loss, jitter, and device status, and it ships with more than 50 preconfigured alerts tuned to network best practices. The platform centralizes syslog data, monitors VPN capacity, and is billed per managed device—such as firewalls, switches, routers, and wireless controllers—rather than per IP or interface.
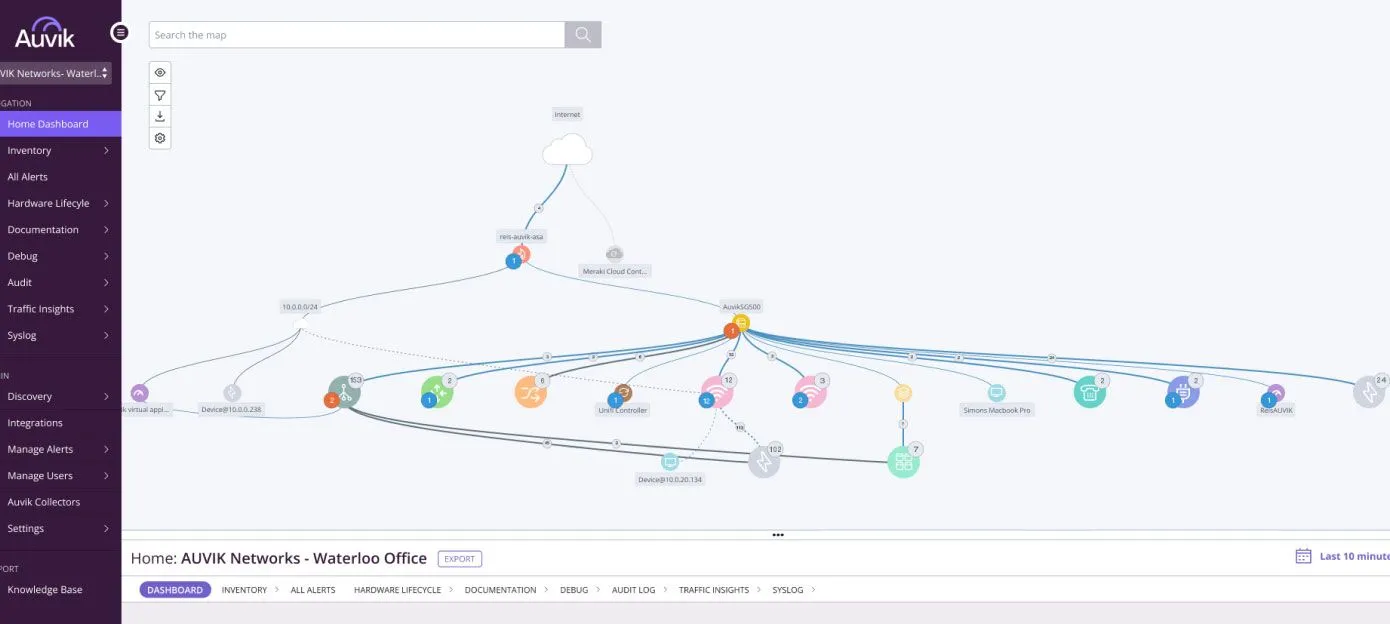
Source: Auvik
Key features include:
- Real-time monitoring with preconfigured alerts: Auvik can monitor networks immediately after deployment using more than 50 preconfigured alerts. Thresholds are customizable, and teams can add their own alerts for conditions such as VPN capacity, interface limits, or syslog patterns.
- In-depth performance monitoring: The platform analyzes metrics including packet loss, bandwidth usage, jitter, and interface errors, along with device CPU and memory load. This provides detailed insight into network health across the infrastructure.
- Centralized syslog and troubleshooting: Auvik consolidates syslog data from all devices into one location with search and filtering, and adds tools such as real-time packet capture and one-click device drill-downs. These help teams identify the source of network problems faster.
- VPN monitoring: The tool tracks active VPN sessions in real time, alerts as license limits approach, and monitors session counts across firewalls. This is intended to help avoid disruptions for remote workers.
- IT asset and lifecycle tracking: Auvik tracks asset details such as software versions and updates to identify devices nearing end-of-support or end-of-life. This supports hardware lifecycle management and upgrade planning.
- Capacity and failover insights: The platform identifies where capacity will max out and which overused links are causing congestion, and it provides alerts and metrics for high-availability firewall pairs. This supports capacity planning and reduces downtime.
Limitations (as reported by users on G2):
- Setup and configuration effort: Initial configuration can be cumbersome and time-consuming, and there is a learning curve to master the platform.
- Collector dependency: Monitoring relies on the on-site collector, so if the system hosting it goes offline, teams may need to revert to manual processes.
- Alert tuning: Getting alerts to the right level can require setup effort to avoid excess or less relevant notifications.
5. Site24x7 Network Monitoring

Site24x7 Network Monitoring is a cloud-based, AI-assisted network monitoring tool that is part of a broader observability platform. It continuously monitors network infrastructure—including routers, switches, firewalls, load balancers, and wireless controllers—across on-premises, cloud, and software-defined networks. The tool automatically discovers devices within IP ranges or CIDR blocks, builds topology and Layer 2 maps, and tracks interface-level and flow-based metrics. It supports more than 450 device types and flow formats such as NetFlow, sFlow, and J-Flow, and presents network data alongside servers, applications, and cloud resources within a single console.
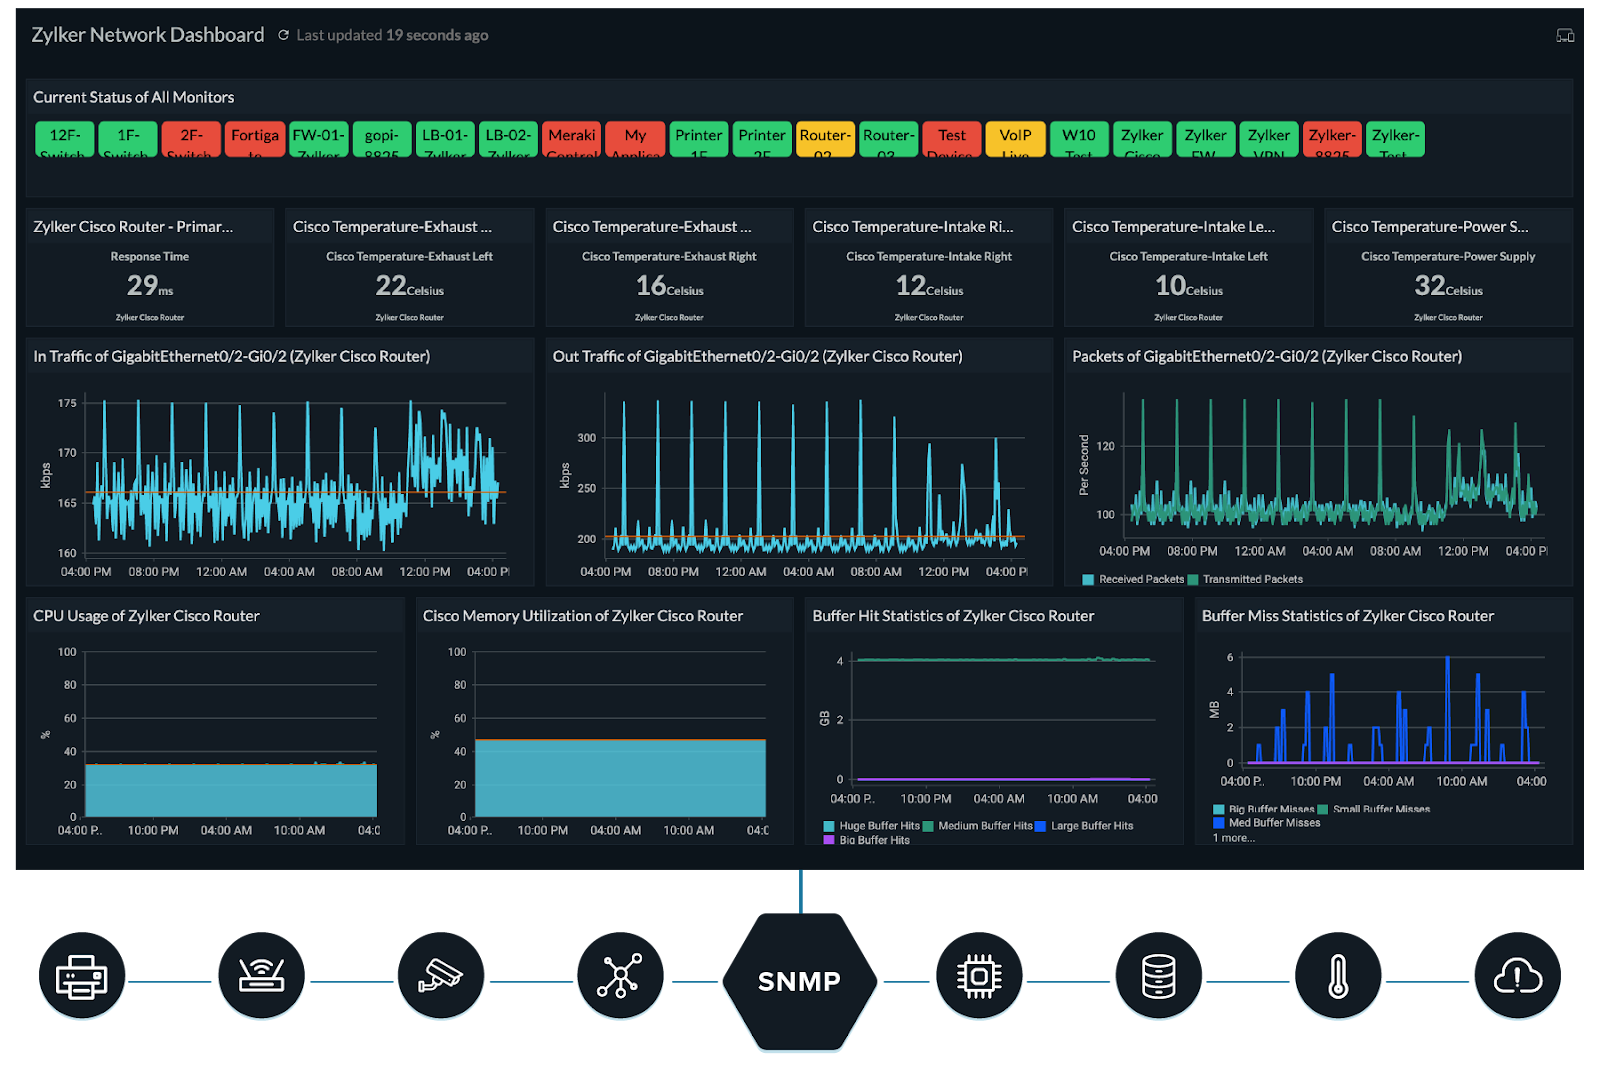
Source: Site24x7
Key features include:
- Automated discovery and mapping: Site24x7 detects devices within IP ranges or CIDR blocks and visualizes the network with topology maps, Layer 2 maps, and Cisco Meraki maps. This provides a current picture of the network without manual diagramming.
- Multi-vendor device monitoring: The tool monitors routers, switches, firewalls, load balancers, and wireless controllers across vendors and environments. It supports over 450 device types, with templates to simplify onboarding and ongoing coverage.
- Performance and interface metrics: Site24x7 tracks bandwidth, traffic patterns, latency, packet errors, and interface utilization in real time. This helps surface congestion, failures, and abnormal behavior early.
- Flow-based traffic analysis: The platform supports NetFlow, sFlow, J-Flow, and similar formats to analyze bandwidth usage and traffic patterns. This helps identify traffic peaks and top applications across the network.
- SNMP trap processing and alerting: Site24x7 processes SNMP traps and applies automated thresholds and alerts to detect issues. Alerts can notify administrators when thresholds are breached.
- Unified, cloud-hosted dashboards: Network metrics are presented alongside servers, applications, and cloud resources in customizable dashboards. The service is cloud-hosted with no maintenance overhead and dashboards accessible from anywhere.
Limitations (as reported by users on G2):
- Feature discoverability: Because the platform is feature-rich, advanced settings can be hard to locate, and deep configuration pages could be more streamlined.
- Pricing clarity: Some users find the pricing and licensing structure confusing to interpret.
- Alert noise: Default thresholds can be sensitive, generating repetitive notifications until they are tuned.
- Integrations: The tool offers fewer third-party integrations than some competing solutions.
6. ManageEngine OpManager
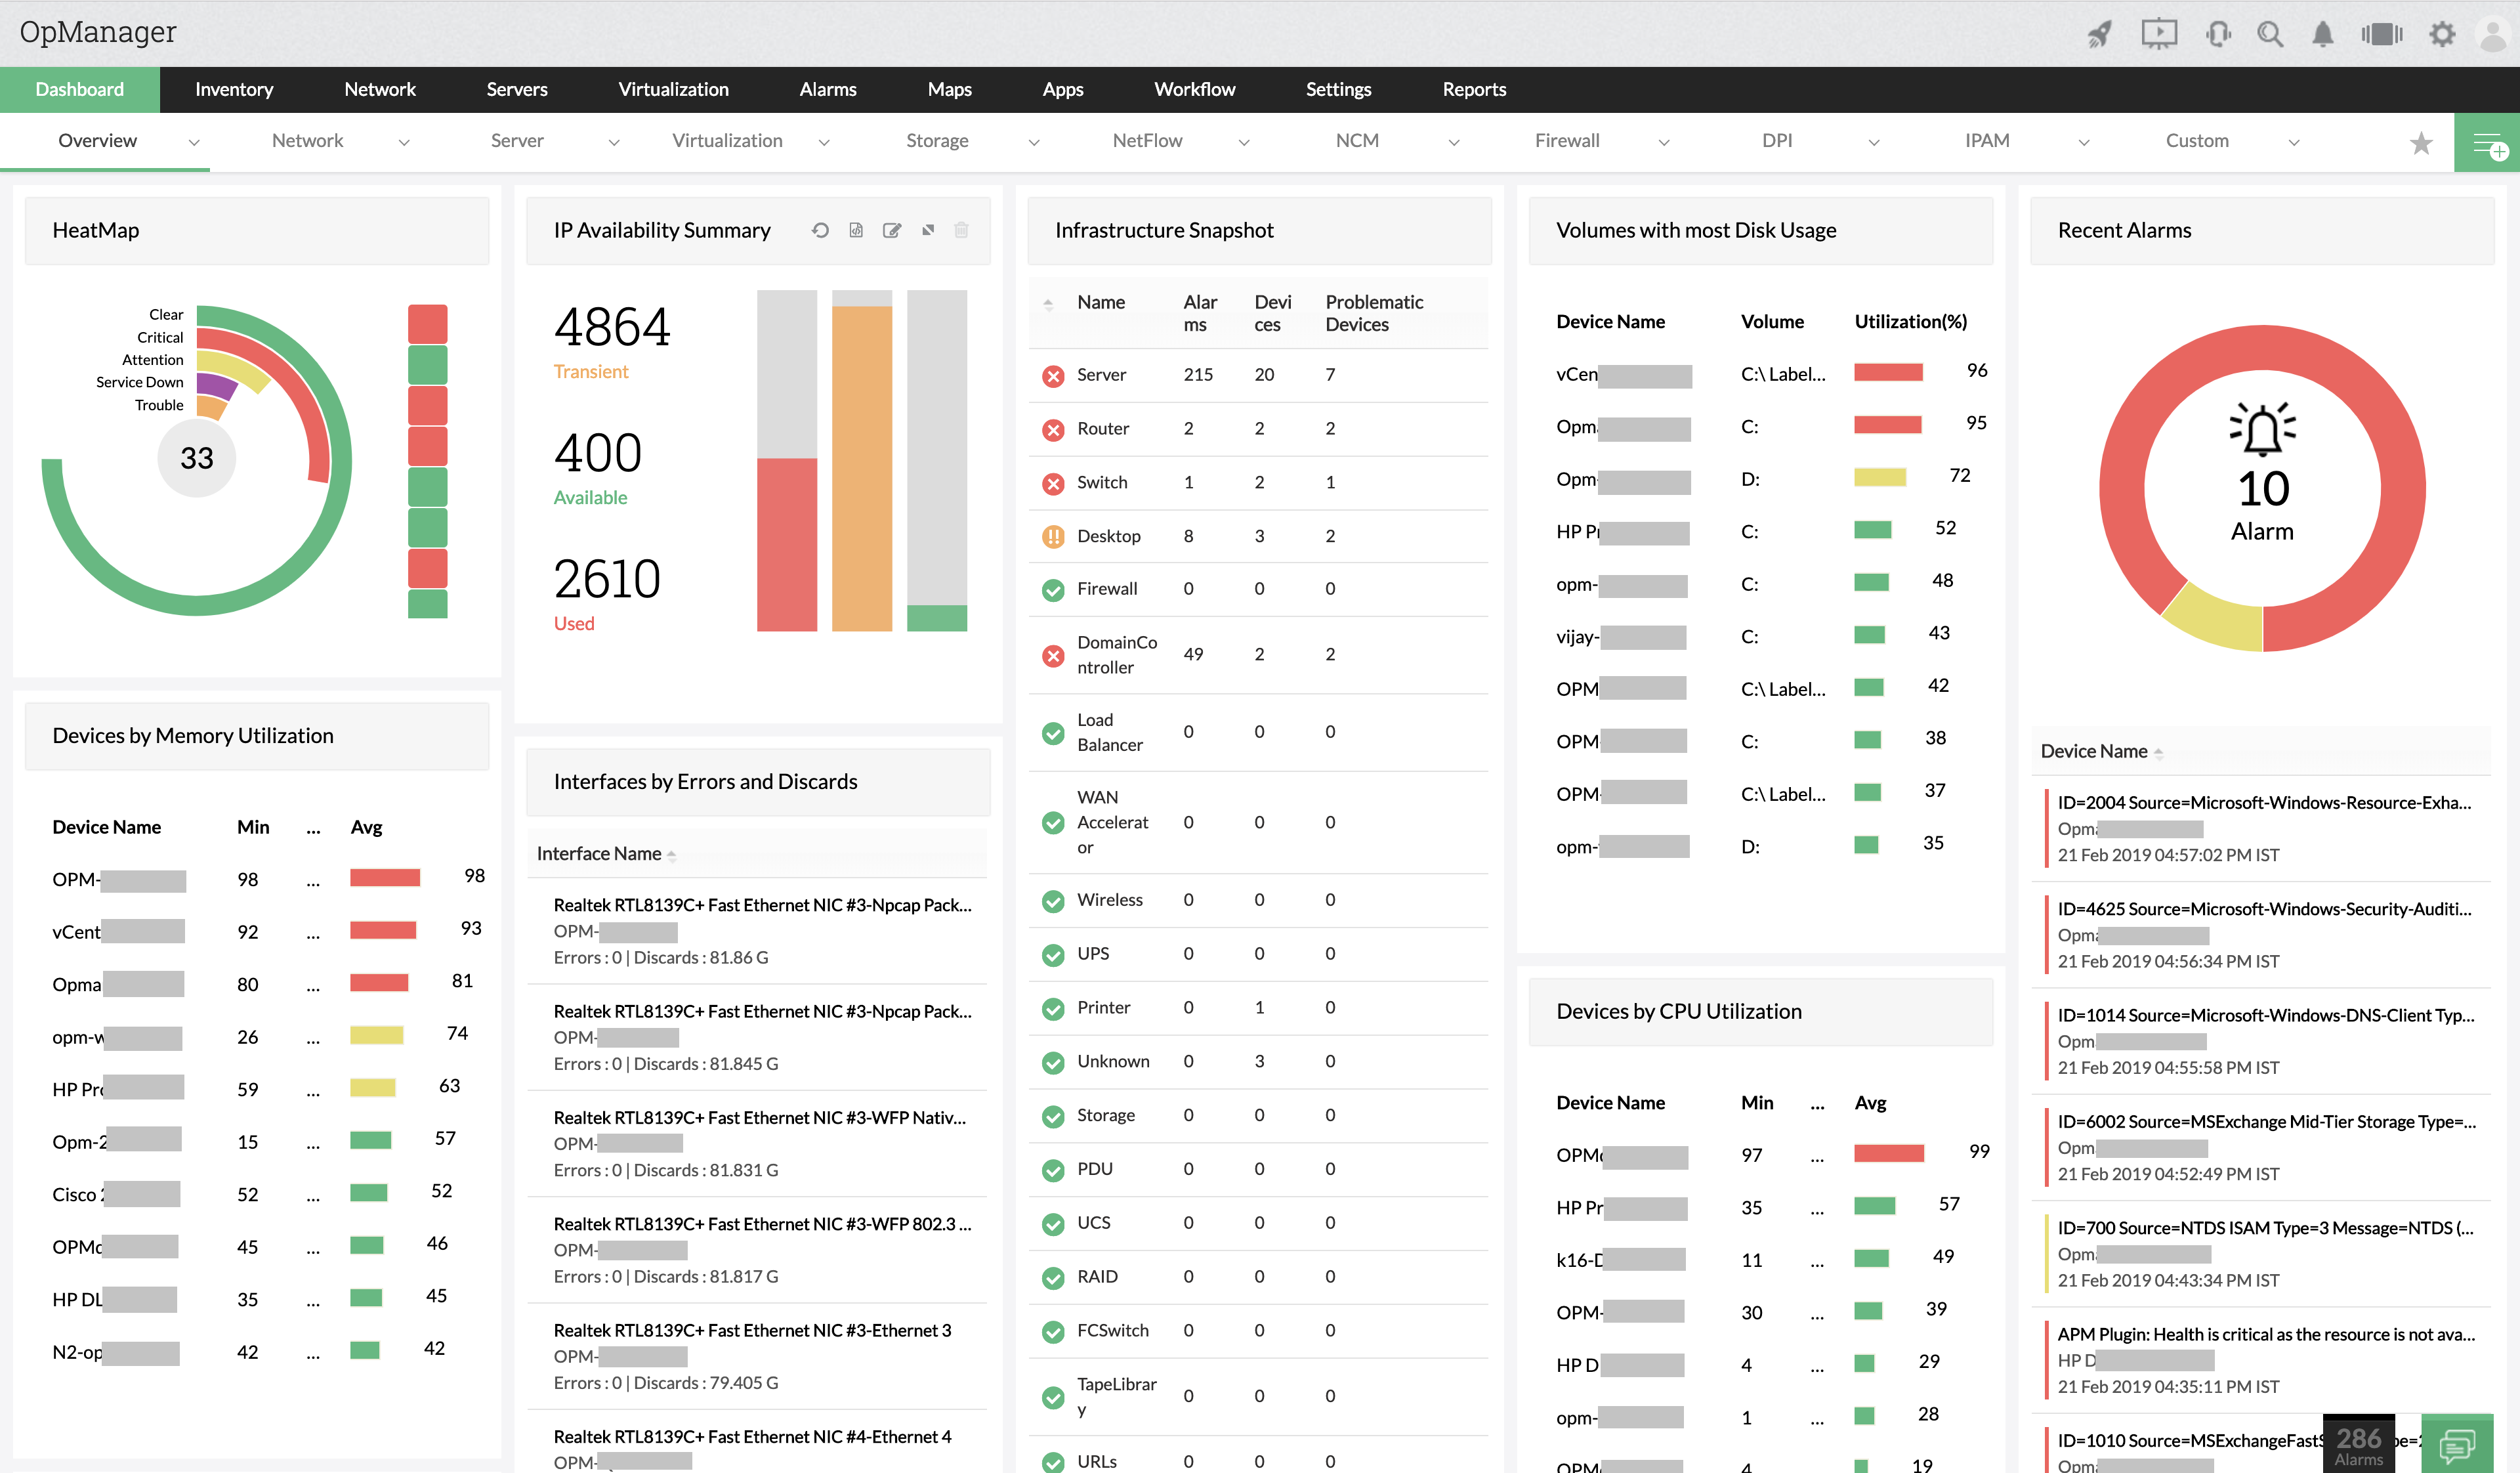
ManageEngine OpManager is a network and server monitoring solution that provides visibility into routers, switches, firewalls, load balancers, wireless LAN controllers, servers, virtual machines, printers, and storage devices. It uses protocols such as SNMP, WMI, and CLI to gather availability and performance data for any IP-based device, and it correlates raw events into color-coded, severity-based alarms. The software offers Layer 2 and virtual topology maps, business views, and 3D floor and rack views, and its Enterprise Edition uses a probe-central architecture for distributed monitoring across multiple sites. OpManager is available in tiered editions and offers mobile apps for monitoring on the go.
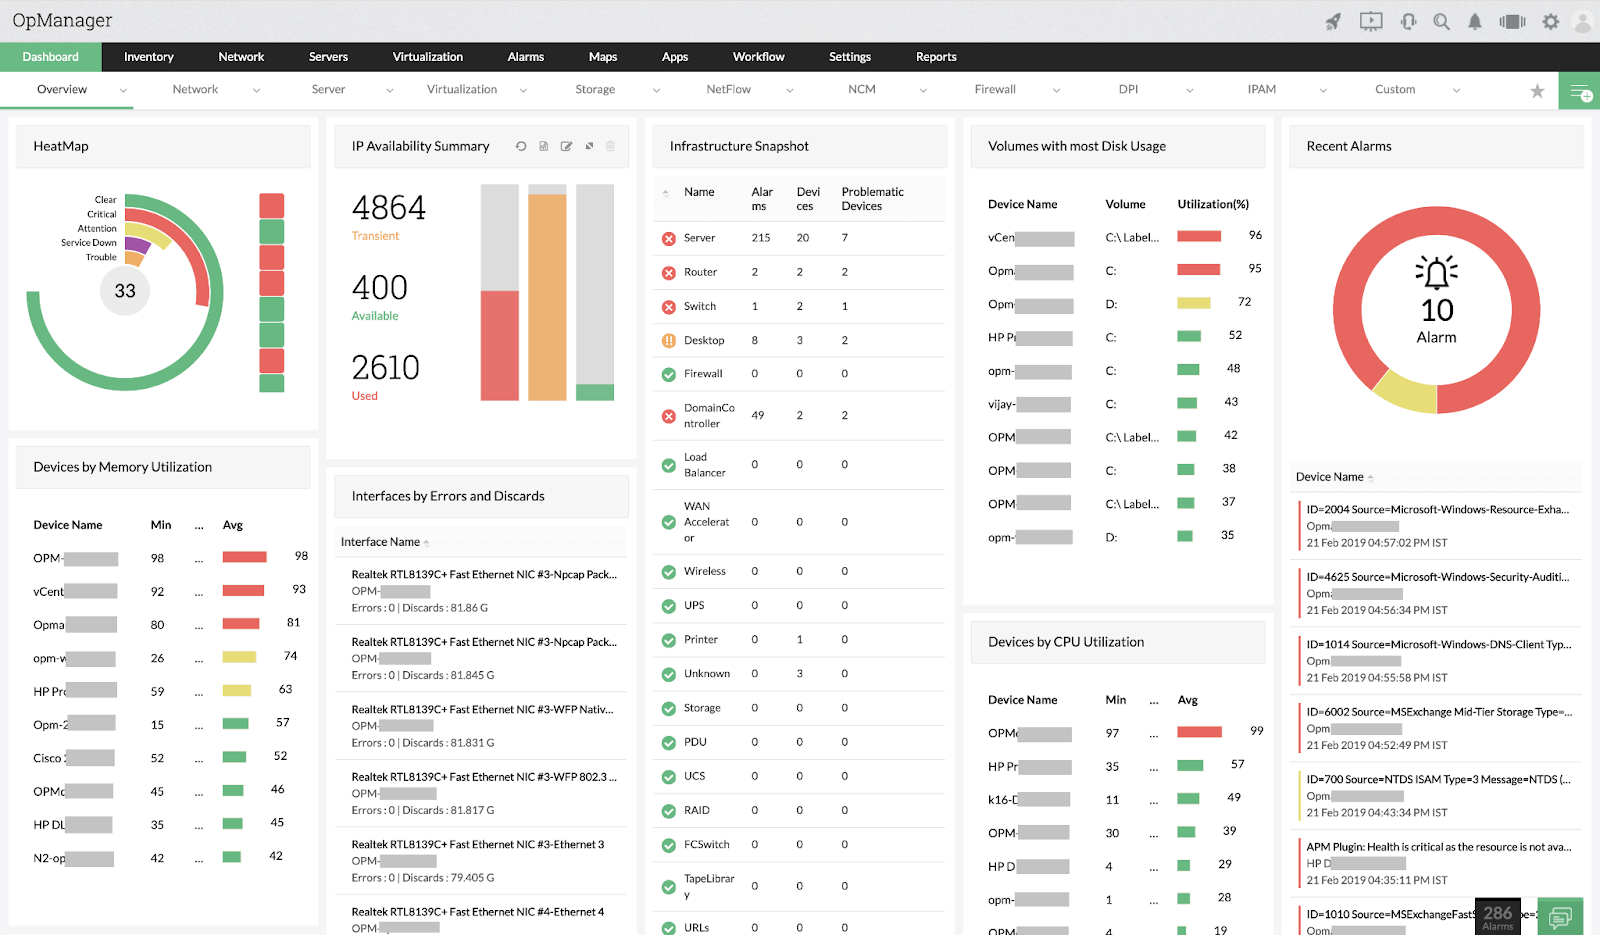
Source: ManageEngine
Key features include:
- Network and device monitoring: OpManager provides real-time visibility into device health, availability, and performance for any IP-based device. This includes routers, switches, firewalls, and wireless devices monitored from a central console.
- Physical and virtual server monitoring: The tool monitors physical servers and virtualized environments, including Hyper-V, VMware, Citrix, Xen, and Nutanix HCI. This helps ensure servers run at their expected performance levels.
- Fault management and alarms: OpManager correlates raw network events, filters out unwanted events, and presents color-coded alarms classified by severity. Notifications can be delivered via email and SMS so issues are caught early.
- Network visualization: The software offers Layer 2 maps, virtual topology maps, business views, and 3D floor and rack views. These representations help administrators visualize the data center and pinpoint outages.
- Distributed monitoring: The Enterprise Edition uses a probe-central architecture to monitor devices across multiple remote sites from a central server. It provides a unified inventory across probes and uses local database support to maintain data integrity during connection loss.
- Customizable dashboards and reports: OpManager includes over 200 performance widgets for custom dashboards, threshold-based monitors for alerts, and a mix of off-the-shelf and customizable reports. This supports tailored views and trend analysis.
Limitations (as reported by users on G2):
- Initial configuration and tuning: Initial setup and fine-tuning of alerts can be time-consuming, especially in large environments.
- Alert volume: If thresholds are not carefully tuned, the tool can generate a high number of alerts, which can lead to alert fatigue for operations teams.
- Interface and customization: The interface can feel heavy when handling a large number of devices, and dashboard and report customization is more limited than some users expect.
- Add-on licensing: Certain advanced capabilities require additional modules or licensing.
Remote Monitoring and Management (RMM) Platforms
7. Atera
Atera is a cloud-based RMM platform that combines remote monitoring and management with professional services automation in a single console. An agent installed on each device tracks metrics such as availability, CPU, RAM, disk usage, component temperatures, network bandwidth, and Windows events, and it supports Windows, macOS, and Linux. The platform adds patch management, software and asset management, network discovery, scripting and automation, ticketing and help desk, and built-in remote access through AnyDesk, Splashtop, TeamViewer, and ScreenConnect. Atera is priced per technician rather than per device, and it includes AI features such as AI Copilot and the Robin agent.
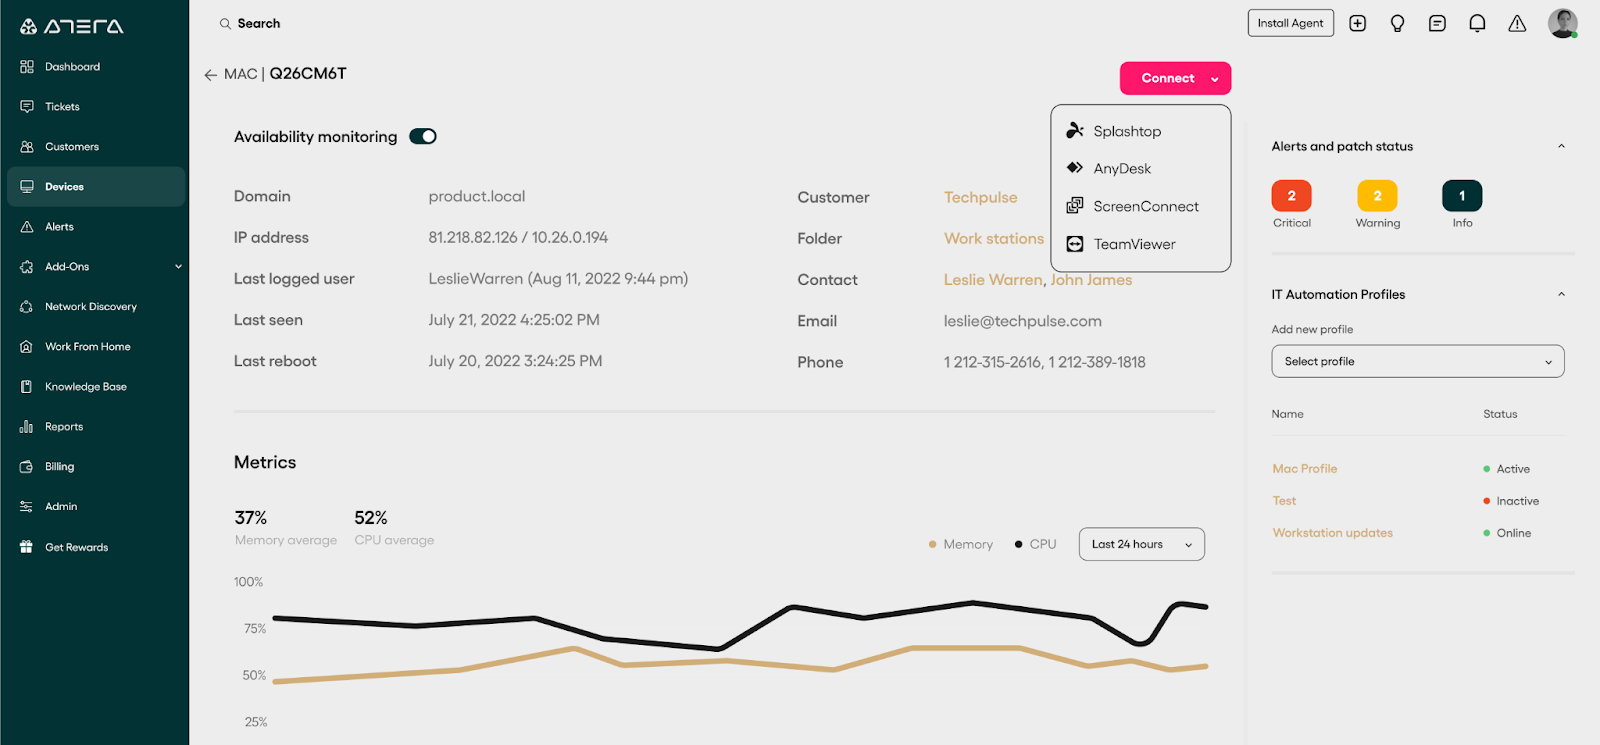
Source: Atera
Key features include:
- Remote monitoring and alerting: Atera provides real-time monitoring of device health and performance with alerts. This allows technicians to detect and address issues before they cause operational disruptions.
- Patch management: The platform automates Windows, macOS, Linux, and third-party software updates. Users can prioritize, sort, and schedule patches and apply customizable patching policies to minimize disruption.
- Remote access and management: Atera offers built-in remote access through AnyDesk, Splashtop, TeamViewer, and ScreenConnect. Technicians can troubleshoot issues and deploy updates from anywhere.
- IT automation and scripting: The tool automates maintenance and repetitive tasks and supports scripting, including AI-assisted script generation through AI Copilot. This is intended to reduce manual workloads.
- Network discovery and asset management: Atera maps connected devices for visibility into the infrastructure and tracks assets, including custom asset fields, from a central platform. This supports asset tracking and security visibility.
- Ticketing and help desk: An integrated, AI-assisted ticketing and service desk provides automated workflows and recommendations. This consolidates support operations within the same platform as monitoring.
Limitations (as reported by users on G2):
- Reporting customization: Built-in reporting is fairly basic, and more advanced or customizable reporting may require higher-tier plans or exporting data to other tools.
- Advanced feature depth: Some advanced features feel less mature than those in larger, enterprise-focused RMM platforms.
- Patch management consistency: Patching, particularly for third-party applications, can be inconsistent for some users.
- Mobile app and interface: The mobile app can be difficult to navigate, and some users report interface inconsistencies.
8. NinjaOne

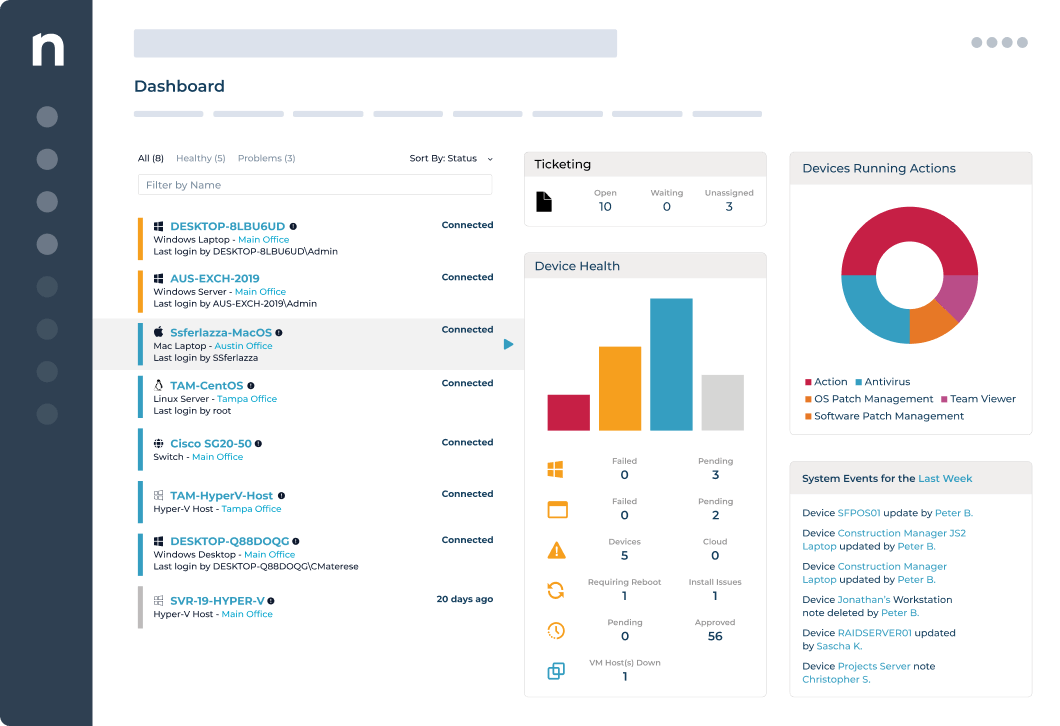
NinjaOne is a cloud-based RMM platform for monitoring, patching, and managing endpoints from a single console. It manages Windows, Mac, Linux, and cloud-based devices at scale, monitoring devices in real time and notifying technicians when issues arise. NinjaOne automates patching for operating systems and more than 200 third-party applications, supports endpoint task automation and condition-based auto-remediation, and provides secure remote access. Additional capabilities include a self-service portal, native documentation, mobile management, and warranty tracking, all delivered from a cloud-based infrastructure.
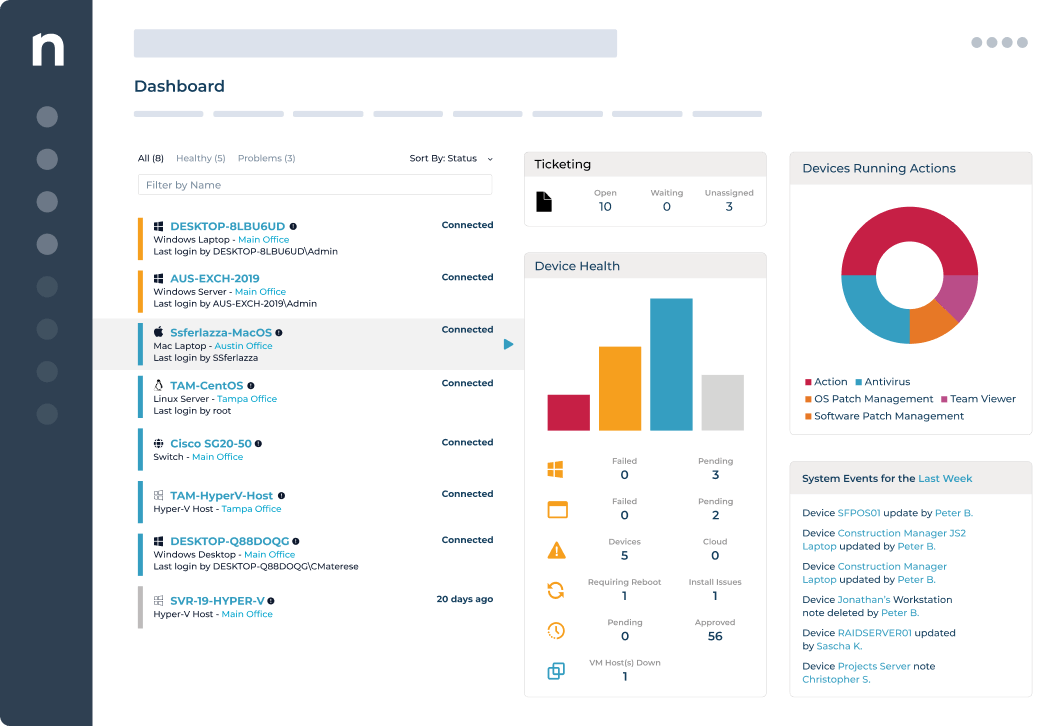
Source: NinjaOne
Key features include:
- Monitoring and alerting: NinjaOne monitors devices in real time and can automatically notify technicians or trigger remediations when an issue is detected. This is intended to minimize end-user impact and speed up response.
- Automated patching: The platform patches Windows, macOS, and Linux operating system vulnerabilities and auto-updates more than 200 third-party applications. This keeps endpoints current without manual effort.
- Endpoint task automation and auto-remediation: NinjaOne automates repetitive tasks such as application installs, patching, and device setup, and it uses condition-based scripts to detect and resolve issues like stopped services or missed reboots. This helps standardize outcomes across devices.
- Secure remote access and device actions: The tool provides remote access through several methods and one-click background actions, including terminal sessions, often without interrupting end-users. This supports hands-on remediation at scale.
- Cross-platform management at scale: NinjaOne manages Windows, Mac, Linux, and cloud-based devices on a cloud-based infrastructure, with mobile management and a self-service portal for end-users. It is designed to scale across large fleets of endpoints.
- Native documentation and warranty tracking: The platform documents processes, credentials, and device relationships within NinjaOne and automates warranty monitoring and alerts. This supports asset planning and reduces reliance on separate documentation tools.
Limitations (as reported by users on G2):
- Ticketing depth: The ticketing system feels limited compared to dedicated help desk platforms.
- Reporting: Built-in reports are not consistently presentation-ready, and custom client-facing reports can require additional effort or external tools.
- Deployment constraints: File-size limits on deployment packages and the lack of an instant push option can slow time-sensitive rollouts.
- Scripting depth: Scripting can be basic for advanced needs, and some users note gaps such as the absence of native PSA functionality.
9. Datto RMM

Datto RMM, part of Kaseya, is a cloud-based remote monitoring and management platform for MSPs and IT teams. It remotely secures, monitors, and manages endpoints—including servers, virtual machines, desktops, and laptops—with no hardware to maintain. The platform provides real-time monitoring with intelligent alerting, auto-response, and auto-resolution; automated patch management; built-in ransomware detection; and network topology maps. Remote support is delivered through a browser-based HTML5 Web Remote, and Datto RMM integrates with Autotask PSA and includes a native Microsoft 365 management module.
Key features include:
- Remote monitoring and alerting: Datto RMM monitors servers, VMs, desktops, and laptops in real time with intelligent alerts, auto-response, and auto-resolution. This is intended to reduce device downtime by surfacing and acting on issues quickly.
- Automated patch management: The platform deploys patches across managed endpoints through policy-based patching. This helps keep client machines secure and reduce exposure to threats.
- Ransomware detection: Datto RMM includes built-in ransomware detection that monitors for and alerts on attacks at the endpoint level. This adds a layer of threat monitoring within the RMM.
- Remote control: A browser-based HTML5 Web Remote provides one-click remote access to online servers, laptops, and desktops, and lets technicians chat with end users. This enables remote troubleshooting without additional tools.
- Network topology maps: The platform creates visual maps of client networks to help technicians identify issues. This gives teams visibility into the networks they manage.
- Microsoft 365 and PSA integration: A native Microsoft 365 management module supports onboarding, offboarding, and quarantining users, and the platform integrates with Autotask PSA for ticketing and asset data. This consolidates user and endpoint management with service operations.
Limitations (as reported by users on G2):
- Remote access reliability: Establishing remote web console connections can sometimes take a minute or two, which slows support.
- Network discovery accuracy: Network discovery can be inconsistent in identifying and classifying devices and may require manual intervention.
- Interface and navigation: The interface can feel inconsistent or require many clicks, and device status or component-execution updates can occasionally lag.
- Configuration effort: Alert tuning and policy management can take time to configure properly in larger environments.
Learn more in our detailed guide to PRTG alternatives
Conclusion
While Paessler PRTG offers comprehensive monitoring capabilities, it also has several limitations that may prompt organizations to seek alternatives. Users have reported complexities in alarm management, which can make prioritizing and responding to alerts challenging.
The cost of deployment and maintenance can be high, especially for larger networks, and significant customization is often required to meet specific monitoring needs. These factors highlight the importance of evaluating alternative solutions that might offer more straightforward management, lower costs, or better customization options.
Learn more about Faddom for resource and cost optimization or start a free trial today!
See Additional Guides on Key Cybersecurity Topics
Together with our content partners, we have authored in-depth guides on several other topics that can also be useful as you explore the world of cybersecurity.
Solarwinds SAM
Authored by Faddom
- [Guide] SolarWinds SAM: Key Features,Pricing, Limitations, and Alternatives
- [Guide] PRTG Network Monitor vs. SolarWinds: 4 Key Differences and How to Choose
Device42
Authored by Faddom
- [Guide] Device42: 5 Key Features, Limitations, and Alternatives
- [Guide] Device42 Pricing: The 5 Pricing Tiers Explained – Faddom
- [Product] Faddom | Instant Application Dependency Mapping Tool
Application Security
Authored by Radware