
What Is WhatsUp Gold?
WhatsUp Gold is a network monitoring software developed by Progress. It provides monitoring solutions for IT infrastructure. This tool helps administrators manage networks, servers, and applications. Its interface offers real-time dashboards, providing insights into network performance. The software is suitable for enterprises of varying sizes.
WhatsUp Gold supports multiple platforms, offering flexibility for diverse IT environments. It provides configurable alerts and workflows, enabling quick response to network issues. The software integrates with third-party applications. Users benefit from its automated network discovery and mapping capabilities, which save time and resources in monitoring complex network systems.
Editor’s note: Updated information for WhatsUp Gold and competitors to reflect features, capabilities, and limitations in 2026, and added one new competitor.
This is part of an extensive series of guides about cybersecurity
Key Features of WhatsUp Gold Software
Unified Infrastructure Monitoring
WhatsUp Gold provides a centralized view of servers, network devices, applications, and cloud resources. This reduces the need to switch between multiple tools and simplifies monitoring across environments.
By consolidating data into a single dashboard, teams can quickly identify issues and understand their impact across the infrastructure. This improves response time and operational awareness.
Advanced Network Performance Analytics
The platform analyzes bandwidth usage, latency, and traffic patterns in real time. This helps identify congestion points and performance bottlenecks across the network.
These insights support capacity planning and ensure that networks can handle growth without degrading performance. It also helps maintain service levels by detecting issues early.
Interactive Network Mapping
WhatsUp Gold automatically generates Layer 2 and Layer 3 topology maps. These maps show how devices are connected and how data flows through the network.
This visualization makes it easier to understand dependencies and isolate faults. It reduces the time required to troubleshoot complex network issues.
Automated Network Discovery
The tool performs automatic discovery of network components, including devices, virtual machines, and applications. It continuously updates this information to reflect changes in the environment.
This reduces manual effort and ensures that monitoring coverage remains accurate. It is particularly useful in dynamic or hybrid environments.
Log Management and Compliance Support
WhatsUp Gold collects and analyzes logs from various sources, including Windows events and syslogs. It allows users to search, filter, and export log data as needed.
Logs can be stored for auditing and compliance purposes. They also play a key role in diagnosing issues and understanding system behavior over time.
Application Performance Monitoring
The platform monitors the performance of applications across different environments. This includes tracking response times and resource usage.
It helps identify application-level issues that may affect user experience. Monitoring both infrastructure and applications provides a more complete view of system health.
Threat Detection and Response
WhatsUp Gold includes capabilities for detecting unusual behavior and potential security threats. It uses analytics to identify anomalies and suspicious activity.
This allows teams to respond to threats earlier and reduce risk. It also helps correlate performance issues with possible security incidents.
Flow and Traffic Monitoring
The tool supports flow data formats such as NetFlow, IPFIX, and sFlow. This enables detailed analysis of network traffic and communication patterns.
By understanding traffic flows, teams can optimize network usage and detect abnormal behavior. It also helps with capacity planning and troubleshooting.
Capacity Planning and Forecasting
WhatsUp Gold provides insights into historical and current resource usage. These insights help predict future capacity needs.
This allows organizations to plan infrastructure upgrades proactively. It reduces the risk of outages caused by resource exhaustion.
Hybrid and Cloud Monitoring
The platform supports monitoring across on-premises, cloud, and hybrid environments. It integrates data from multiple sources into a unified view.
This ensures consistent visibility regardless of where workloads are hosted. It helps teams manage increasingly distributed IT environments without blind spots.
WhatsUp Gold Add-Ons
The following are optional add-ons available for WhatsUp Gold, some of them offered at an additional price.
Network Traffic Analysis
The network traffic analysis add-on gives administrators insights into how network bandwidth is being used by tracking user activity, applications, and protocols. It helps identify which parts of the network consume the most bandwidth and which applications may be causing congestion. Armed with this information, IT teams can enforce bandwidth utilization policies, ensuring that critical services like video conferencing or cloud applications receive the bandwidth they need.
Configuration Management
This add-on allows IT administrators to securely store an unlimited number of encrypted versions of network configuration files. It enables the comparison of configurations between different devices to ensure consistency, particularly between production and disaster recovery (DR) networks. The tool tracks every configuration change, providing alerts whenever changes occur.
Application Performance Monitoring
The APM add-on is for maintaining the performance of critical business applications. It continuously monitors applications such as Microsoft Exchange, SQL Server, Oracle, and other key services like IIS and Linux-based applications. By using predefined templates, administrators can easily monitor performance without extensive setup. APM provides insights into application health, detecting issues like slow response times or performance bottlenecks.
Virtualization Monitoring
The virtualization monitoring add-on offers visibility into both physical and virtual infrastructures, including VMware and Hyper-V environments. It automatically detects virtual servers and creates a detailed map that shows how virtual machines (VMs) relate to their physical hosts. Administrators can track VM migrations, resource usage, and overall performance to ensure that virtual workloads are distributed efficiently.
VoIP Monitoring
WhatsUp Gold’s VoIP monitoring add-on ensures the quality of voice communications in IP-based telephony systems. It continuously monitors key performance metrics for Cisco IP SLA-enabled devices, such as jitter, latency, and packet loss, which directly affect call quality. In addition, it provides industry-standard metrics like Mean Opinion Score (MOS) and Capacity Planning Impairment Factor (CPIF) to help organizations assess and improve their VoIP service.
Log Management
The log management add-on simplifies the collection, monitoring, and analysis of log data from devices across the network. It centralizes log data from Windows and syslog devices, making it easy for administrators to monitor, filter, and search through logs from a single interface. Log management also provides the ability to set custom alerts based on log events.
Scalability Pollers
Scalability pollers expand WhatsUp Gold’s capacity to monitor large and complex networks. The platform can handle up to 20,000 devices by allowing administrators to deploy additional pollers as needed. These pollers help distribute the monitoring load across the network, ensuring performance even in large-scale environments. Scalability pollers also provide redundancy, ensuring that the network remains monitored even if some pollers fail.
Related content: Read our guide to application migration
WhatsUp Gold Licensing and Pricing
WhatsUp Gold uses a flexible licensing model that includes both subscription and perpetual options. The subscription model provides ongoing updates, security patches, and support, while the perpetual license is a one-time purchase that includes one year of updates and maintenance.
Pricing is primarily based on the number of devices being monitored, allowing organizations to scale the solution as their infrastructure grows. The platform supports large environments, with each instance capable of monitoring up to 25,000 devices, and additional scalability available through distributed deployments:
- The Business tier is designed for small to mid-sized environments and includes a single installation with email-based support. Pricing starts at approximately $1,229 per year for 50 devices, making it suitable for organizations with limited monitoring needs.
- The Enterprise tier adds more advanced monitoring and reporting capabilities, along with expanded support options. It supports up to two installations and includes 24/5 phone and email support, with pricing starting at around $2,049 per year for 50 devices.
- The Enterprise Plus tier is intended for larger organizations that require broader deployment and scalability. It allows up to four installations and includes the same advanced monitoring and support features, with pricing starting at approximately $3,469 per year for 50 devices.
- The Enterprise Scale option provides customizable deployments and additional scalability for organizations with more complex requirements. This tier is designed for large environments that need flexible installation options, automation, and comprehensive monitoring capabilities.
Additional add-ons are available to extend functionality, including features such as network traffic analysis, configuration management, and scalability pollers. These allow organizations to tailor the platform to specific operational and monitoring requirements.
Learn more in our detailed guide to WhatsUp gold pricing
WhatsUp Gold Limitations
While WhatsUp Gold offers a range of network monitoring tools and add-ons, there are several limitations that users have noted on the G2 platform:
- Complex initial setup: Users report that the initial configuration can be time-consuming and difficult, especially in larger or more complex environments.
- Outdated and inconsistent interface: Some users note that parts of the interface feel outdated or unintuitive, which can affect usability.
- Limited API functionality: The API does not support many actions available in the UI, making automation and integrations more difficult.
- Performance issues with dashboards and graphs: Rendering dashboards and generating graphs can be slow, particularly in environments with large data volumes.
- High cost for support and updates: While perpetual licenses are available, ongoing support and updates often require additional paid contracts.
- Limited flow analysis depth: Network traffic analysis features provide only high-level insights, lacking deeper visibility compared to specialized tools.
- Inefficient device management: Adding or modifying devices can require full rescans, which is time-consuming and may reset configurations.
- Scanning limitations in large networks: Users report challenges scanning multiple subnets efficiently, especially when scans cannot run concurrently.
- False alerts and monitoring inaccuracies: Some users experience incorrect status readings, which can reduce trust in alerts.
- Limited user and dashboard control: Managing user permissions and shared dashboard views can be cumbersome and lacks flexibility.
- Integration gaps: Expanding integrations with third-party tools is sometimes limited, impacting workflow automation.
Notable WhatsUp Gold Alternatives and Competitors
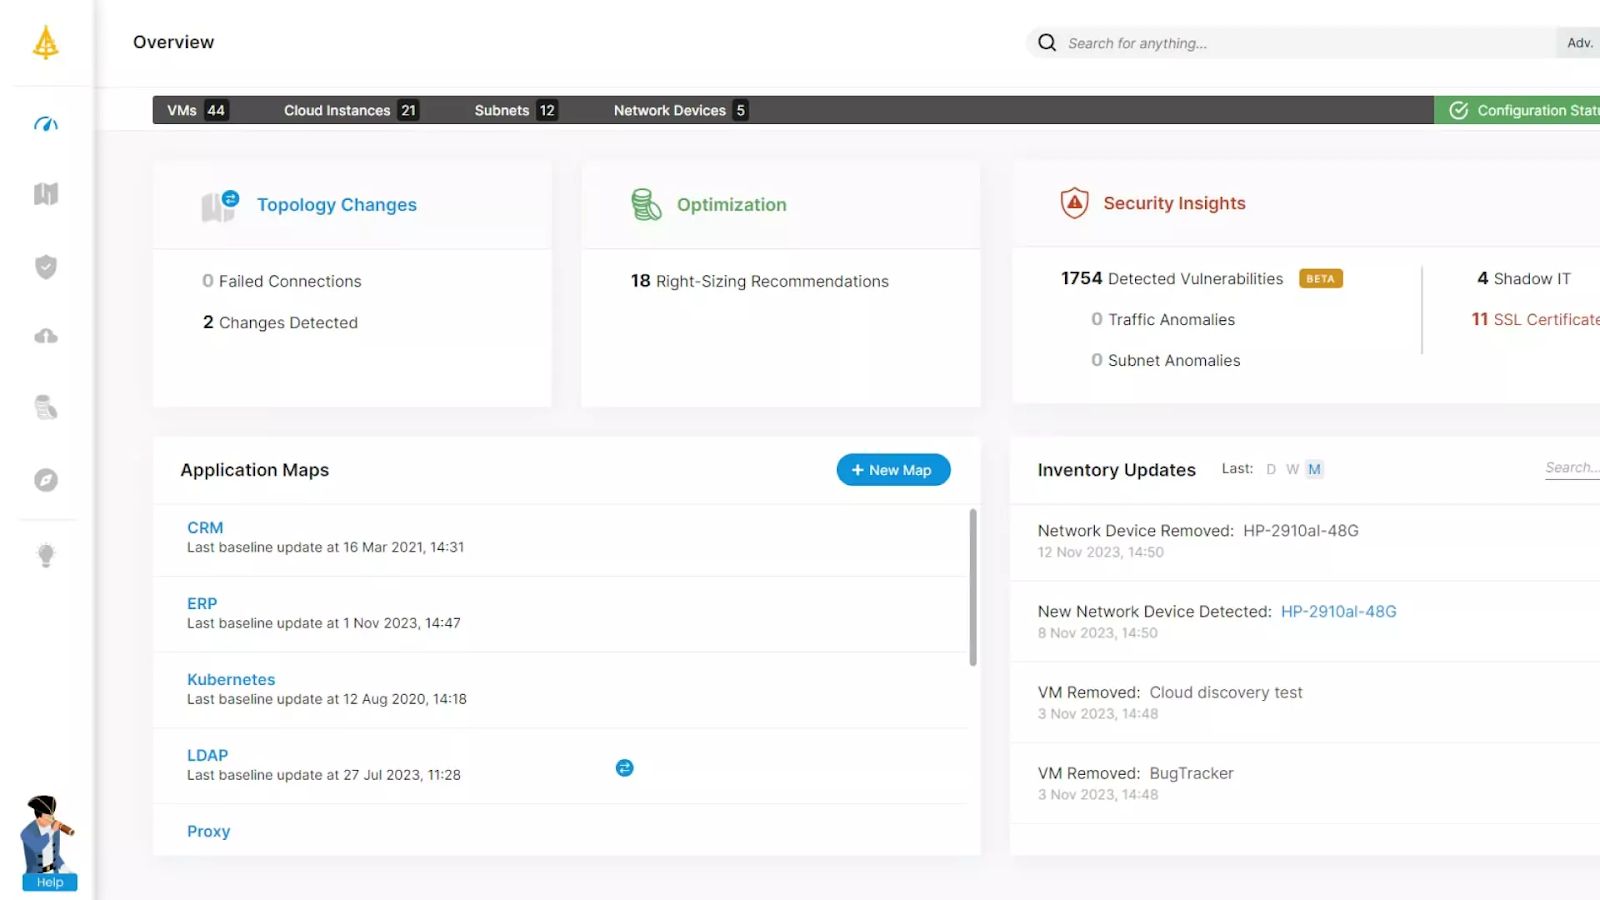
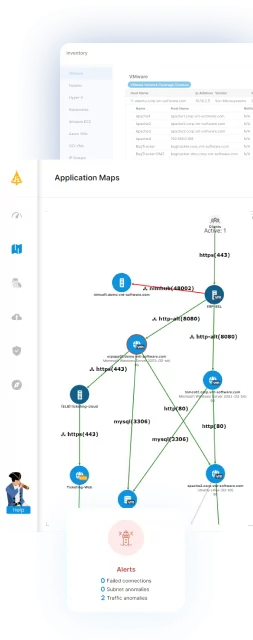
1. Faddom

Faddom is an agentless, real-time application dependency mapping tool that offers fast deployment (under 60 minutes) and scalability for both on-premise and cloud environments. Its passive approach minimizes network load, making it ideal for complex infrastructures, while helping IT teams optimize resources, enhance security, and support IT governance.
Key features of Faddom:
- Agentless mapping: Provides detailed insights into infrastructure and application dependencies without the need for agents.
- Scalability: Supports both small businesses and large enterprises by scaling its mapping capabilities as needed.
- Security: Ensures a secure deployment with minimal exposure to vulnerabilities, as it does not rely on agents or active network scanning.
- Hybrid environment support: Maps dependencies across on-premise, hybrid, and cloud infrastructures.
Learn more about Faddom for application mapping or start a free trial to the right!
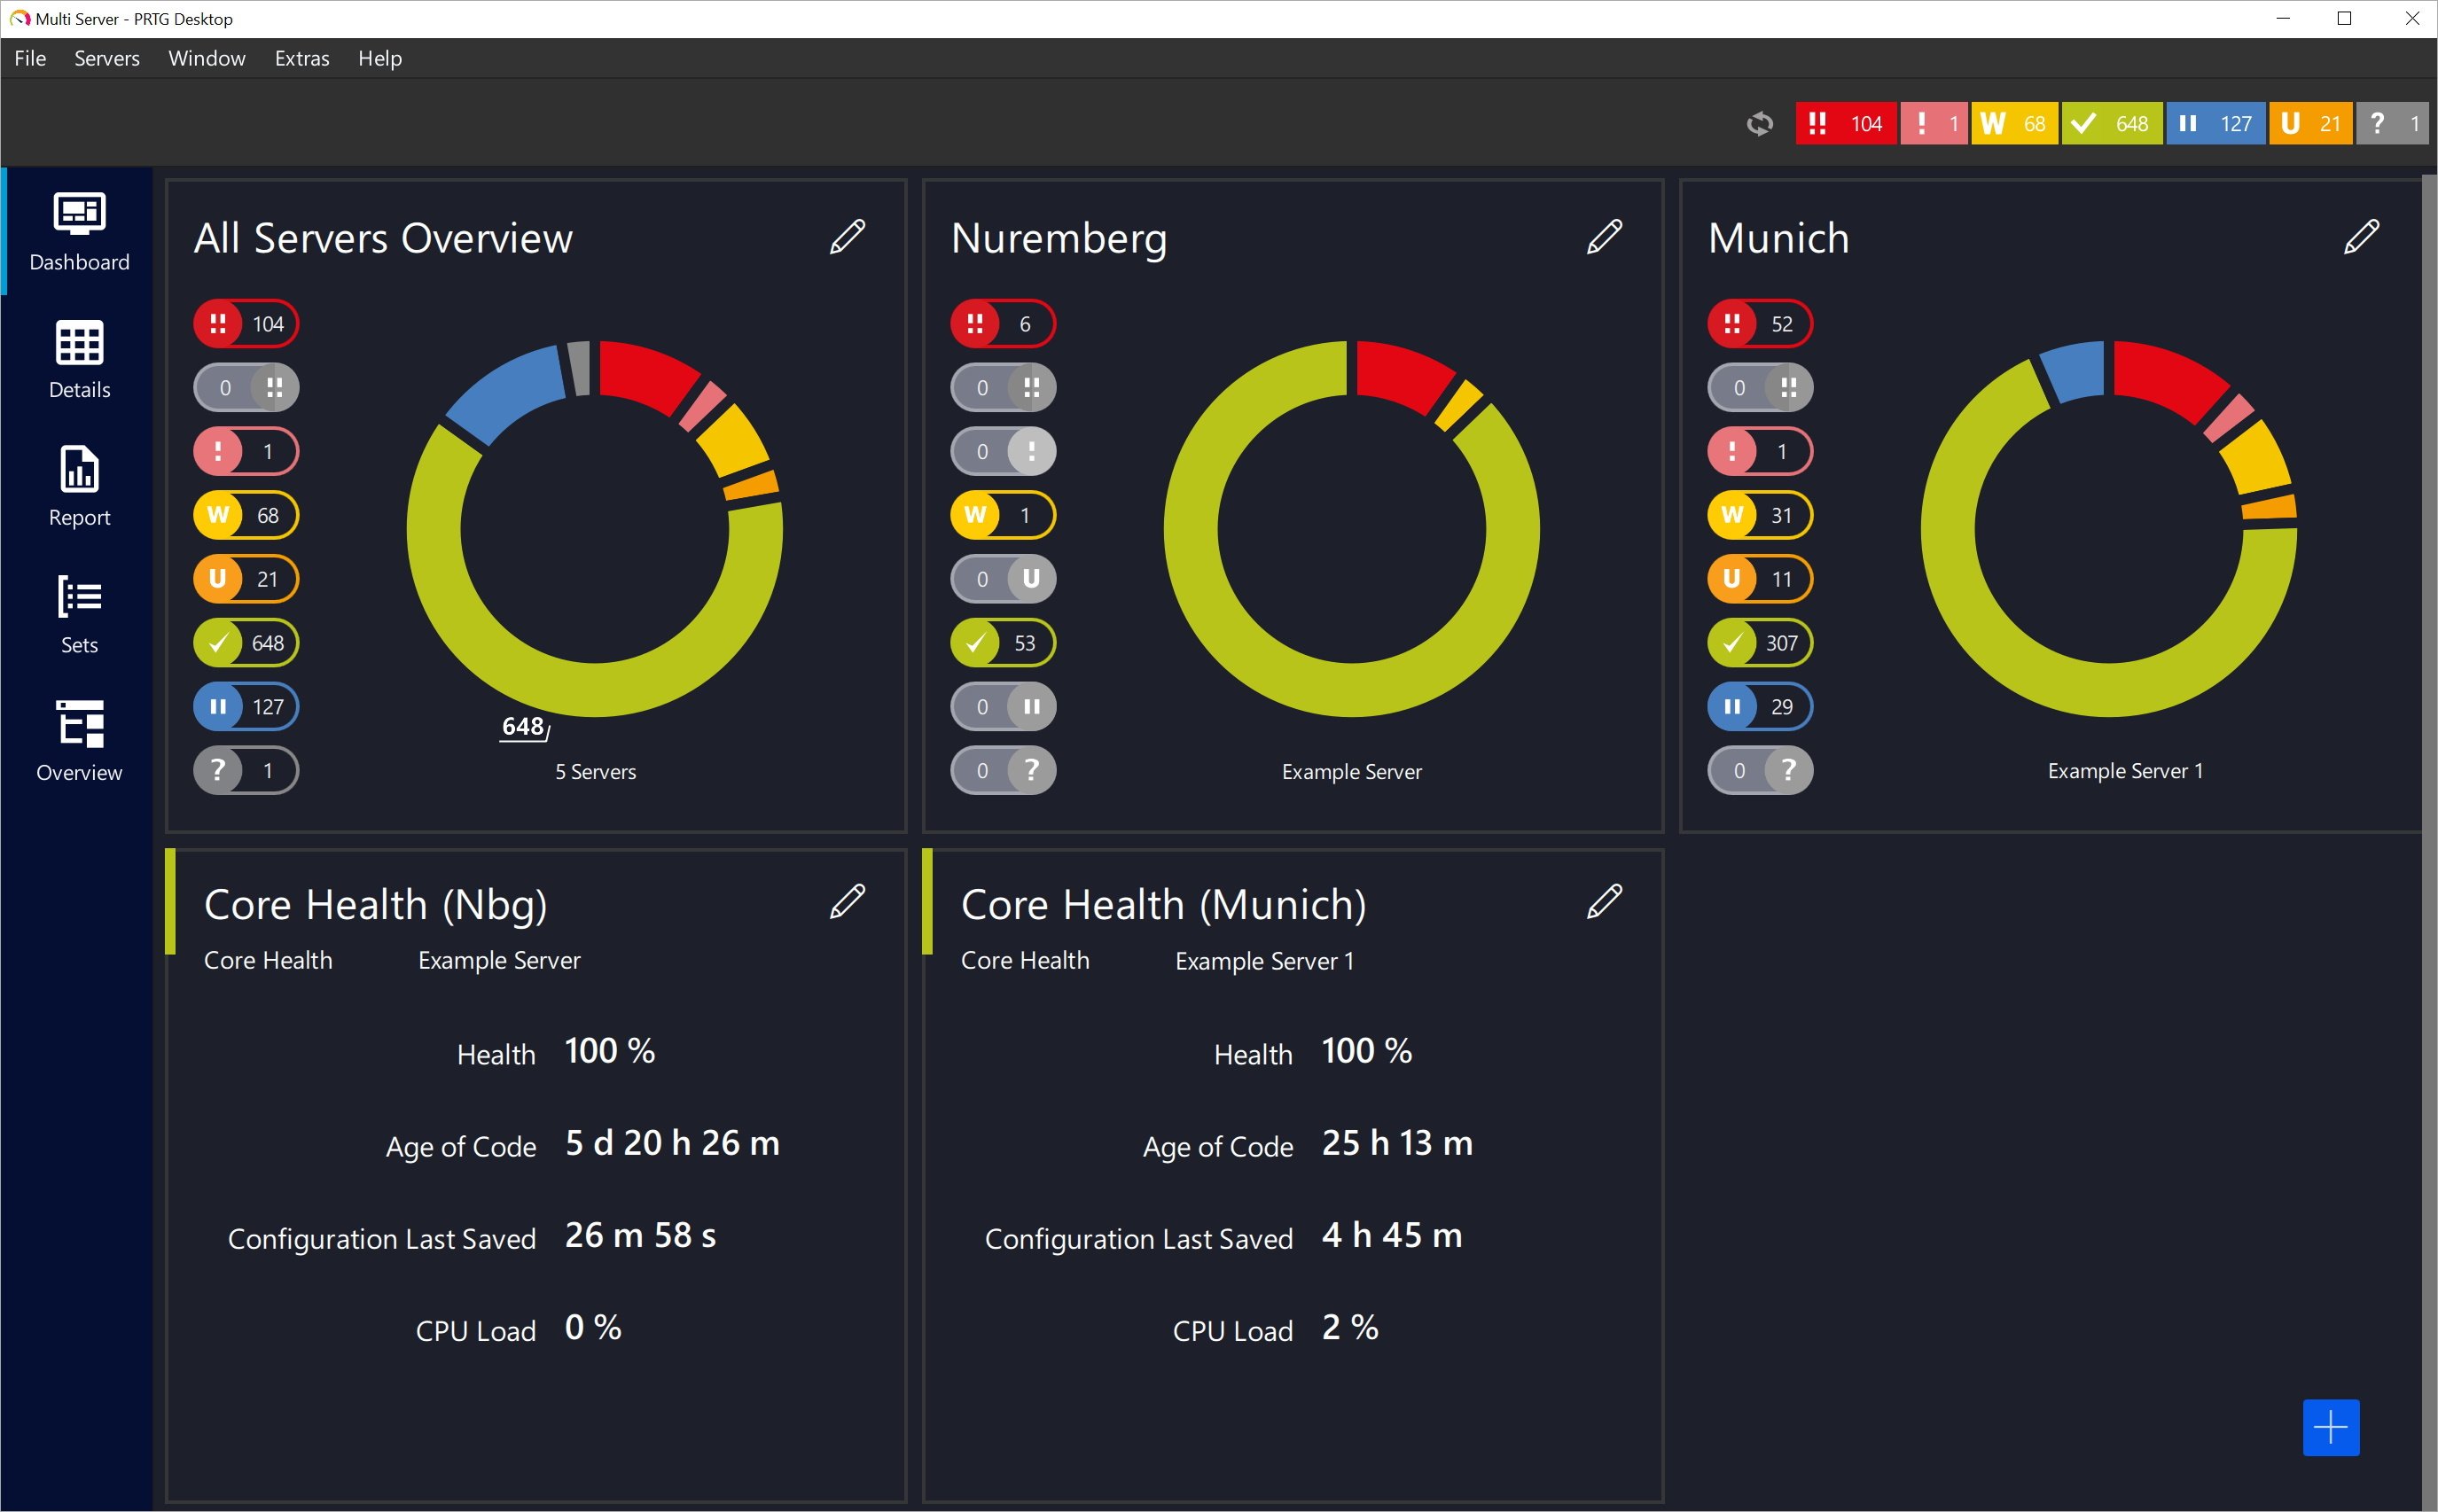
2. PRTG
Key features of PRTG:
- Unified infrastructure monitoring: Monitors networks, servers, applications, virtual environments, and IoT systems from a single platform.
- Automatic network discovery: Detects devices and applies preconfigured monitoring templates to simplify setup.
- Sensor-based monitoring model: Uses configurable sensors to track specific metrics such as bandwidth, CPU usage, and availability.
- Real-time alerts and notifications: Sends alerts via multiple channels when performance thresholds or failures occur.
- Distributed monitoring: Supports monitoring across remote sites and distributed environments.
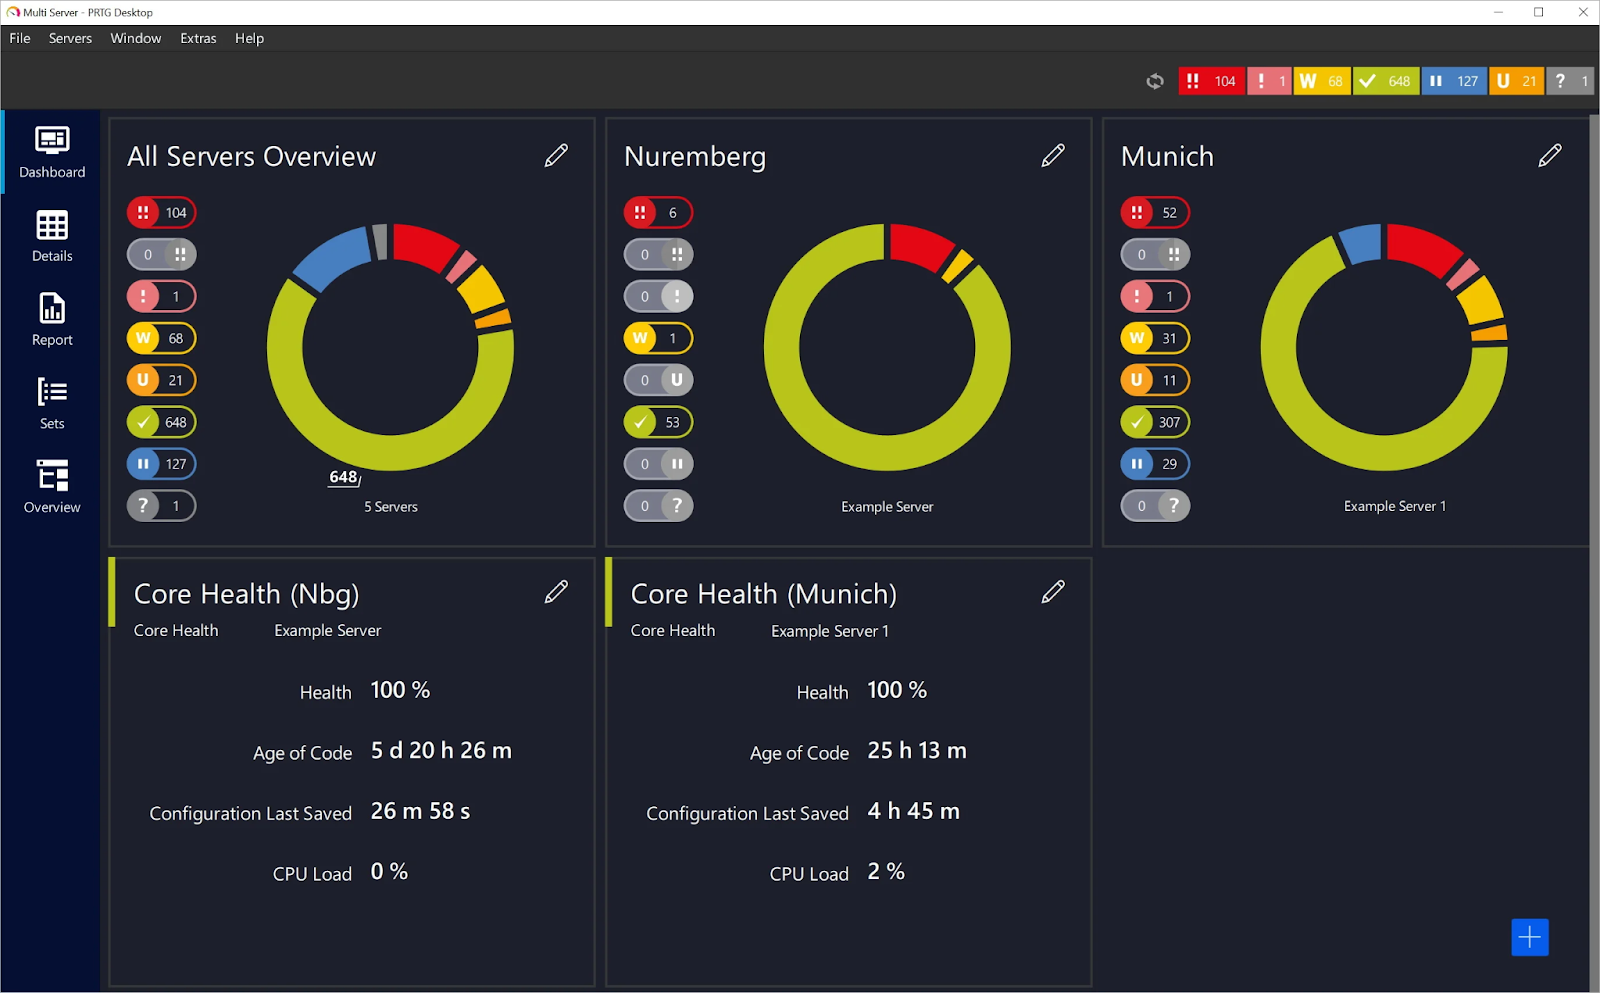
Source: Paessler
3. Site24x7
Site24x7 is a cloud-based monitoring platform that provides visibility across applications, infrastructure, and user experience. It combines infrastructure monitoring with observability capabilities, allowing teams to track performance across cloud, on-premises, and hybrid systems. The platform also incorporates AI-driven analytics to detect anomalies and support automated responses.
Key features of Site24x7:
- Full-stack monitoring: Covers websites, servers, applications, networks, and cloud environments in a single platform.
- Application performance monitoring: Tracks performance across multiple programming environments and application components.
- Cloud and virtualization monitoring: Provides visibility into platforms such as AWS, Azure, GCP, and VMware.
- Real user and synthetic monitoring: Measures actual user experience and simulates transactions to detect issues proactively.
- AIOps and anomaly detection: Uses machine learning to identify anomalies and automate incident response.
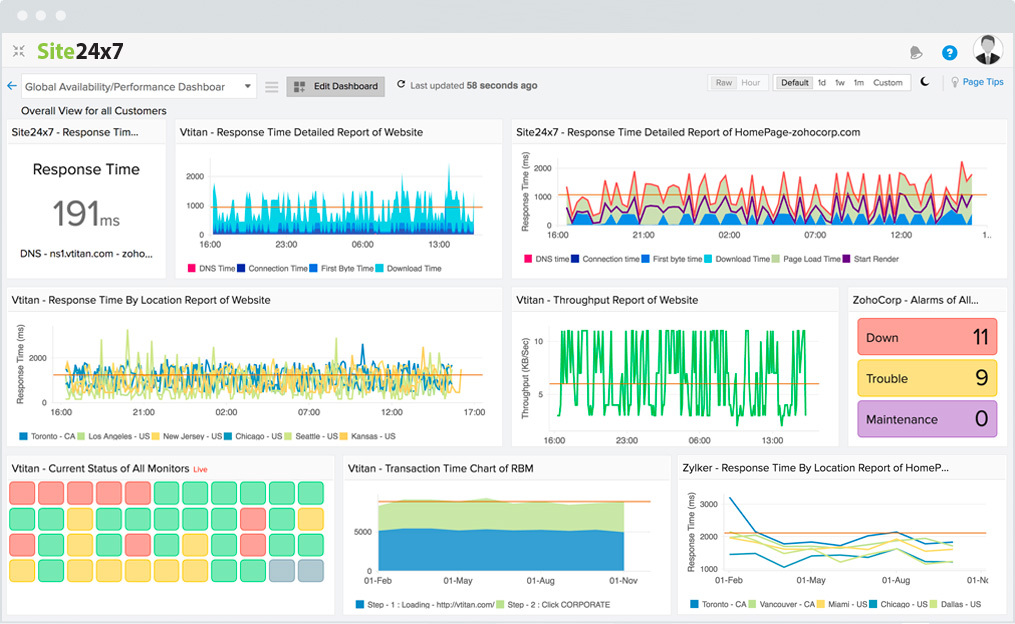
Source: Site24x7
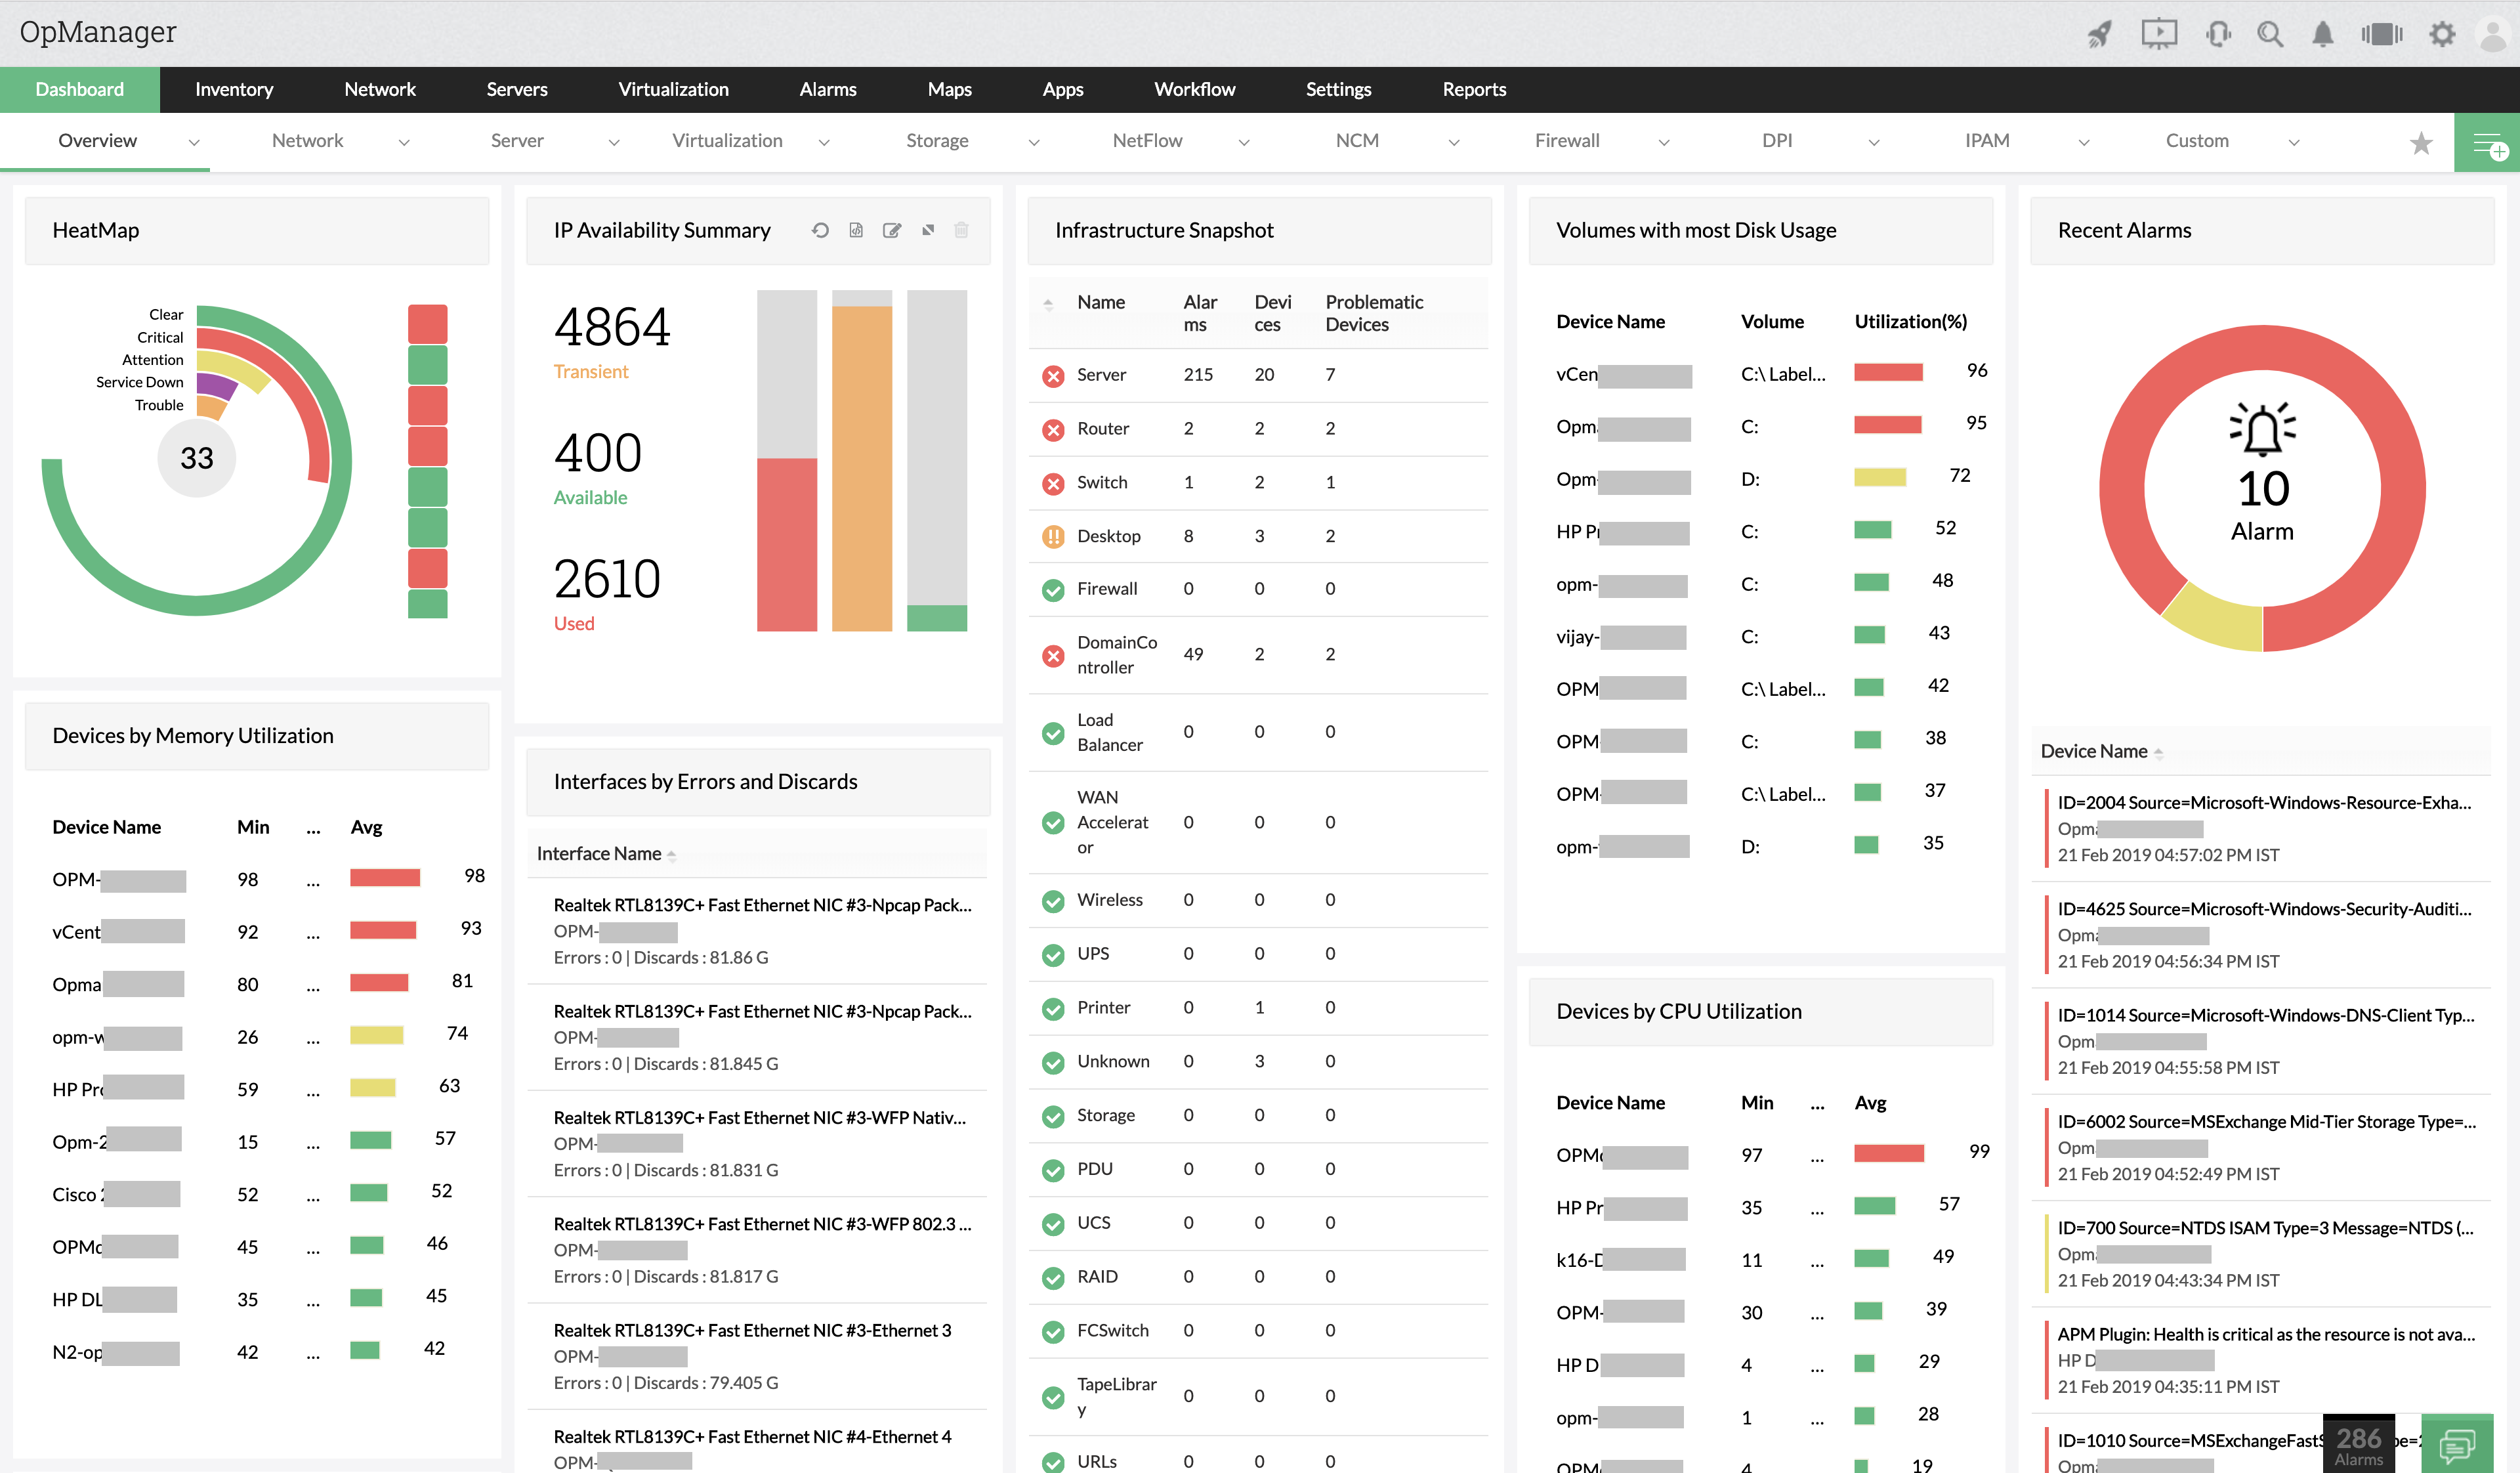
4. ManageEngine OpManager

ManageEngine OpManager is a network monitoring solution that provides visibility into network devices, servers, and applications across distributed environments. It supports real-time monitoring and troubleshooting, allowing administrators to identify root causes of issues and maintain network performance. The platform includes visualization tools and supports physical and virtual infrastructure monitoring.
Key features of ManageEngine OpManager:
- Real-time network monitoring: Tracks performance, availability, and health of IP-based devices continuously.
- Physical and virtual server monitoring: Supports monitoring across environments including VMware, Hyper-V, and other platforms.
- Advanced network visualization: Provides Layer 2 maps, topology views, and data center layouts for better visibility.
- Fault management and alerting: Correlates events and generates alerts with severity-based classification.
- Distributed monitoring architecture: Uses probe-based architecture to monitor networks across multiple locations.
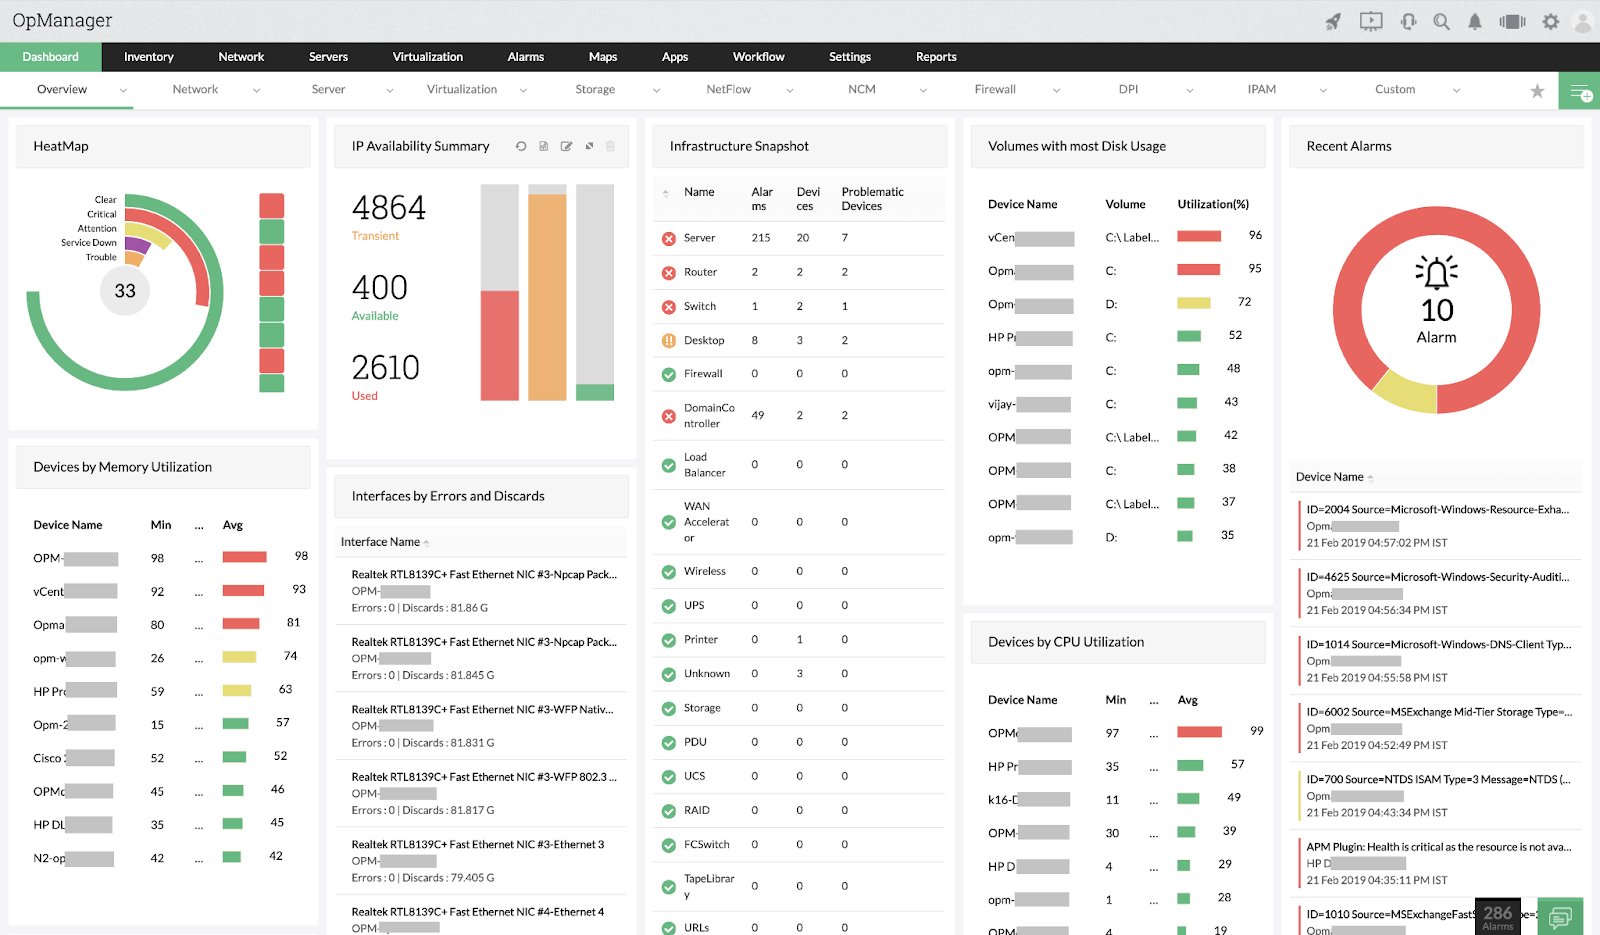
Source: ManageEngine
5. Atera

Atera is an IT management platform that combines remote monitoring, automation, and support tools in a single interface. It is intended to manage distributed IT environments and provides centralized control over devices, users, and support workflows. The platform also integrates AI capabilities to assist with IT operations and improve efficiency.
Key features of Atera:
- Remote monitoring and management: Monitors and manages unlimited devices from a centralized dashboard.
- Integrated helpdesk and ticketing: Provides tools for handling support requests and tracking issue resolution.
- Remote access tools: Enables remote connections using integrations with tools like TeamViewer and AnyDesk.
- Network discovery: Detects and onboards devices using automated scanning.
- Patch management: Automates updates for Windows, macOS, and Linux systems.
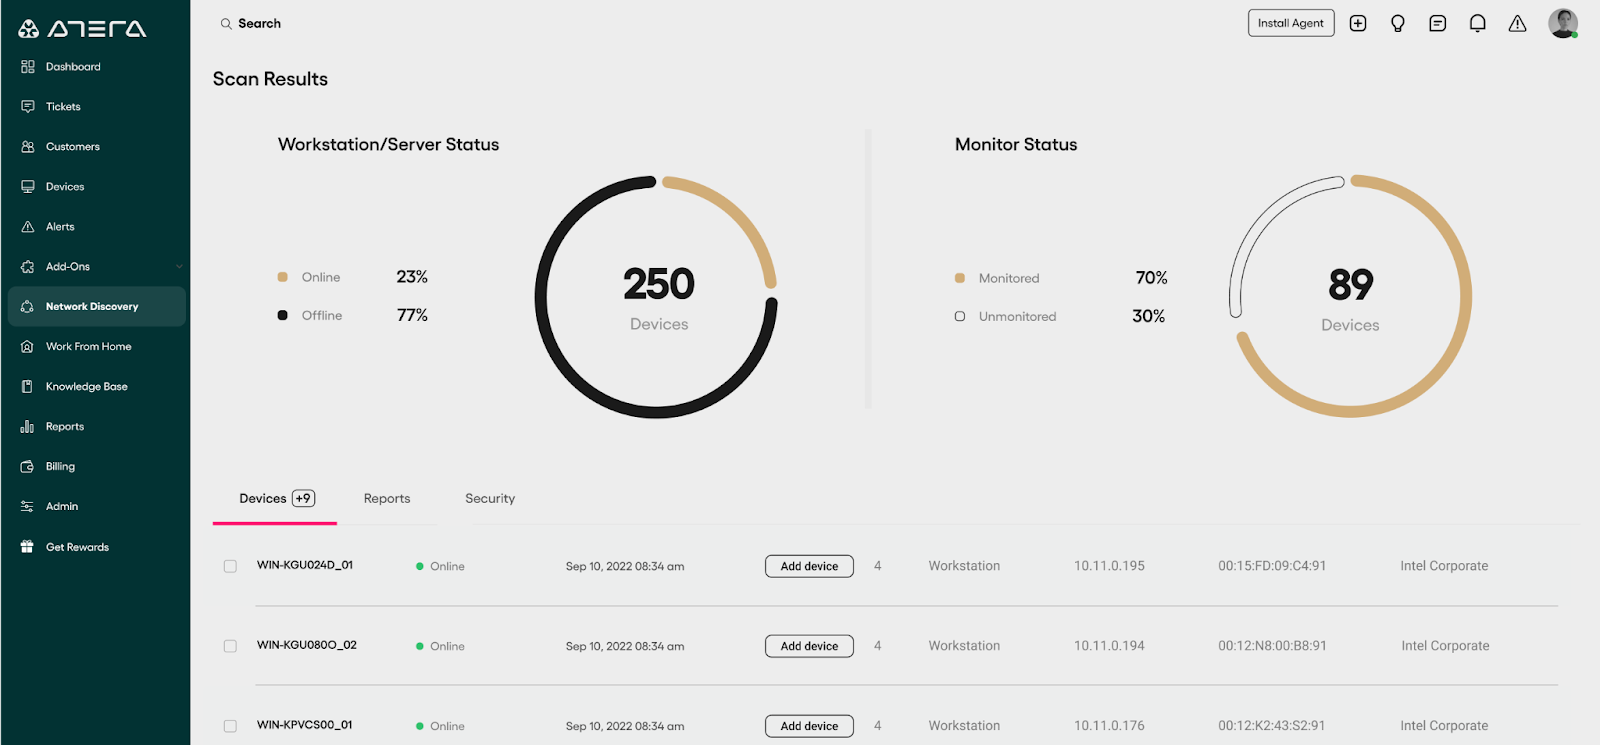
Source: Atera
6. SolarWinds Network Performance Monitor (NPM)
![]()
SolarWinds Network Performance Monitor is a network monitoring tool that provides visibility into network performance across on-premises and hybrid environments. It focuses on proactive monitoring, helping teams detect and resolve issues before they affect operations. The platform includes mapping, analytics, and alerting capabilities to support performance optimization and troubleshooting.
Key features of SolarWinds Network Performance Monitor (NPM):
- Network performance monitoring: Continuously tracks network health and availability to ensure uptime.
- Intelligent network mapping: Automatically maps hybrid network environments to visualize topology and dependencies.
- Path analysis with NetPath: Visualizes critical network paths end-to-end for root cause analysis.
- Advanced alerting: Supports threshold-based and anomaly-based alerts for faster issue detection.
- Custom dashboards and performance analysis: Uses tools like PerfStack to analyze metrics and build customizable monitoring views.
Learn more in our detailed guide to WhatsUp gold alternatives
Conclusion
WhatsUp Gold offers a comprehensive suite of tools for network monitoring and management, making it a strong solution for businesses of all sizes. Its ability to automatically discover devices, map network topologies, and provide real-time alerts enhances efficiency and visibility in IT environments. However, limitations such as its user interface and performance in graph generation should be considered when evaluating the platform.
For organizations seeking deeper visibility into both infrastructure and business applications, Faddom offers a valuable alternative. While WhatsUp Gold focuses on network-level monitoring, Faddom extends visibility by mapping entire IT ecosystems into business applications. This approach helps IT teams understand dependencies, optimize resources, and proactively manage risks across hybrid environments. With agentless deployment completed in under 60 minutes, Faddom provides fast results and minimal disruption, making it an ideal choice for businesses seeking to enhance their IT management strategy.
Learn more about Faddom for IT environment mapping.
See Additional Guides on Key Cybersecurity Topics
Together with our content partners, we have authored in-depth guides on several other topics that can also be useful as you explore the world of cybersecurity.
Device42
Authored by Faddom
- [Guide] Device42: 5 Key Features, Limitations, and Alternatives
- [Guide] Device42 Pricing: The 5 Pricing Tiers Explained – Faddom
- [Product] Faddom | Instant Application Dependency Mapping Tool
Solarwinds SAM
Authored by Faddom
- [Guide] SolarWinds SAM: Key Features,Pricing, Limitations, and Alternatives
- [Guide] PRTG Network Monitor vs. SolarWinds: 4 Key Differences and How to Choose
Application Security
Authored by Radware
