What Is WhatsUp Gold?
WhatsUp Gold is network monitoring software developed by Progress. It provides real-time visibility into the status and performance of various network devices and applications. This enables IT professionals to monitor, identify, and troubleshoot network issues.
Its functionalities include alerting, mapping, and reporting, which are crucial for maintaining network health. Users can customize dashboards to display the most relevant data. The software supports device discovery using network layers 2 and 3, allowing users to map out their network infrastructure automatically.
With its user interface, WhatsUp Gold simplifies network management tasks. The software includes an array of plugins to extend its functionality, catering to diverse monitoring needs. Integration capabilities with third-party tools further enhance its utility in business environments requiring network transparency and efficiency.
Understanding How WhatsUp Gold Works
WhatsUp Gold operates as a centralized network monitoring system that provides visibility into infrastructure, performance, and traffic across on-premises, cloud, and hybrid environments. It monitors servers, devices, applications, and network traffic to ensure availability and performance.
Here’s an overview of the process:
- Discovering and mapping devices across the network: The system can identify virtually any IP-based device and build dynamic maps that show interconnections and dependencies. These maps help teams understand how systems relate to each other, which speeds up troubleshooting.
- Monitoring with different types of checks: Active monitors poll devices to confirm availability and status. Performance monitors track real-time metrics such as CPU load, memory usage, and bandwidth consumption, triggering alerts when thresholds are exceeded. Passive monitors collect event-driven data like SNMP traps, Syslog messages, and Windows Events.
- Protocol support: WhatsUp Gold also supports standard protocols such as Ping, SNMP, WMI for Windows, and SSH for Unix/Linux systems. Built-in support for PowerShell and SQL queries allows teams to extend monitoring for custom environments.
- Visualization: Dashboards provide real-time visibility into network health. Preconfigured and customizable views display key metrics and SLA-related data in one place. A configurable NOC viewer can rotate through multiple screens for end-to-end monitoring.
- Deeper analysis: The platform includes flow-based monitoring using formats such as NetFlow and IPFIX. This enables detailed insight into bandwidth usage, latency, and application performance. Historical trend analysis supports capacity planning, helping teams forecast future resource needs.
- Alerts: The system also includes proactive alerting and automated detection to identify issues before users are affected. By combining real-time monitoring, historical analysis, and root cause detection, WhatsUp Gold shifts network management from reactive troubleshooting to predictive operations.
WhatsUp Gold Limitations
While WhatsUp Gold offers extensive network monitoring features, there are several limitations that can impact its usability and performance, as reported by users on the G2 platform:
- Performance degradation in large environments: Monitoring thousands of devices or using intensive polling can slow the system. Some organizations deploy multiple instances to distribute load, which increases operational complexity.
- Complex initial configuration: Setup and fine-tuning can be time-consuming, especially for advanced features. Teams without deep network expertise may require additional effort during implementation.
- Steep learning curve for advanced features: Custom reporting, alert tuning, and deeper configuration options can be difficult to master. This may delay full adoption of the platform’s capabilities.
- Dated or less intuitive interface: While functional, some users report that the interface feels outdated. Navigation can become cumbersome in large or complex deployments.
- Reporting limitations: Built-in reports are useful but can lack flexibility. Creating highly customized reports may require extra configuration and may not match the depth of dedicated analytics tools.
- Alert noise and false positives: Without careful threshold configuration, the system can generate excessive or unnecessary alerts. This can lead to alert fatigue in larger networks.
- Windows-only server requirement: The WhatsUp Gold server must run on Windows. Organizations that prefer Linux-based infrastructure may see this as a limitation.
- Cost of add-ons and licensing: Advanced features often require additional modules. For smaller organizations, licensing and add-ons can increase total cost of ownership.
- Inconsistent support experiences: Some users report that customer support quality varies depending on issue complexity.
Notable WhatsUp Gold Alternatives
Network and Infrastructure Monitoring Tools
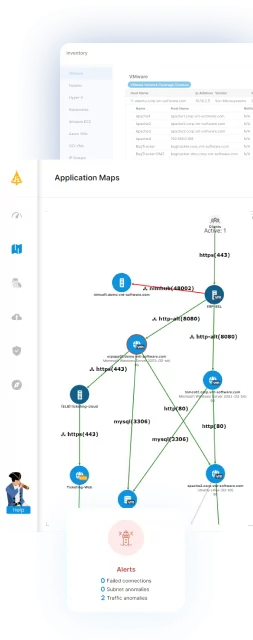
1. Faddom

Faddom is an agentless, real-time application dependency mapping tool that offers fast deployment (under 60 minutes) and scalability for both on-premise and cloud environments. Its passive approach minimizes network load, making it ideal for complex infrastructures, while helping IT teams optimize resources, enhance security, and support IT governance.
Key features of Faddom:
- Agentless mapping: Provides detailed insights into infrastructure and application dependencies without the need for agents.
- Scalability: Supports both small businesses and large enterprises by scaling its mapping capabilities as needed.
- Security: Ensures a secure deployment with minimal exposure to vulnerabilities, as it does not rely on agents or active network scanning.
- Hybrid environment support: Maps dependencies across on-premise, hybrid, and cloud infrastructures.
Learn more about Faddom for application mapping or start a free trial to the right

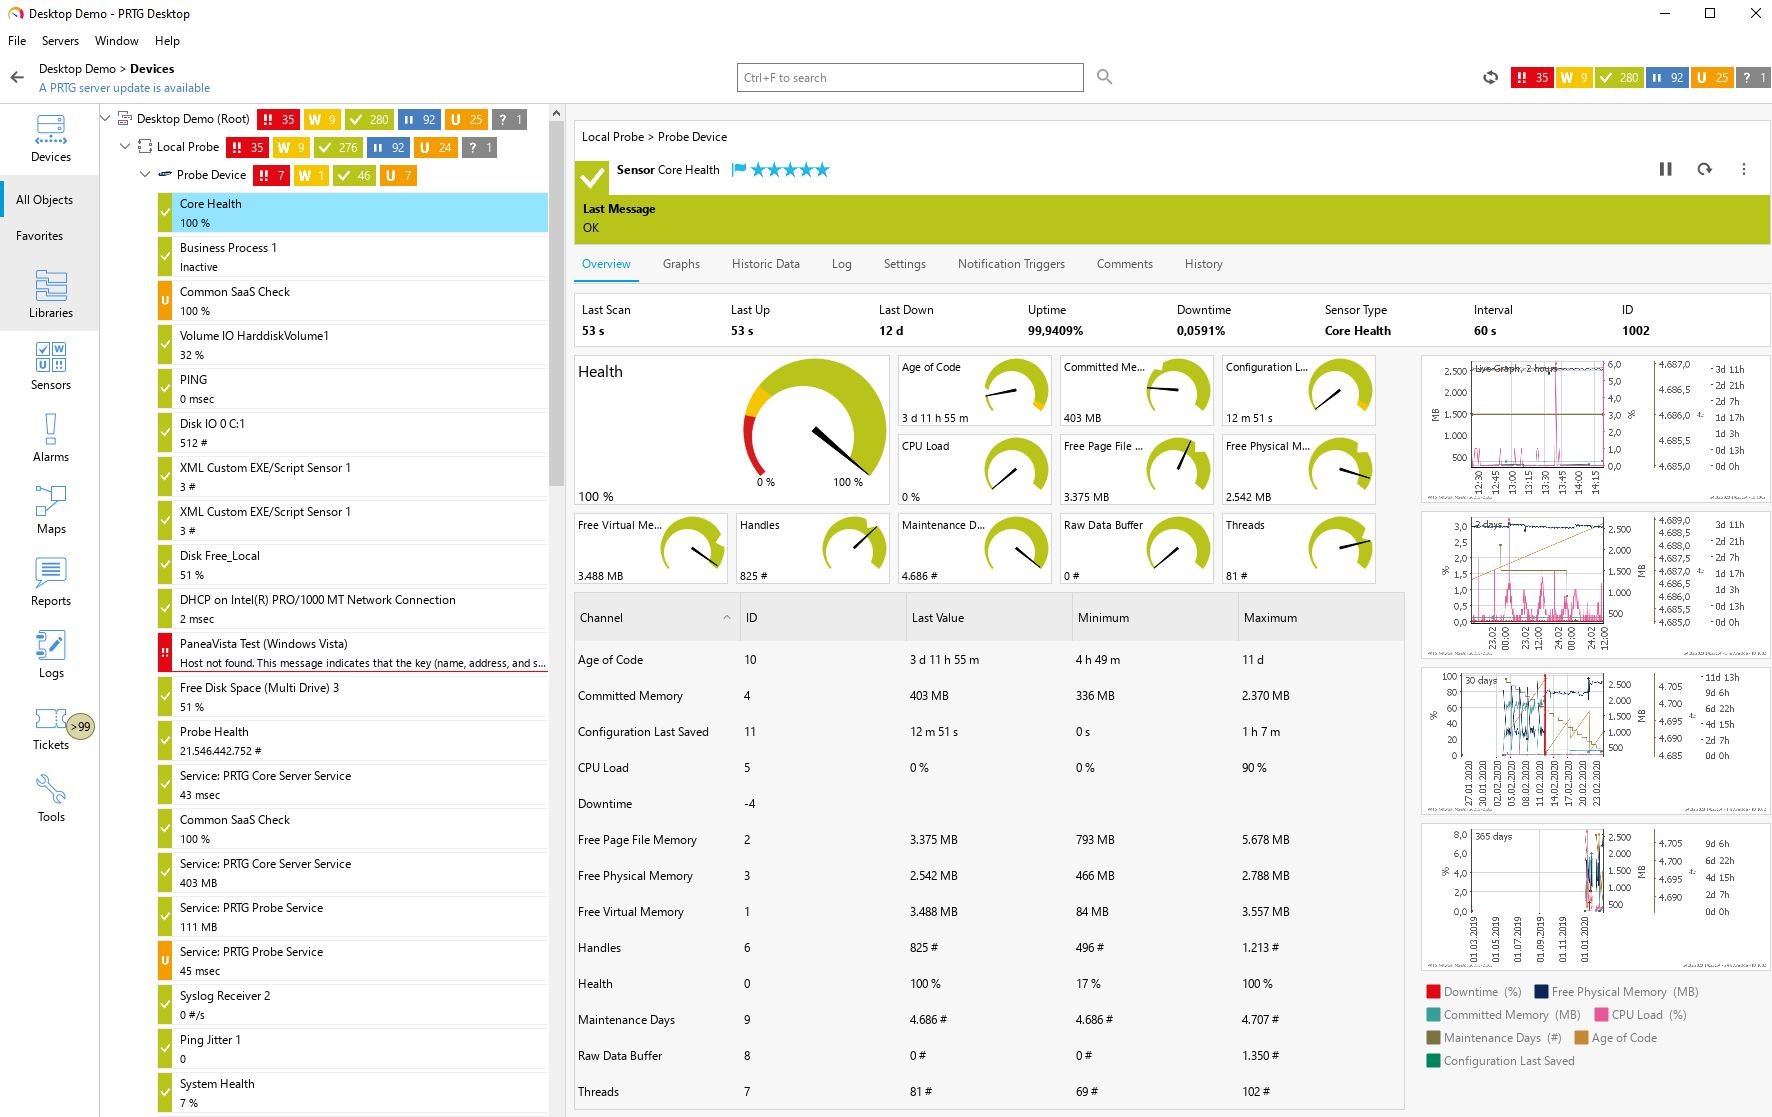
2. PRTG
PRTG Network Monitor, developed by Paessler, is an IT infrastructure monitoring solution to provide centralized visibility into networks, servers, applications, and devices. It supports on-premises or cloud-based deployment and uses automatic discovery and preconfigured sensors to simplify setup and monitoring across environments of various sizes.
Key features of PRTG Network Monitor:
- Automatic network discovery: Automatically detects devices and applies preconfigured monitoring templates to speed up deployment.
- Unified infrastructure monitoring: Monitors network devices, bandwidth, servers, applications, virtual environments, IoT devices, and more from a single console.
- Preconfigured sensors: Includes built-in sensors for popular vendors and supports SNMP, packet sniffing, and flow technologies.
- Real-time alerts and notifications: Sends alerts via email, SMS, and push notifications to notify teams of performance issues or outages.
- Distributed monitoring: Supports monitoring across remote sites and branch offices with centralized management.
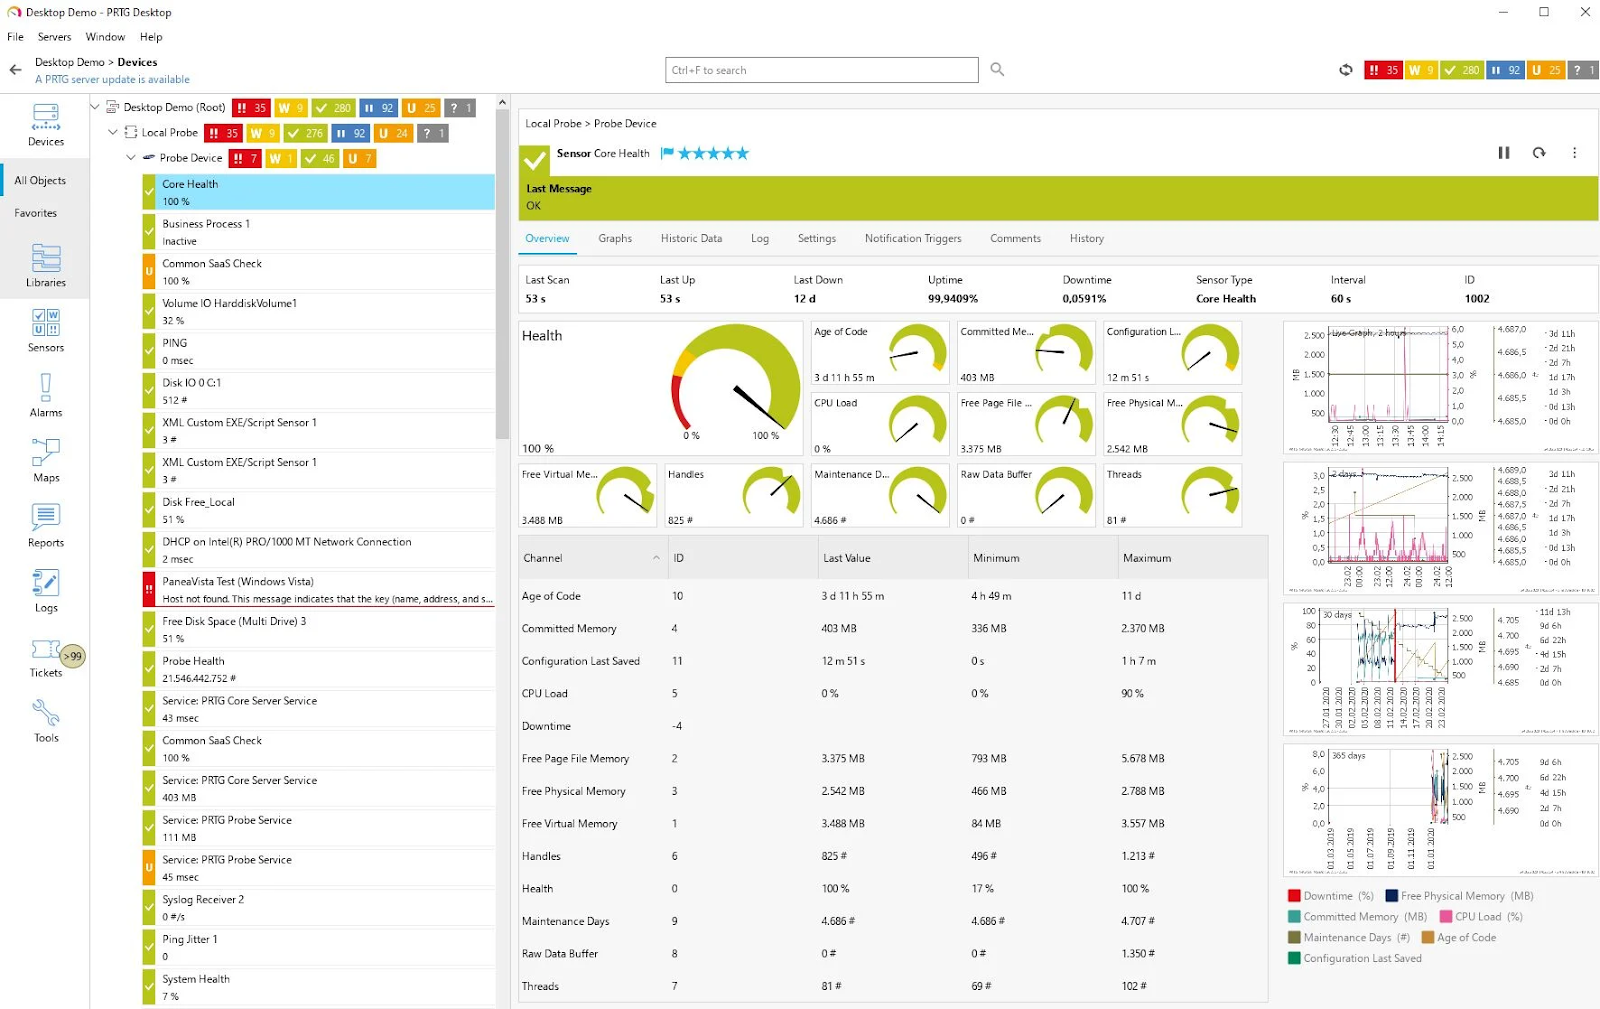
Source: Paessler
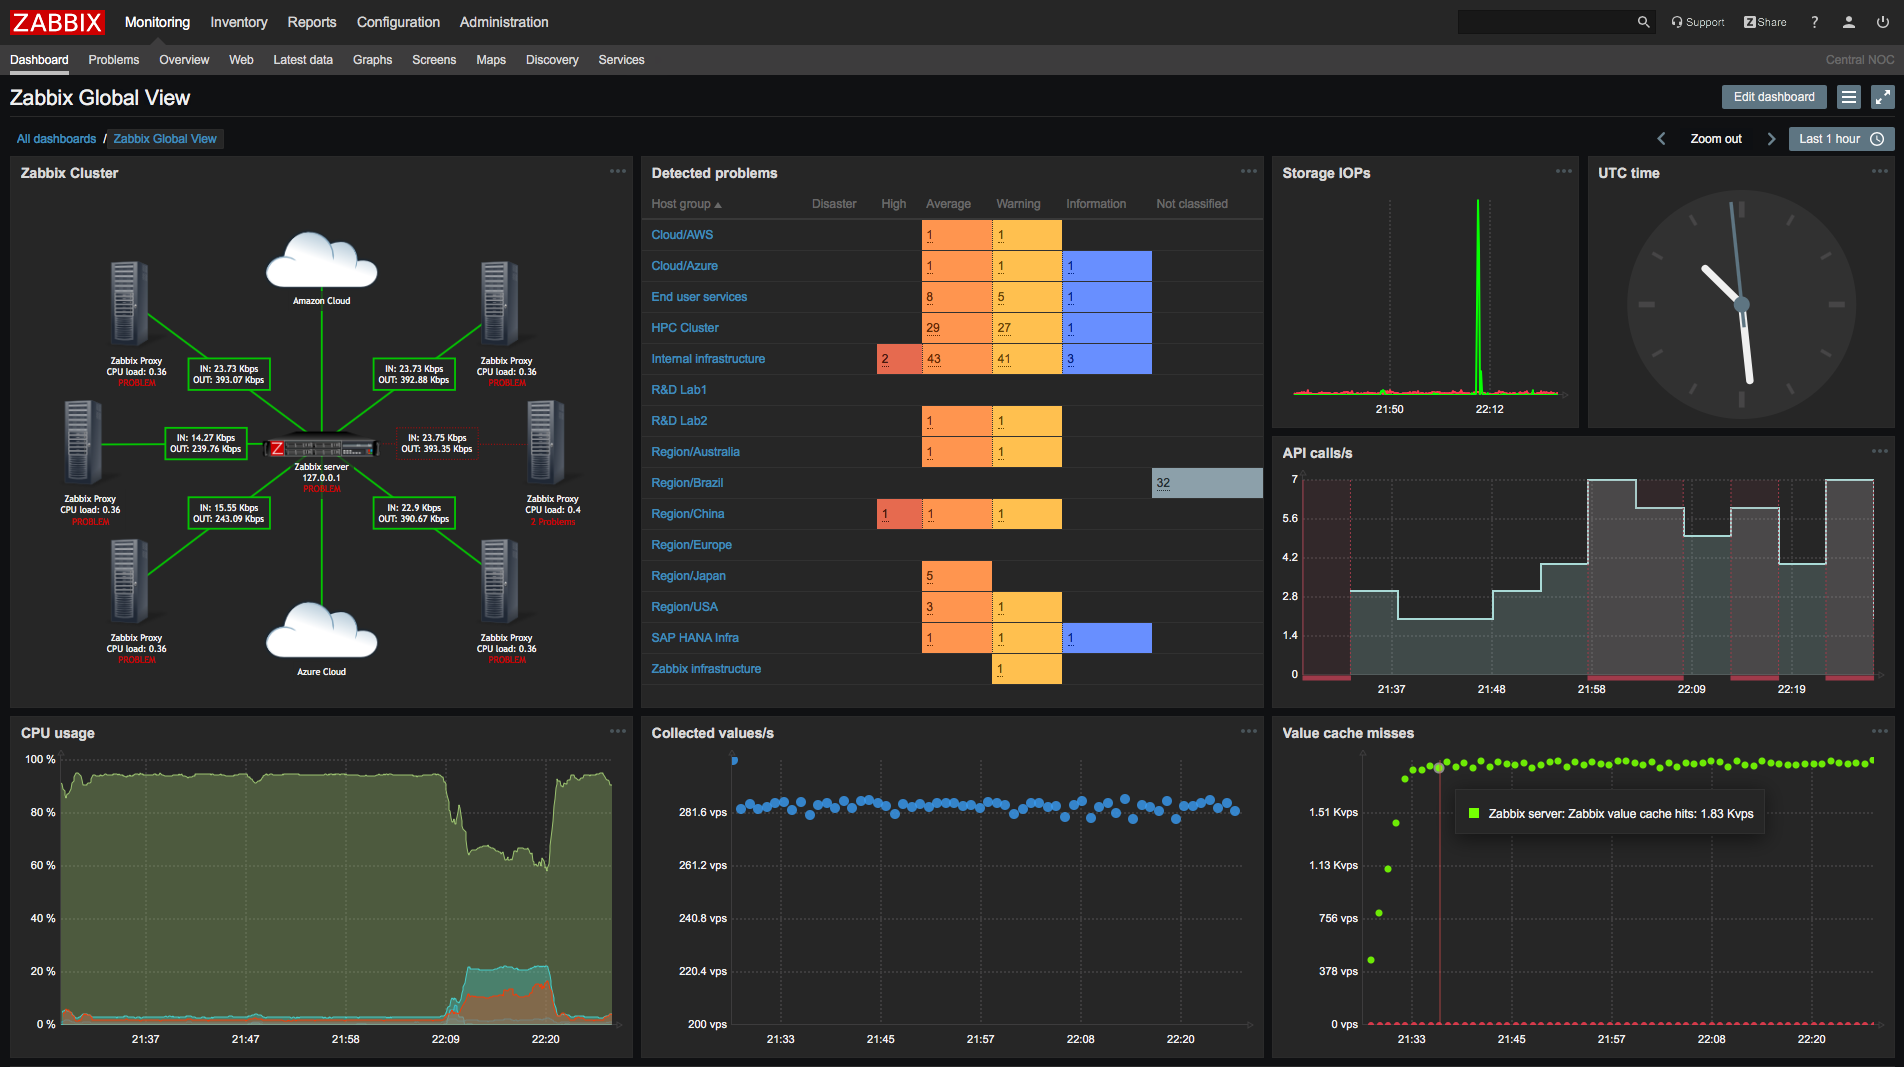
3. Zabbix

Zabbix is an open-source observability and IT infrastructure monitoring platform to monitor cloud environments, networks, services, and industrial systems. It is available as an on-premises deployment or as a managed cloud service and is built to support enterprise scalability, multi-environment monitoring, and long-term operational stability.
Key features of Zabbix:
- Open-source architecture: Fully open-source platform with no license fees and support for enterprise-scale environments.
- Flexible deployment options: Available on-premises, as a fully managed cloud service, or deployed in third-party cloud environments.
- Infrastructure monitoring: Monitors networks, cloud services, servers, applications, and IoT environments from a single platform.
- Scalable and high-availability design: Engineered for stable, large-scale deployments with support for distributed environments.
- Extensive integrations and APIs: Integrates with external systems and services to extend monitoring and automation capabilities.

Source: Zabbix
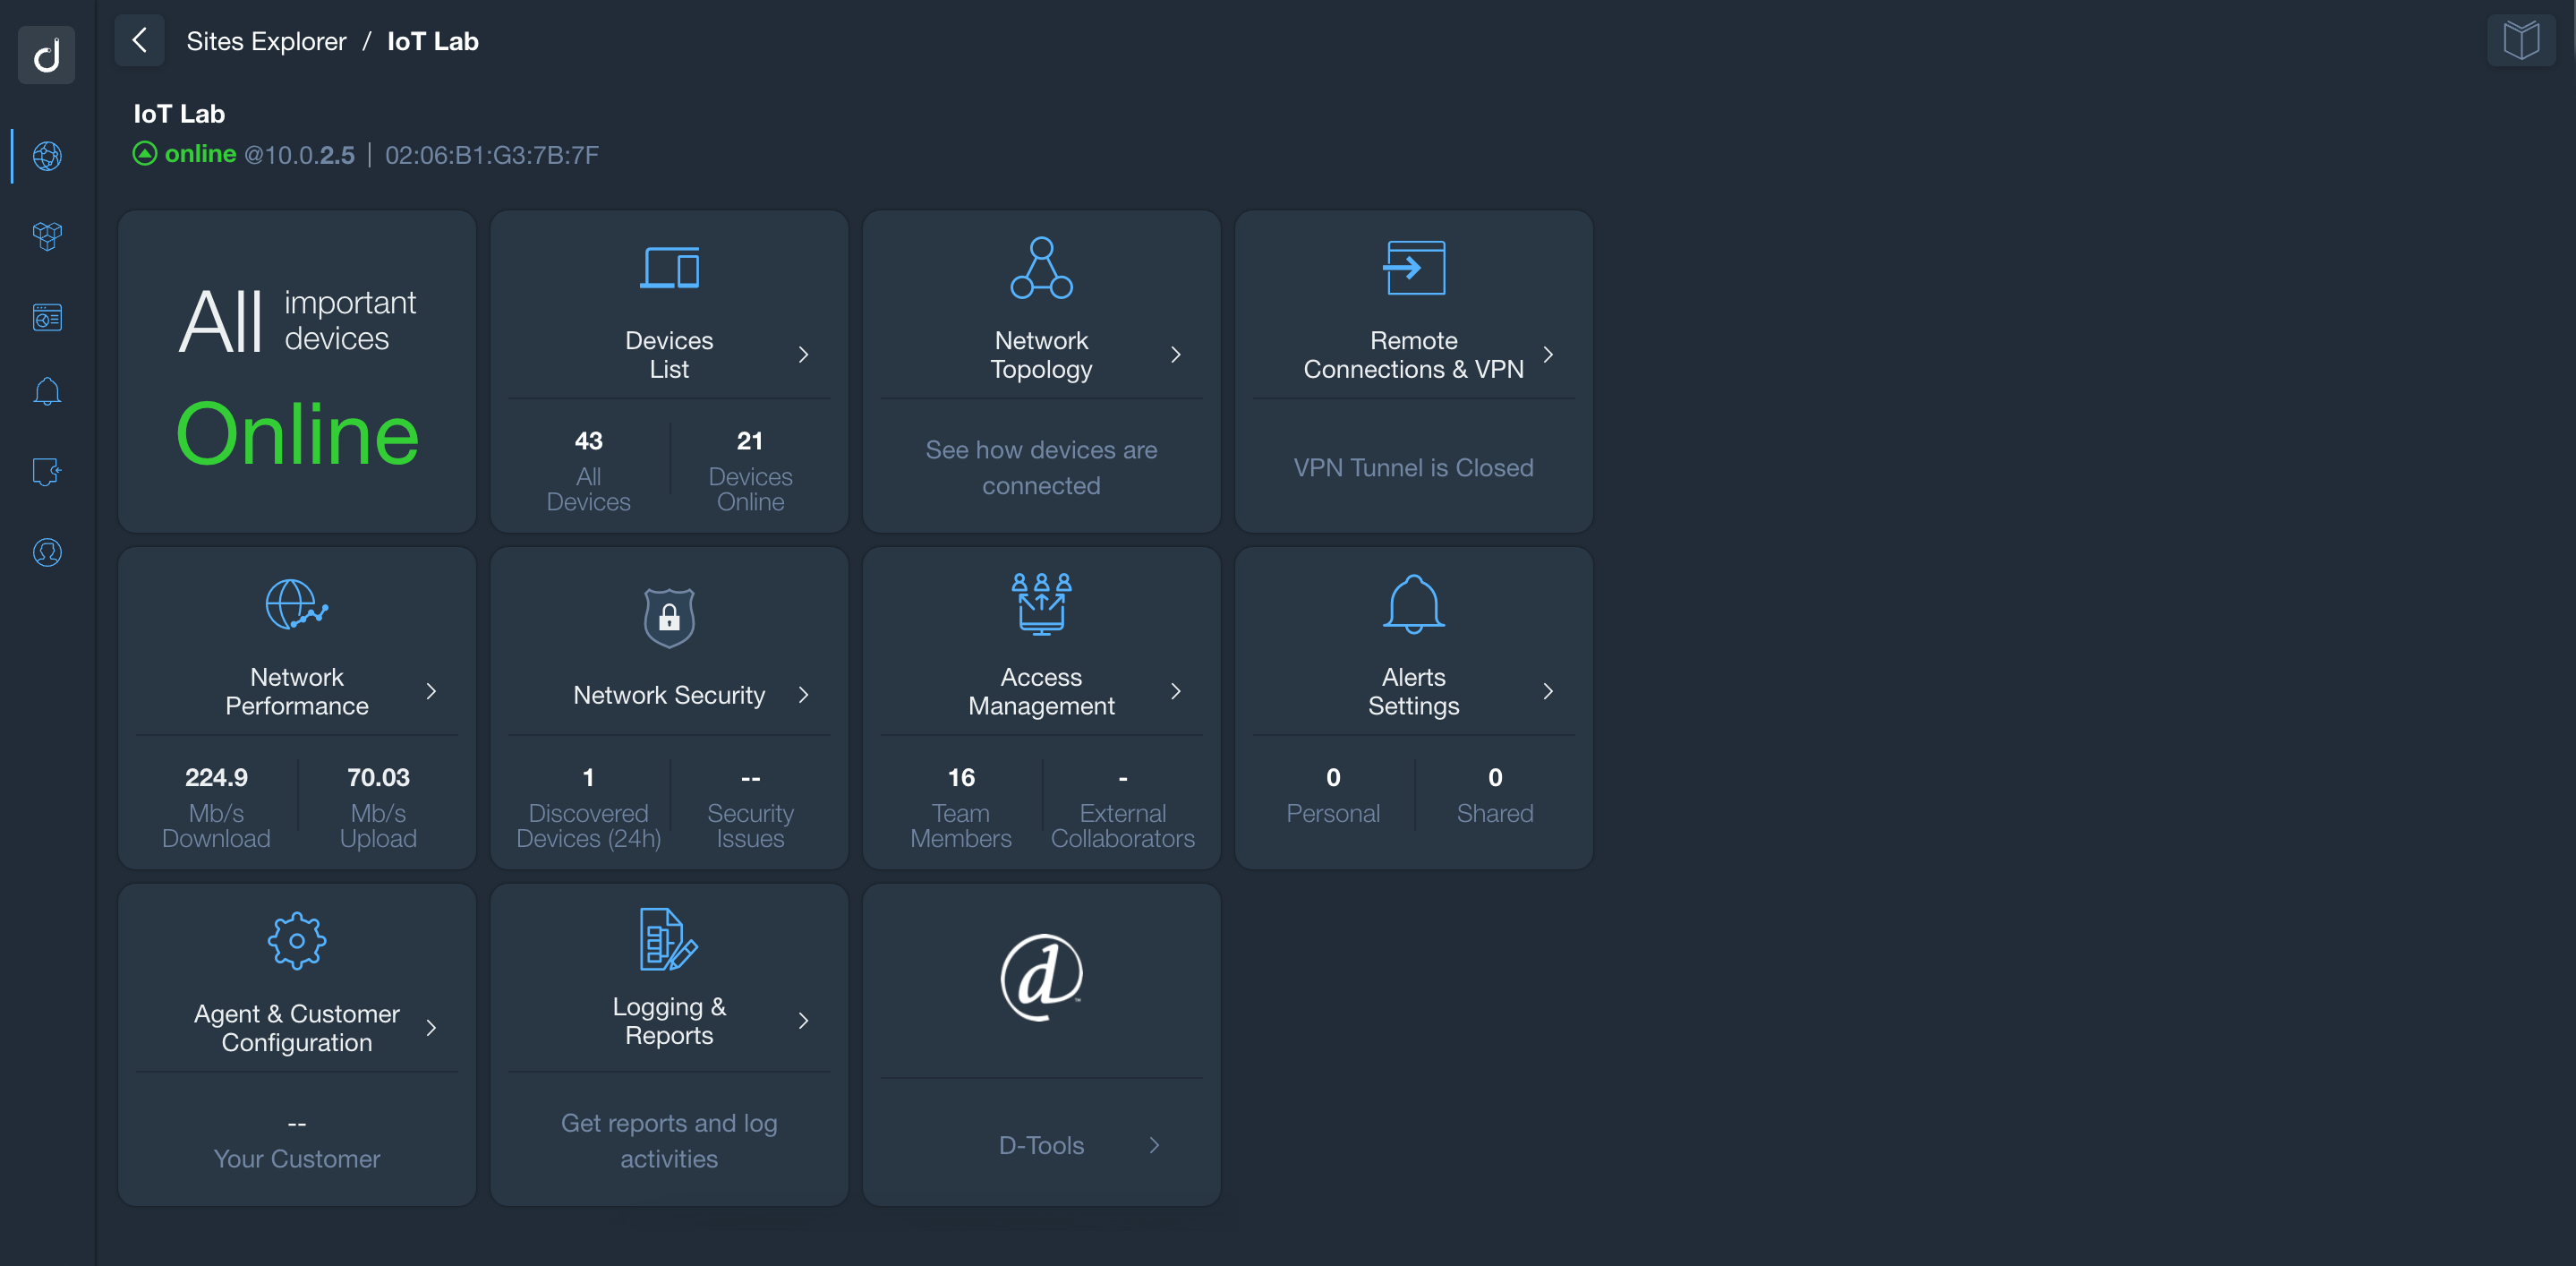
4. Domotz
Domotz is a cloud-based network monitoring and management platform designed for MSPs, IT teams, and system integrators. It provides remote visibility and control across distributed networks, enabling teams to discover, monitor, diagnose, and manage devices from a centralized interface.
Key features of Domotz:
- Automatic device discovery: Automatically identifies and inventories devices across Layer 2 and Layer 3 networks with real-time updates.
- Network topology mapping: Maps device relationships and visualizes network topology for improved context and troubleshooting.
- Real-time monitoring and alerting: Monitors device health, SNMP metrics, latency, packet loss, and other performance indicators with configurable alerts.
- Remote management capabilities: Supports secure remote access, configuration backup and restore, power management, and custom scripting.
- Network diagnostics tools: Includes tools for speed tests, route analysis, VPN on demand, open port detection, and IP conflict monitoring.

Source: Domotz
Remote Monitoring and Management (RMM) Platforms
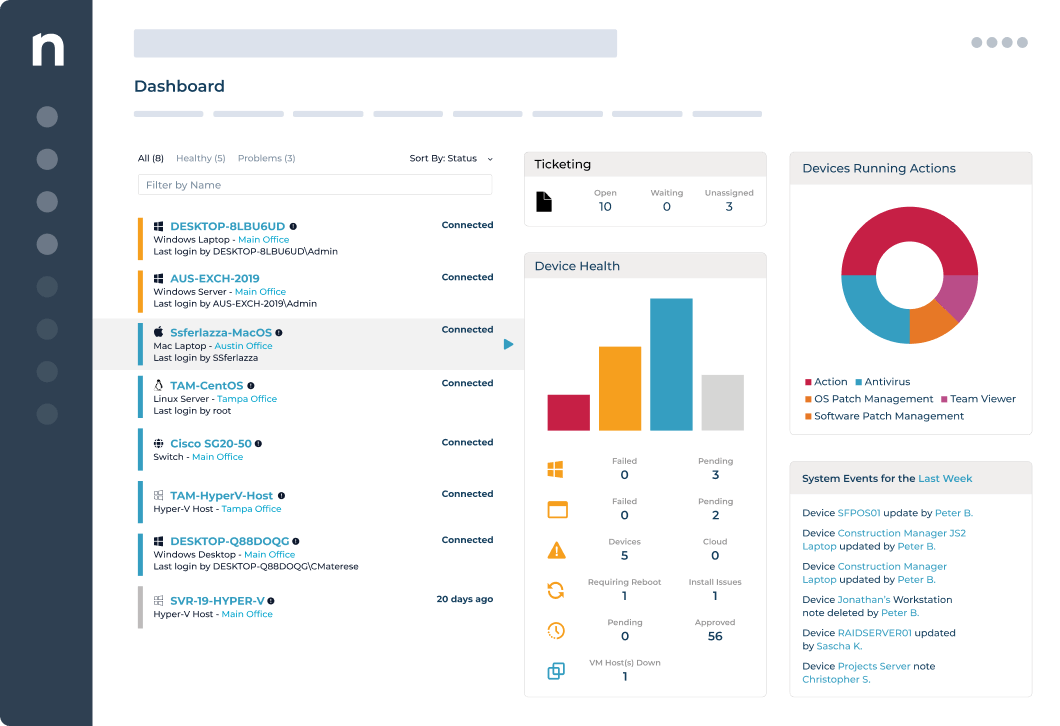
5. NinjaOne

NinjaOne is a unified IT operations and endpoint management platform that centralizes monitoring, patching, backup, and remote support. It enables IT teams and MSPs to manage distributed devices through a single console using automation and policy-based controls.
Key features of NinjaOne:
- Unified endpoint management: Provides centralized visibility and control over servers, workstations, laptops, mobile devices, VMs, and networking devices.
- Automated patch management: Automates OS and third-party patching to maintain security and compliance.
- Remote support capabilities: Enables secure remote access and troubleshooting to support distributed users.
- Policy-based automation: Standardizes device management through automated workflows and configuration policies.
- Reporting and analytics: Offers unified reporting tools to track performance, operational metrics, and device health.

Source: NinjaOne
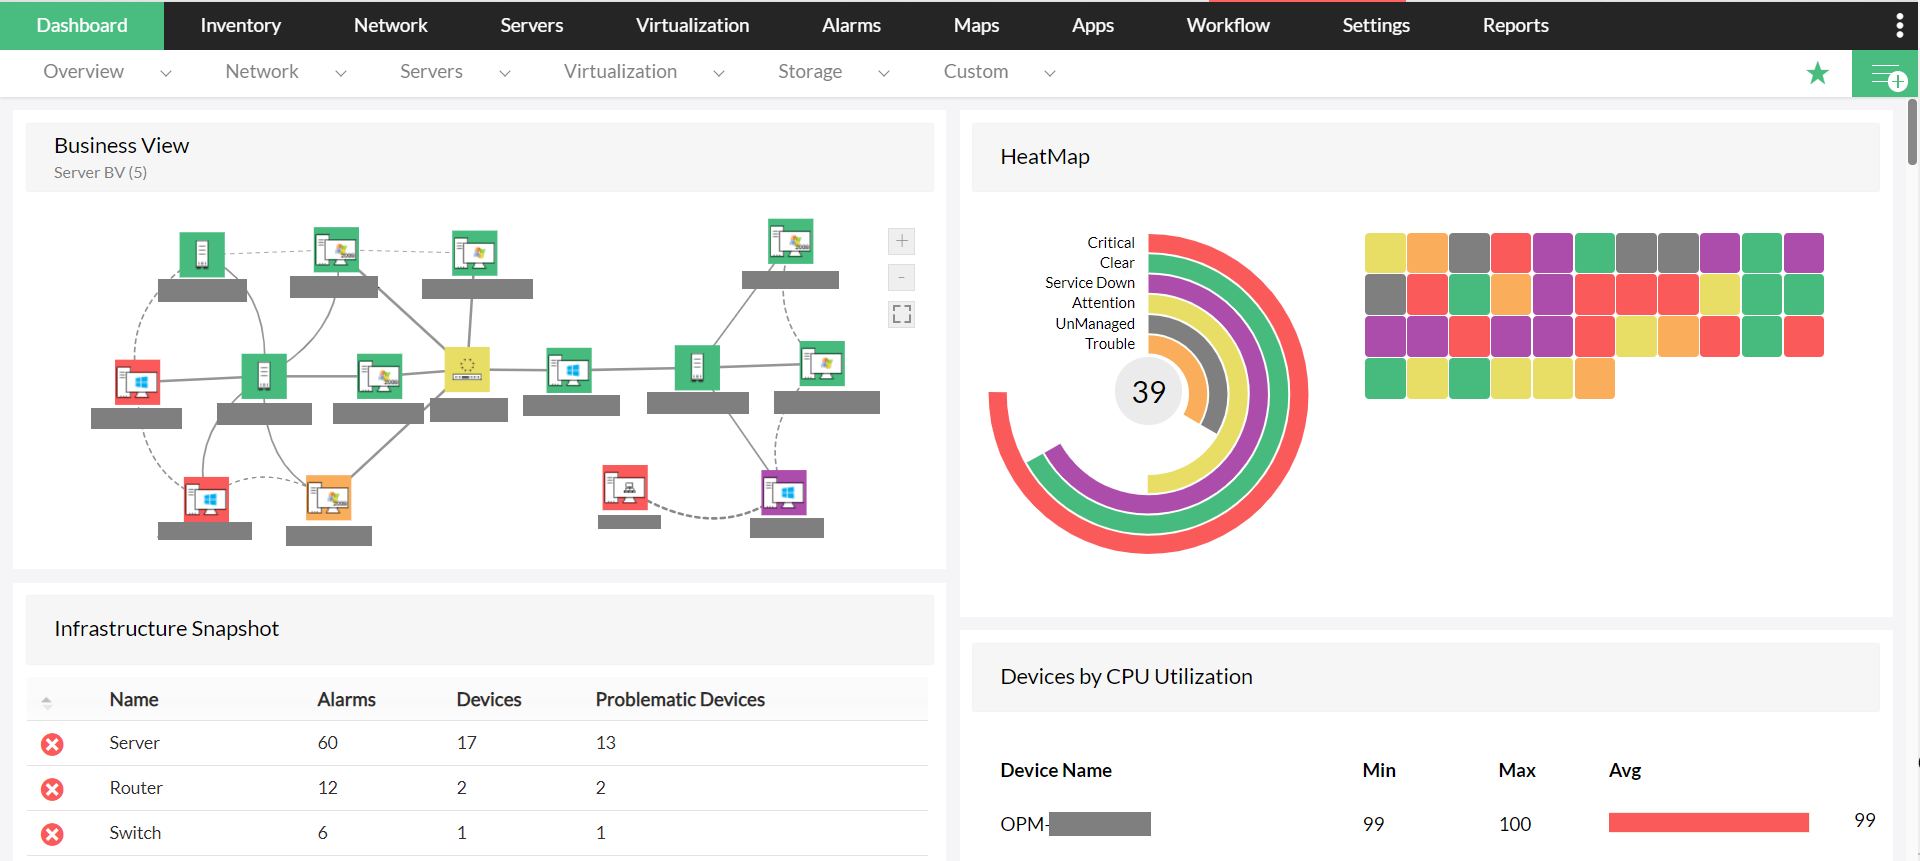
6. ManageEngine OpManager
ManageEngine OpManager is a network and server monitoring solution that provides visibility into the performance and availability of routers, switches, firewalls, servers, storage devices, and virtual environments. It supports distributed monitoring through a probe-based architecture and offers real-time fault and performance management.
Key features of ManageEngine OpManager:
- Real-time network monitoring: Monitors health, availability, and performance of IP-based devices across the network.
- Physical and virtual server monitoring: Supports monitoring of VMware, Hyper-V, Citrix, Xen, and Nutanix environments.
- Wireless and WAN monitoring: Tracks wireless infrastructure and WAN link performance using technologies such as Cisco IPSLA.
- Storage monitoring: Monitors storage arrays, fiber channel switches, and tape libraries with capacity and growth tracking.
- Fault management and alerts: Correlates events and generates severity-based alerts via email and SMS.

Source: ManageEngine
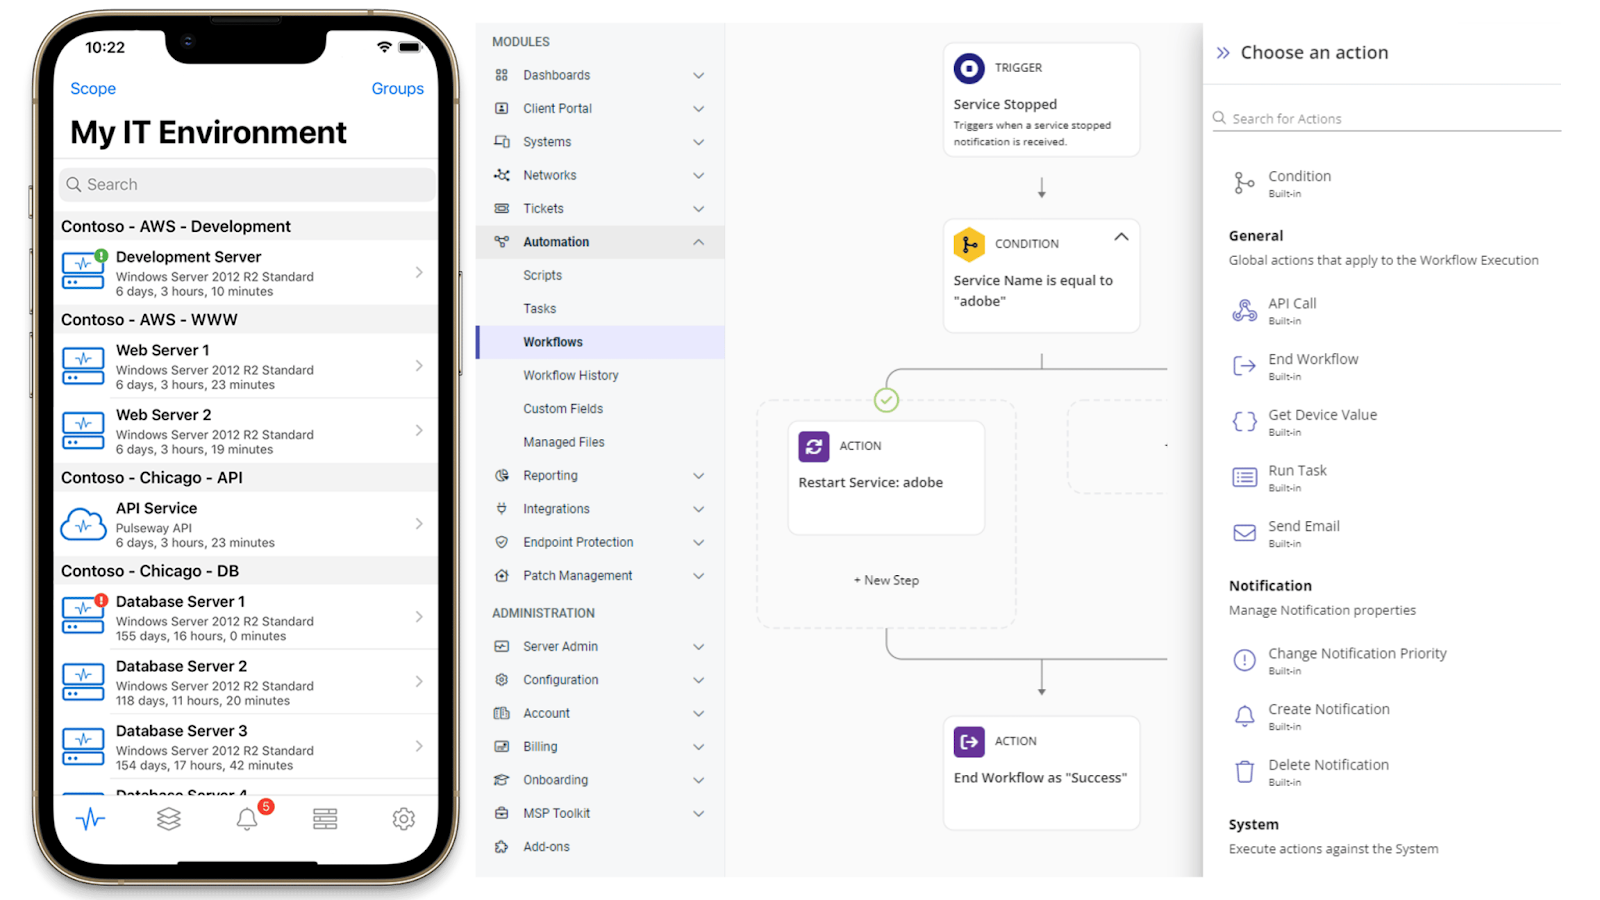
7. Pulseway

Pulseway is a remote monitoring and management (RMM) platform that enables IT teams to monitor, manage, and automate tasks across workstations, servers, and network devices. It provides real-time monitoring, patch management, and automation tools accessible from desktop and mobile devices.
Key features of Pulseway:
- Real-time monitoring and alerts: Provides actionable alerts across endpoints to support proactive issue resolution.
- Remote monitoring and management: Manages Windows, Mac, Linux systems, and network devices from a centralized interface.
- Automated patch management: Supports OS and third-party patch deployment to maintain system security.
- Scripting and automation: Enables task automation and auto-remediation for routine IT operations.
- Mobile management capabilities: Allows administrators to monitor and manage infrastructure from mobile devices.
Source: Pulseway
8. Atera

Atera is an IT management platform that combines remote monitoring and management, ticketing, patching, and automation into a single system. It helps IT teams manage endpoints and resolve issues, with added support for AI-driven automation that can handle incidents with minimal manual intervention.
Key features of Atera:
- All-in-one IT management platform: Combines RMM, help desk, ticketing, and patch management into a unified system for centralized operations.
- Autonomous IT capabilities: Uses AI agents to investigate, diagnose, and resolve device and cloud issues with minimal human input.
- Integrated ticketing and service desk: Includes built-in ticketing to manage requests, track issues, and coordinate support workflows.
- Automation and workflow execution: Automates routine IT tasks and remediation actions across endpoints and cloud environments.
- Cross-environment management: Supports managing devices, networks, and cloud systems from a single interface with integrated tooling.
Source: Atera
Observability and Application Performance Monitoring (APM) Platforms
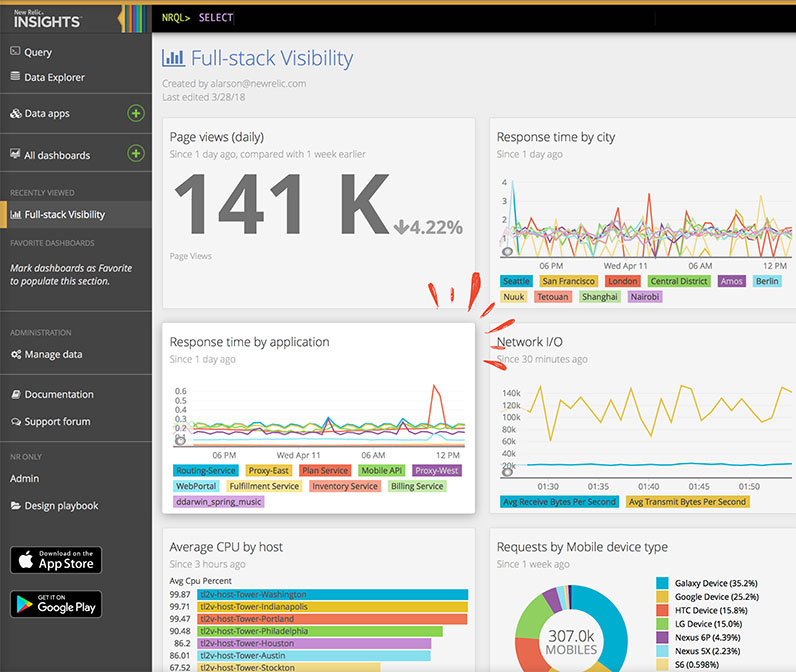
9. New Relic

New Relic is an observability platform that provides full-stack monitoring across infrastructure, applications, logs, and user experiences. It consolidates telemetry data into a single platform to help engineering and IT teams detect, troubleshoot, and optimize system performance.
Key features of New Relic:
- Full-stack observability: Monitors infrastructure, APM, logs, traces, network, Kubernetes, and cloud services in one platform.
- Distributed tracing and APM: Provides end-to-end tracing across services, databases, and dependencies.
- Infrastructure and cloud monitoring: Monitors hosts, containers, serverless environments, and major cloud platforms.
- Real-time alerts and anomaly detection: Supports alerting, anomaly detection, and dashboards for proactive monitoring.
- Extensive integrations: Offers over 780 integrations across languages, frameworks, and cloud providers.
Source: New Relic
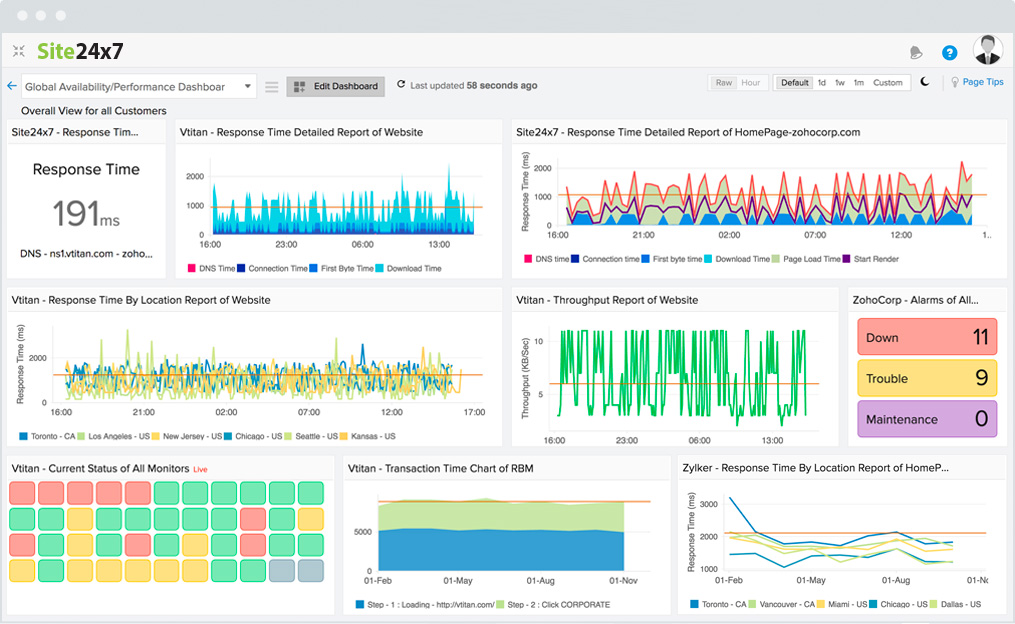
10. Site 24×7

Site24x7 is an AI-powered monitoring and observability platform for DevOps and IT operations teams. It provides unified monitoring for websites, servers, cloud infrastructure, applications, networks, and user experience from a centralized console.
Key features of Site24x7:
- Cloud and infrastructure monitoring: Monitors AWS, Azure, GCP, VMware, and on-premises servers.
- Application performance monitoring: Tracks performance for Java, .NET, Ruby, PHP, Node.js, and mobile applications.
- Website and synthetic monitoring: Monitors websites, APIs, and internet services from global locations.
- Network monitoring: Provides visibility into routers, switches, firewalls, and network performance metrics.
- AIOps capabilities: Uses AI and machine learning for anomaly detection and automated incident remediation.
Source: Site24x7
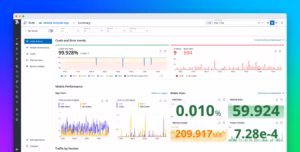
11. Datadog
![]()
Datadog is a cloud-based observability platform that provides application performance monitoring (APM), infrastructure monitoring, and distributed tracing across cloud-scale environments. It correlates traces, logs, metrics, user experience data, and security signals to support troubleshooting and performance optimization.
Key features of Datadog:
- Distributed tracing: Provides code-level distributed tracing from frontend applications to backend services and databases.
- Telemetry correlation: Correlates traces with logs, metrics, real user monitoring (RUM), and security signals in a unified view.
- AI-powered anomaly detection: Uses automated root cause analysis and machine learning-based alerts to detect anomalies.
- Change tracking: Correlates performance issues with deployments, configuration changes, and feature updates.
- Flexible ingestion and OpenTelemetry support: Supports agent-based tracing, sampling controls, and native or hybrid OpenTelemetry setups.
Source: Datadog
Conclusion
Network monitoring solutions are essential for maintaining the health and performance of IT infrastructures. These tools offer critical features such as real-time visibility, alerting, and device management, which help organizations proactively identify and resolve network issues. With the ability to monitor diverse systems, optimize resources, and enhance security, businesses can ensure that their networks remain stable, efficient, and secure, enabling smoother operations and minimizing downtime.
While many tools offer comprehensive features, the most effective solutions are those that offer deep visibility, ease of use, and scalability, making them ideal for organizations with complex environments. Tools like Faddom, which emphasize minimal resource impact and robust security, provide a solid foundation for optimizing IT infrastructure and reducing disruptions.
Learn more about Faddom for application mapping or start a free trial to the right

