What Is Paessler PRTG Monitoring?
Paessler PRTG is an IT monitoring solution that enables system administrators to monitor the health, performance, and availability of network devices, services, and applications across on-premises, cloud-based, or hybrid environments. It provides three main products: PRTG Network Monitor, suitable for small to mid-size IT infrastructure, PRTG Enterprise Monitor, suitable for large IT infrastructure, and PRTG Hosted Monitor, a cloud-based solution.
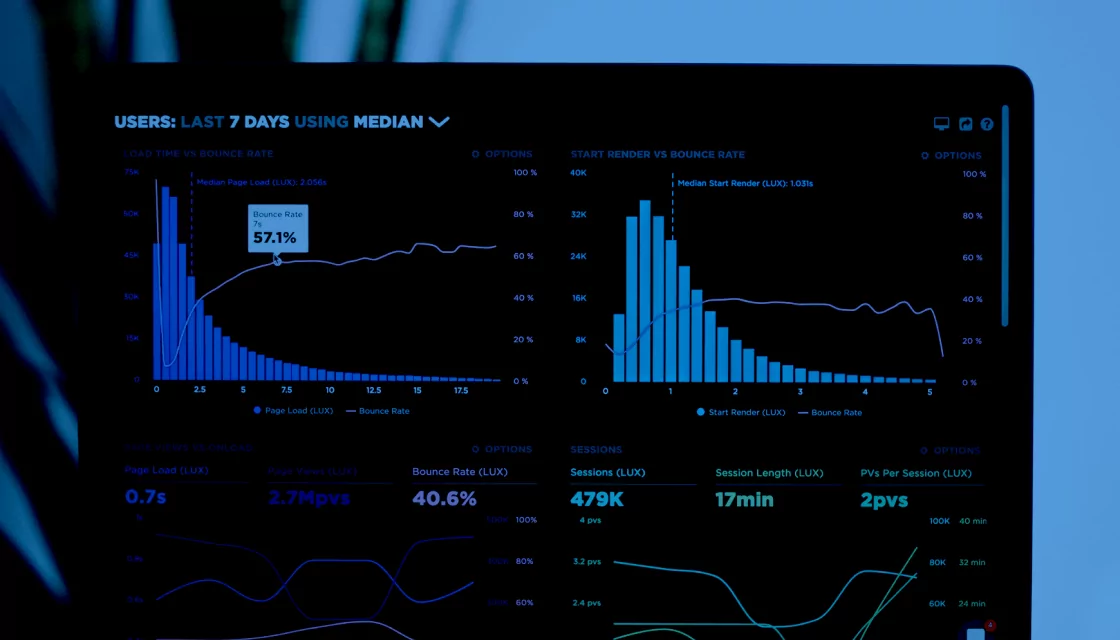
By providing real-time data and alerts for potential issues, PRTG helps IT systems operate smoothly. Its features include automatic network discovery, customizable dashboards and reports, distributed monitoring capabilities, and support for multiple technologies such as SNMP, WMI, SSH, HTTP requests, and flow protocols like NetFlow.
Table of Contents
ToggleThis is part of an extensive series of guides about cybersecurity
Paessler PRTG Monitoring Products
PRTG Network Monitor
PRTG Network Monitor is designed for small to medium-sized IT environments, offering comprehensive monitoring capabilities. It provides a centralized view of the network, making it easier for system administrators to track the performance and availability of various devices, applications, and services. This solution supports a range of monitoring technologies, including SNMP, WMI, SSH, and flow protocols, ensuring compatibility with diverse IT setups.
The software includes features like automatic network discovery, which simplifies the setup process by identifying and categorizing all networked devices. Additionally, PRTG Network Monitor offers customizable dashboards and reports, enabling users to tailor their monitoring experience to specific needs.
PRTG Enterprise Monitor
PRTG Enterprise Monitor extends Paessler’s monitoring capabilities to large IT infrastructure. It enables organizations to monitor their entire IT environment, including business services and SLAs. Its architecture supports an unlimited number of PRTG servers, allowing for increased flexibility in monitoring extensive networks across various locations.
This enterprise solution includes features like centralized overview through PRTG MultiBoard, service-based SLA monitoring with ITOps Board, and offline monitoring capabilities. These functionalities cater to the needs of large-scale environments, providing a consolidated view of multiple installations and ensuring security for air-gapped systems.
PRTG Hosted Monitor
PRTG Hosted Monitor delivers cloud-based monitoring for IT infrastructure, suitable for both small and large environments. This service allows users to monitor systems, devices, applications, and traffic without installing dedicated hardware. Hosted on AWS servers, it’s easy to set up and use, providing flexibility through a subscription-based pricing model.
The service is designed for ease of maintenance with automatic updates and backups, allowing customers to avoid the complexity and overhead of managing PRTG infrastructure.
Learn more in our detailed guide to PRTG monitoring
Paessler PRTG Monitoring Features
PRTG offers the following features:
- Distributed monitoring: Allows organizations to oversee multiple remote locations through a single interface, useful for geographically dispersed sites. System administrators can centrally manage and analyze the health and performance of all IT assets.
- Automatic network discovery: Simplifies the initial setup and ongoing management of IT monitoring. It automatically identifies all devices within a network, such as servers, routers, switches, and printers, and creates appropriate monitoring sensors for them.
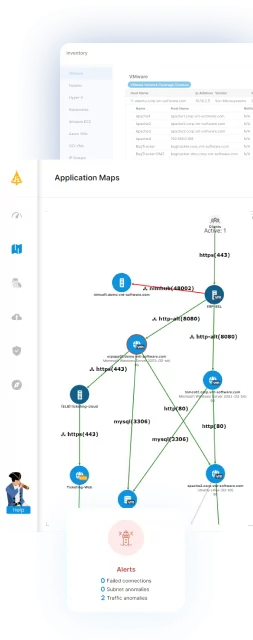
- Maps and dashboards: Offer users a visual representation of their IT infrastructure, allowing for real-time monitoring and quick access to data from various devices and services. With the PRTG map designer, users can create custom maps that display live status information, making it easier to understand the network’s performance.
- Customizable reporting: Allows users to generate detailed reports on the status and performance of their IT infrastructure. Administrators can select specific data points, set the reporting period, and design the layout of reports to meet their unique requirements.
Paessler PRTG Monitoring Limitations
When evaluating PRTG, you should be aware of the following limitations, reported by users on the G2 platform.
Alarm Management Complexity
Managing alarms in PRTG can become complex due to the volume and variety of alerts generated across the IT infrastructure. As networks expand and diversify, system administrators may face challenges in prioritizing and responding to alarms. They need to fine-tune alert thresholds and filter out false positives to minimize unnecessary notifications.
Cost
The cost of PRTG is influenced by the scale of deployment and the monitoring needs of an organization. PRTG offers a free version with limited sensors for small networks, but larger deployments can be expensive, with associated software licensing and maintenance costs.
Customization Requirements
Customizing PRTG to fit specific monitoring needs requires understanding both the IT infrastructure and the tool’s capabilities. Users may need to invest time in setting up custom sensors, maps, and reports that align with their operational objectives, which can require significant time and effort.
Paessler PRTG Alternatives
1. Faddom
Faddom is a lightweight application dependency mapping tool. It allows you to map all your servers into the business app they support in less than 60 minutes. It is agentless, it doesn’t require any credentials, and it’s very affordable, starting at $10K/year.
Key features:
- Hybrid Mapping: Supports all IT resources, on-premises and in the cloud, including KVM, AWS, Azure, Google Cloud, and Oracle Cloud.
- Real-time mapping: Faddom maps the entire environment in real-time, updating 24/7
- Easy deployment: Automated lightweight deployment, takes less than 60 minutes
2. Atera
Atera is a cloud-based IT management platform that integrates remote monitoring and management (RMM) with professional services automation (PSA) in a single suite. Designed for managed service providers (MSPs) and IT professionals, it offers a solution for managing, monitoring, and automating IT tasks.
Key features:
- RMM suite: Offers real-time insights into client networks, servers, and endpoints. Enables remote troubleshooting without disrupting end-user operations.
- Integrated PSA features: Streamlines service desk operations with ticketing, invoicing, billing, and reporting. Enhances operational efficiency by consolidating tools.
- Patch management: Automates the process of updating software across all managed devices. Ensures security vulnerabilities are addressed promptly.
- Network discovery: Automatically scans networks to identify devices and create an inventory. Simplifies asset management and ensures visibility into the entire infrastructure.
- Built-in remote access: Facilitates quick connection to client devices for troubleshooting. Reduces downtime by allowing immediate action on issues detected during monitoring.
Source: Atera
3. Auvik
Auvik is a cloud-based network management software designed to provide visibility and control over IT infrastructure. It automates complex network management tasks, making it easier for IT departments and managed service providers (MSPs) to manage their networks.
Key features:
- Automatic discovery and mapping: Automatically identifies all network devices and generates detailed, real-time network maps.
- Real-time monitoring: Offers continuous monitoring of network devices, services, and performance metrics. Enables IT teams to detect issues early and address them proactively.
- Configuration management: Automatically backs up device configurations, allowing for quick restoration in case of device failure or misconfiguration.
- Traffic analysis: Provides insights into network traffic patterns, bandwidth usage, and potential bottlenecks. Helps in optimizing network performance and planning for future capacity needs.
- Alerting and reporting: Customizable alerts notify teams about critical issues that need attention. Detailed reports offer insights into network health, performance trends, and improvement opportunities.
Source: Auvik
4. NinjaOne
NinjaOne is a unified IT management platform that simplifies the complexity of IT environments. It monitors, manages, and secures endpoints across various platforms and devices. By integrating remote monitoring and management with endpoint security, backup, and patch management into a single solution, it supports proactive maintenance of IT infrastructure.
Key features:
- Cross-platform support: Supports Windows, macOS, and Linux devices, enabling monitoring and management of diverse IT environments from a unified console.
- Automated monitoring and alerting: Configurable monitoring templates allow for automated tracking of system health and performance indicators.
- Integrated patch management: Simplifies the process of keeping software up to date across all managed endpoints. Supports automated patching policies for critical security updates.
- Remote access and support: Offers secure, VPN-less remote access to endpoints for troubleshooting and support tasks. Enhances productivity by enabling quick resolution of user issues without physical presence.
- Backup and disaster recovery: Provides data protection features including automated backup schedules and easy recovery options.
Source: NinjaOne
5. Site24x7 Network Monitoring
Site24x7 Network Monitoring is a cloud-based solution that provides insights into the performance and health of IT infrastructure. It covers various aspects of network monitoring, including IT infrastructure, applications, and user behavior analysis. This tool is designed to ensure the reliability of network operations through real-time monitoring.
Key features:
- Cloud-based flexibility: Allows for scalable monitoring solutions across different environments, including on-premises, cloud, and hybrid models.
- Detailed monitoring: Offers monitoring of critical network devices ensuring their health and performance are up to par. This includes routers, switches, firewalls, and more.
- Automatic device discovery: Automates the process of identifying new devices within the network.
- Customizable dashboards: Provides dashboards that display vital metrics about the network’s performance. Users can tailor these dashboards to meet their specific monitoring needs.
- Analytics: Provides actionable insights into network performance issues, helping resolve problems before they affect end-users.
- Alerting mechanism: Notifies administrators about potential issues in real time, allowing for rapid action to mitigate potential downtime or performance degradation.
Source: Site24x7
6. ManageEngine OpManager
ManageEngine OpManager is a network and server monitoring solution that offers visibility into the performance of routers, switches, firewalls, servers, and virtual machines. It enables IT administrators to quickly identify and resolve network issues before they impact operations.
Key features:
- Versatile monitoring capabilities: Monitors a range of devices including routers, switches, firewalls, servers (both physical and virtual), and other network hardware.
- Automatic device discovery: Simplifies network setup by automatically identifying and cataloging devices within the network.
- Customizable dashboards: Offers dashboards that provide at-a-glance insights into network health and performance metrics.
- Real-time alerts: Configurable alerts notify administrators about critical issues, enabling rapid response to prevent downtime.
- In-depth reporting: Generates detailed reports on network performance, helping teams analyze trends and plan for future needs.
- Multi-vendor support: Compatible with devices from multiple vendors, enabling monitoring across the IT infrastructure.
Source: ManageEngine
Learn more in our detailed guide to PRTG alternatives
Conclusion
While Paessler PRTG offers comprehensive monitoring capabilities, it also has several limitations that may prompt organizations to seek alternatives. Users have reported complexities in alarm management, which can make prioritizing and responding to alerts challenging.
The cost of deployment and maintenance can be high, especially for larger networks, and significant customization is often required to meet specific monitoring needs. These factors highlight the importance of evaluating alternative solutions that might offer more straightforward management, lower costs, or better customization options.
Learn more about Faddom for resource and cost optimization or start a free trial today!
See Additional Guides on Key Cybersecurity Topics
Together with our content partners, we have authored in-depth guides on several other topics that can also be useful as you explore the world of cybersecurity.
Solarwinds SAM
Authored by Faddom
- [Guide] SolarWinds SAM: Key Features,Pricing, Limitations, and Alternatives
- [Guide] PRTG Network Monitor vs. SolarWinds: 4 Key Differences and How to Choose
Device42
Authored by Faddom
- [Guide] Device42: 5 Key Features, Limitations, and Alternatives
- [Guide] Device42 Pricing: The 5 Pricing Tiers Explained – Faddom
- [Product] Faddom | Instant Application Dependency Mapping Tool
Application Security
Authored by Radware


