
TL;DR: SolarWinds SAM alternatives split into dependency mapping tools and broader performance monitoring platforms. Best for: Faddom (agentless mapping), ServiceNow Service Mapping (CMDB-integrated), ManageEngine (unified APM), and Datadog (observability).
What Is SolarWinds Server & Application Monitor (SAM)?
SolarWinds SAM (Server & Application Monitor) is a comprehensive monitoring software that tracks the health, performance, and availability of servers and applications across on-premises, cloud, and hybrid environments from a single web console. It is an on-premise installed solution, which is offered standalone or as part of the SolarWinds Hybrid Cloud Observability platform.
SAM comes with over 1,200 out-of-the-box monitoring templates and more than 1,000 community-contributed templates. This enables tailored monitoring that can adapt to the unique demands of specific IT workloads. In addition to its monitoring templates, SAM allows users to build custom monitoring solutions using a REST API, WMI, SNMP, and PowerShell scripts.
The solution supports monitoring of application performance, availability, application dependency mapping, and cloud monitoring, and provides detailed reports and alerts that allow IT teams to respond to application issues.
Key features of SolarWinds SAM include:
- Out-of-the-box templates: Over 1,200 built-in and community-contributed monitoring templates for popular applications like Active Directory, SQL Server, and IIS.
- Flexible polling: Agentless monitoring plus optional SolarWinds Platform agents for secure data collection across complex network boundaries.
- Alerts and dashboards: Real-time performance dashboards, customizable threshold alerts, and dependency mapping to isolate bottlenecks.
- Hardware and inventory tracking: Monitoring of critical hardware components such as temperature and power supply, alongside software and asset inventories.
Common systems you can monitor with SAM include:
- Windows and Active Directory servers: Troubleshoot health and performance issues across Active Directory environments and domain controllers.
- Cloud instances: Monitor AWS and Microsoft Azure IaaS and PaaS resources for performance and configuration.
- Linux, Apache, and web servers: Track performance across Linux environments, Apache services, and FTP services.
- Applications and containers: Monitor Docker containers, Java Virtual Machines, Microsoft .NET applications, and email and Exchange servers.
This is part of an extensive series of guides about cybersecurity
What Can You Monitor with SolarWinds SAM?
SolarWinds SAM offers extensive monitoring capabilities that cater to various IT infrastructure components. Here are a few commonly used systems you can monitor:
- Active Directory servers: Quickly troubleshoot health and performance issues in Active Directory environments.
- AWS cloud instances: High-visibility, proactive monitoring tools optimized for performance across AWS cloud instance types.
- Microsoft Azure: Includes comprehensive monitoring solutions for Azure IaaS and PaaS platforms, aiding in performance management and configuration.
- Linux servers: Comprehensive management and performance monitoring across multiple Linux environments.
- Apache servers: In-depth monitoring capabilities for Apache servers and services, ensuring optimal performance.
- Docker containers: Monitor and improve Docker application performance through detailed container monitoring.
- Domain Controllers: Get proactive notifications of service outages or performance issues.
- Email and Exchange servers: Consolidate monitoring for security and performance across various email platforms, including Microsoft Exchange.
- FTP services: Track FTP service performance and availability issues.
- Java Virtual Machines (JVM): Detect performance bottlenecks and optimize Java application performance.
- Microsoft .NET applications: Enterprise-grade monitoring for .NET applications, ensuring performance and availability.
Here is the full list of monitoring use cases supported by SAM.
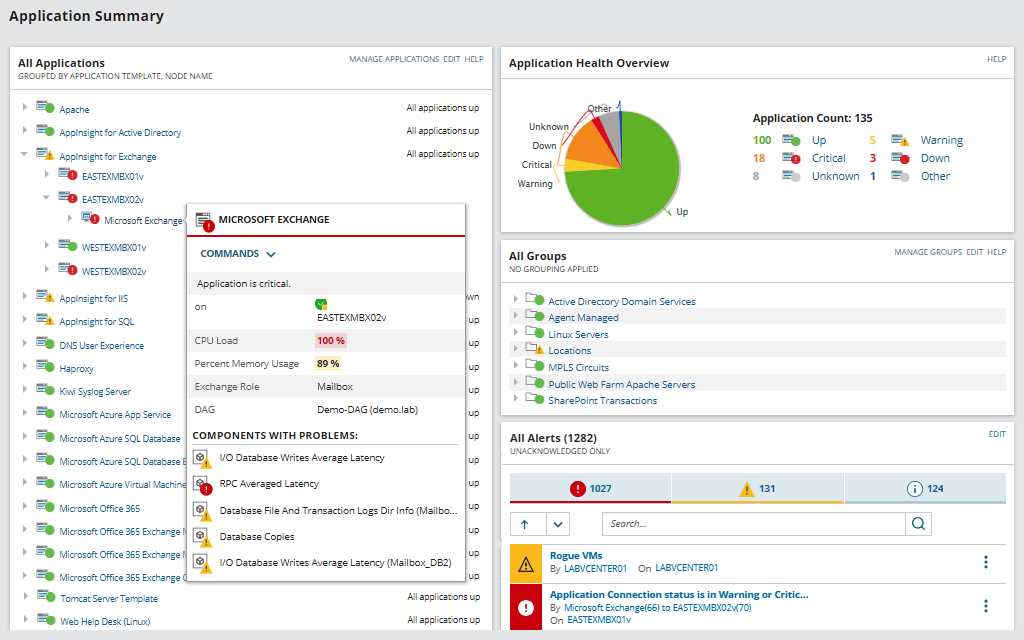
Source: SolarWinds
Key Features of SolarWinds SAM
Application Availability and Performance Monitoring
SolarWinds SAM allows IT teams to detect, diagnose, and resolve application performance issues. By offering performance metrics in real-time, SAM ensures that administrators can quickly identify slowdowns or failures, minimizing downtime and improving service delivery.
Learn more in our detailed guide to prtg network monitor vs solarwinds
In addition to system health checks, SAM alerts users to availability issues across a range of platforms and environments, from data centers to cloud services. This helps maintain operational efficiency and ensures continuous system availability.
Application Dependency Mapping
Understanding the dependencies within application infrastructure is essential for maintaining optimal performance and facilitating trouble-free operations. SolarWinds SAM maps these dependencies visually, aiding in the swift pinpointing of root causes when issues arise.
As IT infrastructures grow and evolve, keeping track of changes can be challenging. SAM’s automated discovery and mapping capabilities ensure that changes to the IT environment, such as adding new components or updating existing ones, are reflected in the visual map.
Cloud Application Monitoring
SolarWinds SAM can also monitor cloud-hosted resources and applications, allowing teams to oversee and manage cloud environments. This feature is critical for achieving visibility and control over applications outside traditional on-premise environments.
SAM’s cloud monitoring tracks performance and also provides insights into cost-effectiveness and resource usage, helping optimize cloud deployments. Administrators can adjust resources based on demand, while maintaining control over cloud costs.
Cross-Stack IT Data Correlation
SolarWinds SAM provides a broad view of IT infrastructure, correlating data across multiple layers and technologies. This helps diagnose complex, multi-tier issues more efficiently, reducing the time taken to identify and rectify problems.
By integrating data from various sources including network, storage, and virtualization layers, SAM facilitates a better understanding of how different components interact and affect overall performance.
Customizable Reports and Alerts
SolarWinds SAM offers customizable reporting and alerting functions. IT administrators can tailor reports and alerts to reflect specific metrics that are crucial for their operational objectives, ensuring that they receive relevant and actionable information.
These tools aid in immediate problem-solving, and can also assist in long-term planning and performance optimization. With the ability to schedule and automate reports, as well as configure alerts for early symptom detection, teams can preempt potential issues and support proactive IT management practices.
Flexible Polling
SolarWinds SAM supports agentless monitoring as well as optional SolarWinds Platform agents for secure data collection across complex network boundaries. Agentless methods such as WMI and SNMP require no software on the monitored device, while the optional agents add encryption, use fewer open ports, and are better suited to monitoring cloud-based and remote resources that traditional agentless protocols struggle to reach.
Teams can override the polling method at the template or application-monitor level, choosing agent or agentless collection to match the location and security requirements of each monitored system.
Hardware and Inventory Tracking
Beyond applications, SAM monitors critical hardware components such as temperature, fan speed, and power supply status across multi-vendor servers including Dell, HP and HPE ProLiant, and IBM, alerting on potential failures before they impact performance.
SAM also provides built-in asset inventory that scans the environment and collects details on hardware and software, including drivers, firmware, memory, network interfaces, processors, and installed updates, giving teams a single view of hardware, software, and asset data.
SolarWinds SAM Pricing
There are three options for purchasing SolarWinds SAM:
- Free trial: For those interested in trying SAM with no risk, SolarWinds offers a fully functional free trial for 30 days.
- Perpetual license fee: Starts at $1,886 one-time license fee (pricing may increase depending on component monitors used)
- Subscription pricing: SolarWinds offers SAM at a subscription cost, with terms of 1, 3, and 5 years. Subscription pricing requires obtaining a quote from SolarWinds sales.
SolarWinds SAM Limitations
When evaluating SolarWinds SAM, it is important to be aware of the following limitations, which were reported by users on the G2 platform.
Complex Maintenance and Scalability Challenges
Users of SolarWinds SAM report certain difficulties, particularly in large and complex environments. Updates and maintenance can become complex when multiple instances or extensive customizations are involved.
Additionally, scalability is a significant concern in large deployments, where performance can sometimes lag behind expectations. Users have reported this impacts the overall effectiveness of the monitoring solution, especially when trying to scale operations across a sprawling IT infrastructure.
User Interface and Customization Limitations
Another notable limitation is the SolarWinds SAM user interface, which many users find initially cluttered and challenging to navigate. The tool also lacks sufficient customization options that many users seek, limiting the tool’s utility for certain operational contexts.
Cost and Licensing Constraints
The cost of implementing SolarWinds SAM can be prohibitively high for some organizations, primarily because the pricing structure is based on the number of monitors used. Each component monitor, whether it measures server performance, processes, or scripts, adds to the overall cost, potentially making it an expensive option for comprehensive monitoring.
Additionally, recent changes in the licensing model have increased the cost for many users. This can limit the accessibility of SolarWinds SAM for smaller enterprises or those with limited budgets.
Limitations in Templates and Monitoring Capabilities
SolarWinds SAM also exhibits limitations in its monitoring options. Some out-of-the-box templates do not allow users to remove specific components, restricting flexibility in monitoring setups. In addition, the SAM module lacks advanced application performance monitoring (APM) capabilities, which are important for in-depth application insights.
Limitations in Application Mapping Capabilities
SolarWinds SAM has several important limitations related to application dependency mapping:
- Relies on scheduled scans for dependencies, does not update in real time.
- Recommends using SolarWinds Platform agent for best results, although it does support agentless operation.
- Requires credentials of every system monitored to obtain a full picture.
- Core package only monitors certain IT infrastructure: Cisco UCS, Nutanix, VMware hosts, Linux/AIX on-prem, AWS and Azure cloud. Hyper-V scanning is an add-on module priced separately.
- Requires multiple modules for application dependency mapping, or the full Orion Suite Platform which is resource-heavy.
Notable SolarWinds SAM Alternatives
Organizations evaluating SolarWinds SAM often compare it against two distinct groups of tools: dedicated application dependency mapping solutions that focus on discovering and visualizing how systems connect, and broader server and application performance monitoring platforms that track health and performance metrics across the stack.
Application Dependency Mapping Tools
Faddom

Faddom is an agentless application dependency mapping tool that discovers servers and automatically groups them into business applications across on-premises, cloud, and hybrid environments. It builds an initial map within about an hour of deployment and then keeps it updated continuously, 24/7, by reading a copy of network traffic rather than installing agents, supplying server credentials, or changing firewall rules. Because of this approach, all data stays inside the user’s environment and the tool can run offline without network overhead. Beyond mapping, Faddom applies AI-driven correlation to turn raw network data into real-time topology and application context. It supports change management, data center and cloud migration, IT audit and compliance, resource and cost optimization, and cybersecurity use cases.
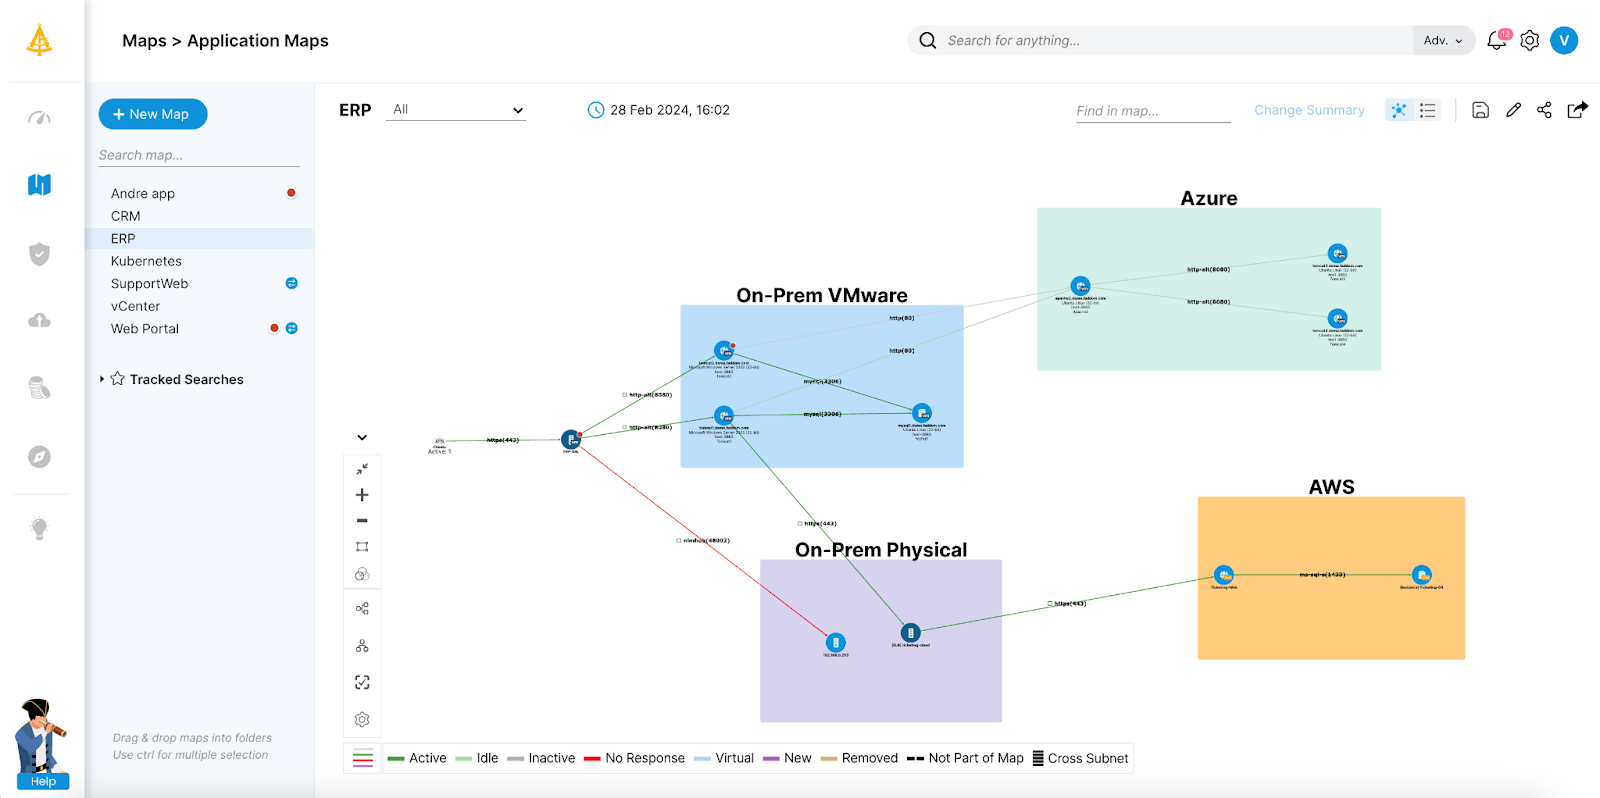
Key features include:
- Agentless, credential-free discovery: Maps servers, applications, and traffic flows by passively reading a copy of network traffic, without installing agents, providing server credentials, or opening firewalls. This keeps all collected data within the environment and allows the tool to operate offline.
- Real-time, continuously updated maps: Produces a first map within roughly 60 minutes of deployment and then refreshes it 24/7 as the environment changes, instead of depending on scheduled scans. Dependency views therefore reflect the current state of the infrastructure.
- Automatic business application grouping: Connects to on-premises, cloud, and hybrid data sources and automatically groups discovered servers into business applications. This provides a single view of how systems and applications relate across the estate.
- Change management and impact analysis: Visualizes dependencies and the impact of proposed changes, and supports wave-based planning for data center and cloud migrations along with resource and cost optimization.
- Security and compliance visibility: Surfaces communication flows and shadow IT for cybersecurity and microsegmentation work, and maintains continuously updated documentation and CMDB-style inventories to support IT audits and compliance.
- AI-driven analysis: Applies AI-based correlation and analysis to convert raw network data into application and dependency context, providing an operational layer for understanding and securing hybrid environments
Limitations (as reported by users on G2):
- Initial onboarding effort: A few users noted that initial deployment and the accompanying documentation took longer than planned, in some cases requiring vendor support to finalize configuration steps.
- Agentless coverage trade-offs: Because mapping relies on observing network traffic and protocols such as SNMP and flow data, some users found that heavily encrypted or tightly segmented network zones can be harder to capture in full detail.
- Focused scope: Some reviewers described it as a focused mapping and visibility tool rather than a full CMDB or AIOps suite, leading certain teams to use it alongside other systems for broader IT management.
Learn more about Faddom by scheduling a call with one of our experts!
2. Device42

Device42, now part of Freshworks, provides application dependency mapping as part of a broader hybrid IT discovery and management platform. Its ADM capability autodiscovers how applications, services, and infrastructure communicate across on-premises, cloud, and virtual environments, then organizes those relationships into Application Groups and Business Services. The mapping data feeds related capabilities in the same platform, including an automated CMDB, infrastructure and cloud discovery, IP address management, software license management, and SSL certificate management. Device42 positions dependency mapping for incident response, change management, modernization, compliance, and migration planning. The platform supports both agent-based and agentless discovery methods.

Key features include:
- Automated service discovery: Discovers active services and the ports they use across machines and instances, identifying which services communicate with which others to reveal inter-service dependencies across on-premises, cloud, and hybrid environments without configuring span ports.
- Application Groups: Automatically groups assets based on observed communication patterns, with Calculation Rules that define group membership using criteria such as service type, server inclusion, and start or end points, plus a timeline view to track changes over time.
- Business Services: Lets teams build a visual representation of how components, devices, and resources combine into business services, either manually or from an Application Group, enriched with metadata such as application type, owners, SLAs, and disaster-recovery details, and exportable as charts.
- Impact Charts and Impact Lists: Generates diagrams and lists showing service connections and how a change or disruption to one device ripples upstream and downstream, including which organizational groups depend on a given device.
- Integrated discovery and CMDB: Ties dependency data to the wider platform, including infrastructure and cloud discovery, an automated CMDB, IPAM, and software license and SSL certificate management, so mapping is maintained alongside asset inventory.
- Configuration data capture: Collects configuration details for major applications such as Oracle, Microsoft SQL, MongoDB, PostgreSQL, MySQL, IIS, and Apache, adding context to discovered components.
Limitations (as reported by users on G2):
- Initial setup complexity: Some users found the platform complex to set up and navigate at first, particularly smaller teams.
- Performance at scale: Several reviewers reported occasional slowdowns when handling very large data volumes or heavy requests.
- Residual manual work: A number of users noted that some tasks still require manual procedures that can be time-consuming.
3. ServiceNow Service Mapping

ServiceNow Service Mapping is a module within ServiceNow IT Operations Management that builds and maintains maps of the relationships between applications, IT components, and cloud services. It generates service maps using machine learning with tag-based, top-down, and traffic-based methods, and stores the results in the ServiceNow CMDB so service data is available to other workflows on the platform. Maps update automatically when a change is detected, and the module provides out-of-the-box discovery and mapping for a range of cloud platforms. Service Mapping is sold as part of ITOM and works alongside ServiceNow Discovery, which provides a view of the operations footprint across on-premises data centers and cloud.
Key features include:
- AI-assisted mapping methods: Generates service maps with machine learning using tag-based, top-down, and traffic-based approaches, giving teams more than one way to construct maps depending on the environment.
- Multicloud discovery and mapping: Provides out-of-the-box discovery and mapping support for a variety of popular cloud platforms, mapping services across dynamic cloud providers.
- Automatic map updates: Updates service maps automatically whenever a change is detected, aiming to keep the relationships between components current without manual rework.
- CMDB integration: Writes mapped service data into the ServiceNow CMDB, creating a service-aware data structure that other ServiceNow workflows and reporting can draw on.
- Service-aware operations: Uses the maps to support diagnosing problems and prioritizing them by business impact, connecting infrastructure relationships to service context.
- Builds on existing discovery: Uses the discovery data and mechanisms already in place across data centers and cloud as part of the broader ITOM offering.
Limitations (as reported by users on PeerSpot):
- Time-consuming to implement: Users reported that setting up Service Mapping is complex and lengthy, and that the effort relative to the benefit can be difficult to justify, sometimes requiring third-party or professional help.
- Customization requires scripting: Several reviewers noted that discovery patterns and mapping for new or non-standard devices often require custom pattern-matching and scripting, and that self-service customization is limited.
- Cost and licensing: Users described the pricing as expensive and asked for more flexible licensing to purchase only the components they need.
- Discovery coverage gaps: Some reviewers said discovery has limits in certain areas and may need third-party integration to cover all devices.
Server and Application Performance Monitoring Tools
4. ManageEngine Applications Manager

ManageEngine Applications Manager is an application and infrastructure monitoring tool that provides visibility across cloud and on-premises applications from a single platform. It covers more than 150 technologies and combines application performance monitoring with server, database, container, cloud, and end-user monitoring. The platform offers both agentless and agent-based options and is aimed at IT and DevOps teams that need to detect and troubleshoot performance issues across the stack. It is available in a Professional edition for small to medium deployments monitoring up to 500 applications, and an Enterprise edition that adds distributed monitoring and failover, scaling up to 10,000 monitors.
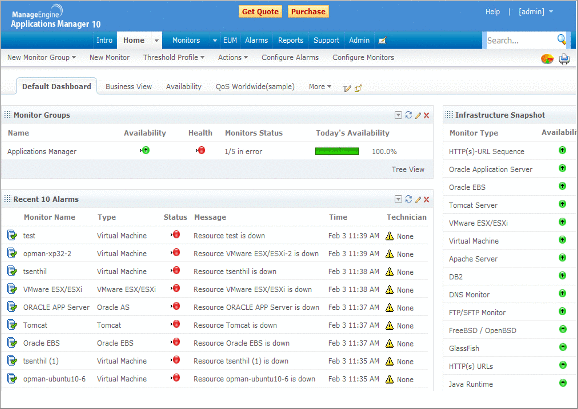
Source: ManageEngine
Key features include:
- Application performance monitoring: Monitors and troubleshoots application performance in development, QA, and production with code-level insights, distributed transaction tracing, and application service maps, supporting Java, .NET, .NET Core, Node.js, Python, PHP, and Ruby applications.
- Server and infrastructure monitoring: Tracks the health and performance of physical, virtual, and cloud servers to prevent downtime and support capacity planning, alongside converged infrastructure and virtual machine monitoring.
- Database and middleware monitoring: Provides agentless monitoring for relational, NoSQL, in-memory, and big data stores such as Oracle, SQL Server, MongoDB, and Hadoop, with the ability to drill into and identify slow database calls.
- Cloud and container monitoring: Monitors workloads on AWS, Azure, GCP, Oracle Cloud, and OpenStack, and the performance of Docker, Kubernetes, and Red Hat OpenShift containers.
- Automated discovery and dependency mapping: Automatically discovers applications and infrastructure components as they are added and maps application tiers, updating live dependencies as the environment changes to help trace the root cause of incidents.
- End-user and synthetic monitoring: Includes website monitoring, Selenium-based synthetic transaction monitoring from multiple locations, and real user monitoring that breaks performance down by geography, browser, device type, and ISP.
- Smart alerts and reporting: Offers static and dynamic thresholds with anomaly detection, alerts via email, text, or Slack, ML-based trend forecasting, and over 500 prebuilt reports with custom dashboards.
Limitations (as reported by users on G2):
- Dated interface in places: Some users felt that certain modules retain legacy UI elements and that the interface can feel cluttered or inconsistent compared with newer tools.
- Setup effort for complex environments: Several reviewers noted that configuring large or complex setups, such as clustered databases or Kubernetes, can be time-consuming and lacks guided wizards.
- Limited third-party integrations: A number of users said integration with some external tools is more limited than competing platforms.
- Tiering and alert tuning: Some reviewers reported that advanced features require higher licensing tiers and that alerting can be noisy until thresholds are fine-tuned.
5. PRTG Network Monitor

Paessler PRTG is an all-in-one infrastructure monitoring tool that uses configurable sensors to monitor networks, servers, applications, databases, cloud services, and traffic from a single installation. Each sensor measures one aspect of a device, such as CPU load, disk space, a port, or an SQL query, and licensing is based on the number of sensors in use. PRTG provides web, desktop, and mobile interfaces, real-time maps and dashboards, and built-in alerting. It is available as the on-premises PRTG Network Monitor, the larger PRTG Enterprise Monitor for bigger environments, and the SaaS-based PRTG Hosted Monitor.
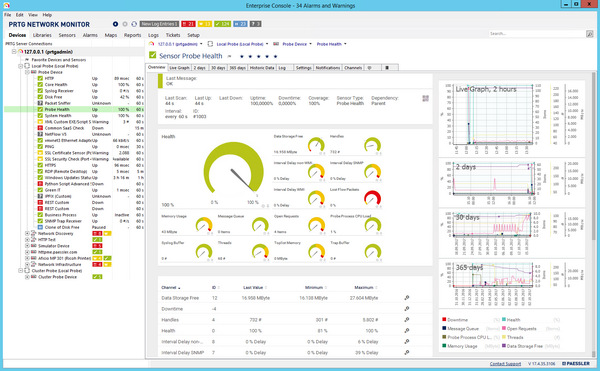
Source: Paessler
Key features include:
- Sensor-based monitoring across the stack: Monitors networks, servers, applications, databases, cloud services, LAN, and SNMP devices using individually configured sensors, where each sensor tracks a single metric such as a port, process, or SQL query.
- Server and application monitoring: Tracks servers in real time for availability, accessibility, capacity, and reliability, and collects detailed statistics on the applications running across the network.
- Maps and dashboards: Provides real-time network maps with live status information and a map designer for building custom dashboards that visualize the environment.
- Alerts and notifications: Sends alerts when problems or unusual metrics occur, with custom thresholds and built-in notification methods including email, push, and HTTP requests.
- Multiple interfaces and distributed monitoring: Offers a web interface, a desktop app for editing many monitoring objects at once, iOS and Android apps for monitoring on the go, and distributed monitoring with customizable reporting.
- Extensibility: Lets users extend functionality through the HTTP API and custom sensors for metrics not covered out of the box.
Limitations (as reported by users on G2):
- Sensor-based cost at scale: Several users noted that licensing tied to sensor count can become costly and complicate scaling as more metrics and devices are monitored.
- Setup of complex environments: Some reviewers found the initial configuration of large or complex infrastructures overwhelming.
- Advanced customization skill: A number of users said custom sensors, scripts, and advanced alerting require deeper technical knowledge, and that customization can feel oriented toward Windows environments.
- Reporting and data tuning: Some reviewers described the reporting as overly technical and the historical data retention settings as unintuitive.
6. Datadog Infrastructure Monitoring

Datadog Infrastructure Monitoring is a SaaS-based component of the broader Datadog observability platform that provides metrics, visualizations, and alerting for cloud, hybrid, on-premises, edge, and multi-cloud environments. It deploys through an agent and vendor-backed integrations for Kubernetes, serverless platforms, and over 900 other technologies, and uses tag-based search and analytics to slice across infrastructure. It tracks tens of thousands of metrics out of the box, retains historical records, and correlates metrics, traces, logs, and security signals in one interface. Infrastructure Monitoring works alongside Datadog’s APM, log management, and cloud security products.

Key features include:
- Broad infrastructure coverage: Monitors on-premises, hybrid, edge, and multi-cloud environments using an agent and vendor-backed integrations for Kubernetes, serverless platforms, and more than 900 technologies.
- Out-of-the-box metrics and history: Collects tens of thousands of infrastructure metrics by default and retains continuous historical records, including for infrastructure that no longer exists.
- Tag-based search and analytics: Uses tags to slice and analyze complex infrastructure, and supports custom metrics and distribution metrics for globally accurate percentiles.
- Cross-signal correlation: Provides one-click correlation of related metrics, traces, logs, and security signals across the stack to support troubleshooting and incident response.
- AIOps and alerting: Applies event correlation to surface issues from the noise and reduce alert fatigue, with alerting available across the platform.
- Cloud security context: Adds continuous configuration checks across cloud accounts, hosts, and containers, support for over 15 compliance frameworks, and a resource inventory that surfaces associated security risks.
Limitations (as reported by users on G2):
- Cost escalation: Many users reported that usage-based pricing across hosts, logs, custom metrics, and data retention can grow quickly and unpredictably as the environment scales.
- Learning curve and breadth: Several reviewers said the wide range of modules can make the interface feel cluttered and overwhelming, especially for new team members.
- Agent setup complexity: Some users found deploying and configuring agents to cover all resources less than straightforward.
- Performance on large dashboards: A number of reviewers noted that the web UI can feel sluggish when navigating large, data-heavy dashboards.
Conclusion
SolarWinds Server & Application Monitor (SAM) provides comprehensive monitoring capabilities aimed at optimizing IT infrastructure efficiency and reliability. It provides real-time performance monitoring, automated application mapping, and advanced alerting.
However, SAM’s limitations, such as complexity in maintenance and scalability challenges, usability issues, and limited customization, have led some organizations to seek alternatives. Faddom stands out as a lightweight, lower cost, yet powerful alternative for application discovery and application dependency mapping.
Learn more about asset documentation and discovery with Faddom or get a free trial today by filling out the for on the sidebar!
See Additional Guides on Key Cybersecurity Topics
Together with our content partners, we have authored in-depth guides on several other topics that can also be useful as you explore the world of cybersecurity.
Device42
Authored by Faddom
- [Guide] Device42: 5 Key Features, Limitations, and Alternatives
- [Guide] Device42 Pricing: The 5 Pricing Tiers Explained – Faddom
- [Product] Faddom | Instant Application Dependency Mapping Tool
API Security
Authored by Radware
- [Guide] API Security: REST vs. SOAP vs. GraphQL & 8 Best Practices
- [Guide] Server-Side Request Forgery: Impact, Examples & Defenses
- [Product] Radware API Abuse Prevention
Application Security
Authored by Radware