What Is ManageEngine Applications Manager?
ManageEngine Applications Manager is an application performance monitoring (APM) solution that helps organizations improve performance and availability of applications and the underlying infrastructure. It provides visibility into the health, performance, and user experience of critical business applications across various environments, including on-premises, cloud, and hybrid setups.
The software supports web applications, servers, databases, cloud services, virtualization platforms, and container technologies. It enables IT teams to detect, diagnose, and resolve application performance issues before they impact business operations.
ManageEngine Applications Manager provides an easy-to-use interface that simplifies the task of managing application performance. It supports proactive monitoring with real-time alerts and automated actions for quick issue resolution.
Table of Contents
Toggle- What Is ManageEngine Applications Manager?
- Key Features of ManageEngine Applications Manager
- What Is ManageEngine Applications Manager?
- Key Features of ManageEngine Applications Manager
- ManageEngine Applications Manager Editions and Pricing
- ManageEngine Applications Manager Limitations
- ManageEngine Applications Manager Alternatives
- Conclusion
- See Additional Guides on Key Cybersecurity Topics
This is part of an extensive series of guides about cybersecurity
Key Features of ManageEngine Applications Manager
ManageEngine Applications Manager offers the following capabilities:
- Application performance monitoring: Allows IT and DevOps teams to troubleshoot and optimize application performance in real time. By providing code-level insights, distributed transaction tracing, and application service maps, it enables quick identification and resolution of performance bottlenecks.
- Real user monitoring (RUM): Analyzes the performance of web applications from the perspective of the end-user. It captures and analyzes every transaction by real users, providing insights into network, front-end, and back-end response times. This allows IT teams to understand how factors such as geographical location, browser type, device type, and internet service providers affect the user experience.
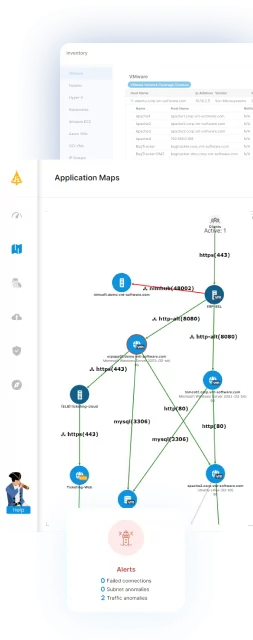
- Automated discovery and dependency mapping: Enables organizations to automatically identify and map the relationships between various applications and services within their IT environment. This feature creates a dynamic, real-time dependency map that visualizes how different components interact with each other.
- Container monitoring: Provides visibility into Docker, Kubernetes, and Red Hat OpenShift container environments. It helps in proactively identifying outages and pinpointing server issues with detailed root cause analysis capabilities. This helps prevent resource overloads.
- Synthetic transaction monitoring: Allows IT teams to simulate user interactions with web applications to test the performance of critical user paths. It uses Selenium for scripting tests, which can be run from real browsers like Chrome and Firefox. By performing checks from multiple locations, including enterprise branch offices or actual customer locations, teams can ensure consistent application performance across all touchpoints.
What Is ManageEngine Applications Manager?
ManageEngine Applications Manager is an application performance monitoring (APM) solution that helps organizations improve performance and availability of applications and the underlying infrastructure. It provides visibility into the health, performance, and user experience of critical business applications across various environments, including on-premises, cloud, and hybrid setups.
The software supports web applications, servers, databases, cloud services, virtualization platforms, and container technologies. It enables IT teams to detect, diagnose, and resolve application performance issues before they impact business operations.
ManageEngine Applications Manager provides an easy-to-use interface that simplifies the task of managing application performance. It supports proactive monitoring with real-time alerts and automated actions for quick issue resolution.
Key Features of ManageEngine Applications Manager
ManageEngine Applications Manager offers the following capabilities:
- Application performance monitoring: Allows IT and DevOps teams to troubleshoot and optimize application performance in real time. By providing code-level insights, distributed transaction tracing, and application service maps, it enables quick identification and resolution of performance bottlenecks.
- Real user monitoring (RUM): Analyzes the performance of web applications from the perspective of the end-user. It captures and analyzes every transaction by real users, providing insights into network, front-end, and back-end response times. This allows IT teams to understand how factors such as geographical location, browser type, device type, and internet service providers affect the user experience.
- Automated discovery and dependency mapping: Enables organizations to automatically identify and map the relationships between various applications and services within their IT environment. This feature creates a dynamic, real-time dependency map that visualizes how different components interact with each other.
- Container monitoring: Provides visibility into Docker, Kubernetes, and Red Hat OpenShift container environments. It helps in proactively identifying outages and pinpointing server issues with detailed root cause analysis capabilities. This helps prevent resource overloads.
- Synthetic transaction monitoring: Allows IT teams to simulate user interactions with web applications to test the performance of critical user paths. It uses Selenium for scripting tests, which can be run from real browsers like Chrome and Firefox. By performing checks from multiple locations, including enterprise branch offices or actual customer locations, teams can ensure consistent application performance across all touchpoints.
ManageEngine Applications Manager Editions and Pricing
ManageEngine Applications Manager is available in three editions: Free, Professional, and Enterprise. Each of the paid editions provides a 30-day free trial, after which they require a 1-year commitment.
Free Edition
- Supports: Up to 5 monitors
- Features: Limited monitoring, alerting, and reporting capabilities
- Cost: Free forever
- Suitable for: Small-scale environments or for users who want to explore the basic features of the application
Professional Edition
- Supports: Up to 500 applications based on load
- Features:
- Application Performance Monitoring (APM): Includes byte-code instrumentation for Java, .NET, .NET core, PHP, Node.js, and Python
- Infrastructure Monitoring: Supports servers, databases (Oracle, MS SQL, MongoDB, Cassandra, etc.), in-memory databases, big data stores, application servers, middleware components, web servers, ERP software, virtual servers, container technologies, and cloud platforms
- End User Experience Monitoring: Agent-based synthetic transaction monitoring and real user monitoring (both as add-ons)
- Alerting & Reporting: Static and adaptive thresholds, root cause analysis, anomaly detection, automated actions, integration with IT helpdesk systems, ChatOps integration, and ML-powered forecast reports
- Integrations: With ManageEngine OpManager, Site24x7, Analytics Plus, and AlarmsOne
- General: Automated application discovery, SLA management, user management, admin actions, dashboards, and business views
- Cost: Starts at $395/year
- Suitable for: Small to medium enterprises needing comprehensive monitoring capabilities
Enterprise Edition
- Supports: Over 500 applications, scalable up to 10,000 monitors with a distributed setup
- Features:
- All features of the Professional Edition
- Distributed Monitoring: High scalability with distributed architecture for large-scale deployments
- Failover/Virtual IP: Ensures high availability and reliability of monitoring services
- Cost: Starts at $9595/year
- Suitable for: Large enterprises requiring extensive and scalable monitoring solutions
ManageEngine Applications Manager Limitations
When evaluating ManageEngine Applications Manager, you should be aware of these limitations, reported by users on the G2 platform.
Data Accuracy Issues
Users have reported occasional inaccuracies in the data provided by ManageEngine Applications Manager. The tool sometimes struggles with accurately displaying endpoint resource details, leading to potential discrepancies in the monitoring data.
Complexity and Usability
The user interface, while functional, might be considered complex for beginners. New users often face a steep learning curve, requiring substantial time to become proficient with all features. Additionally, setting up maps and dashboards can be challenging and not intuitive, and the mobile application has limited functionality compared to the desktop version.
Outdated User Interface
The interface of ManageEngine Applications Manager is seen as outdated and not very user-friendly. Users have noted that the software could benefit from a more modern and attractive design to enhance the overall user experience. The current interface design can make navigation cumbersome, leading to slower response times in addressing performance issues.
Documentation and Notification Issues
Users have reported that the ManageEngine documentation can be difficult to follow and might not provide sufficient detail for effective troubleshooting. In addition, the alerting system may also produce inconsistent notifications, leading to delays or missed critical events, which can affect the reliability of monitoring.
ManageEngine Applications Manager Alternatives
1. Faddom
Faddom visualizes your on-premises and cloud infrastructure in as little as one hour without agents. It maps all your servers and business applications instantly and in real-time, highlighting their interdependencies.
- Faddom is agentless and doesn’t require credentials
- It is cheap, starting at $10K/year
- Map the entire environment in real-time, updating 24/7
- Quick: One person can map the entire organization in an hour
Learn more about Faddom or start a free trial to the right
Source: Faddom
2. New Relic APM
New Relic APM is an application performance monitoring tool designed to prevent issues before they occur by providing a view of telemetry across your entire stack. It offers detailed insights into application health, performance, and user interactions.
Key features:
- Health insights: Provides at-a-glance health metrics for every development stage and part of the stack, ensuring you can quickly assess the status of your applications.
- Full-stack performance view: Offers code-level insights from logs to infrastructure, allowing you to identify root causes of issues with just a few clicks.
- Real-time user insights: Tracks key transactions, performs browser monitoring, and conducts synthetic checks to deliver real-time insights into user interactions.
- Elimination of blind spots: Addresses monitoring gaps, including uninstrumented services, missing alerts, and vulnerabilities, ensuring complete visibility.
- Dashboard: Monitors golden metrics, visualizes dependencies, and identifies issues with alerts and error tracking to maintain optimal application performance.
Source: New Relic
3. LogicMonitor
LogicMonitor APM is an observability solution tailored for modern applications, integrating traces, metrics, and synthetic monitoring. It allows IT and DevOps teams to track user performance, detect application latency, and identify bottlenecks across hybrid and multi-cloud environments.
Key features:
- Smart troubleshooting: Utilizes distributed end-to-end tracing to solve complex, critical application issues quickly.
- Application resiliency: Tracks application performance against business outcomes with proactive workflows, uncovering actionable insights to prevent downtime and enhance reliability.
- Collaboration: Offers a unified observability platform for ITOps and DevOps, eliminating silos and fostering better collaboration. Built on OpenTelemetry and OpenMetrics standards for a vendor-neutral approach to digital transformation.
- Real-time insights: Delivers deep, real-time insights into the complexity of distributed, cloud-native applications. Automatically maps and visualizes relationships between microservices and application components for faster troubleshooting.
- Proactive monitoring: Features intelligent alerting with dynamic thresholds to prevent outages and reduce alert fatigue. Enables proactive issue identification through multi-step synthetic transactions before impacting users.
Source: LogicMonitor
4. Site24x7
Site24x7 is an AI-powered application performance monitoring tool that tracks the performance of applications in real time. The tool provides a 360-degree view of application health, leveraging artificial intelligence to monitor key metrics.
Key features:
- Distributed tracing: Uses distributed tracing to improve user experience by monitoring transactions across microservices. It reduces detection and resolution times while identifying bottlenecks affecting user experience.
- Contextual debugging: Offers a holistic view of application architecture for better understanding external dependencies. This feature helps in identifying component failures and debugging errors at the method level.
- Key metrics: Tracks performance of critical transactions and custom components. It allows grouping of key metrics on custom dashboards, enabling contextual issue debugging.
- AI-powered troubleshooting: Uses machine learning for anomaly detection and efficient troubleshooting. This helps maintain SLAs by reducing outages through prioritized alert filtering.
- Comprehensive view: Integrates APM with real user monitoring for a unified performance perspective from both frontend and backend views. It provides insights into front-end optimizations to improve application performance.
Source: Site24x7
5. PRTG
PRTG is an application monitoring tool developed by Paessler that enables IT professionals to identify and resolve performance issues across various applications and infrastructure components. It offers monitoring capabilities for server, web, cloud, and virtualized applications. It is compatible with standard enterprise applications like ERP systems and SAP.
Key features:
- Monitoring: Monitors a range of applications including server, cloud, web, and virtualized apps, tracking availability and performance.
- Real-time alerts & notifications: Configurable thresholds for application performance metrics with immediate notifications for potential issues. Helps in efficient resource utilization and avoiding network disruptions.
- Custom alerts and data visualizations: Simplifies the task of monitoring by providing custom alerts and visual data representations. Aids in identifying status errors and unresponsive applications swiftly.
- Extensive customization: Offers the ability to create custom sensors for specific needs. Uses a library of predefined PRTG sensors for customized monitoring solutions.
- Unified view: Provides a single dashboard view for all networked applications. This includes hardware-based apps to virtual systems.
- Compatibility with major vendors: Works seamlessly with all major vendors, products, and systems ensuring broad monitoring coverage across the IT infrastructure.
Source: Paessler
Related content: Read our guide to ManageEngine alternatives
Conclusion
ManageEngine Applications Manager is a robust tool that offers extensive capabilities for monitoring and managing application performance across diverse environments. Despite its comprehensive feature set, potential users should be mindful of certain limitations such as data accuracy issues and a potentially steep learning curve. The choice of APM solution should be based on a thorough assessment of organizational needs and a clear strategy for addressing its known challenges.
Learn more about Faddom for resource and cost optimization or start a free trial today!
See Additional Guides on Key Cybersecurity Topics
Together with our content partners, we have authored in-depth guides on several other topics that can also be useful as you explore the world of cybersecurity.
Solarwinds SAM
Authored by Faddom
- [Guide] SolarWinds SAM: Key Features,Pricing, Limitations, and Alternatives
- [Guide] PRTG Network Monitor vs. SolarWinds: 4 Key Differences and How to Choose
Device42
Authored by Faddom
- [Guide] Device42: 5 Key Features, Limitations, and Alternatives
- [Guide] Device42 Pricing: The 5 Pricing Tiers Explained – Faddom
- [Product] Faddom | Instant Application Dependency Mapping Tool
API Security
Authored by Radware


