What Is PRTG Network Monitor?
PRTG Network Monitor is a network monitoring tool that provides visibility across an entire IT infrastructure. Developed by Paessler AG, it supports monitoring of network performance, bandwidth, and hardware health, making it a versatile tool for IT administrators.
Users can configure a range of sensors to track KPIs and receive alerts on network anomalies, ensuring proactive management of resources. PRTG is known for its easy setup and intuitive interface, allowing users to quickly deploy and begin monitoring activities.
The solution supports various protocols, including SNMP, WMI, and NetFlow, providing compatibility with a wide range of devices. Its flexibility and reporting capabilities make it a popular choice for enterprises looking for an all-in-one monitoring solution.
Editor’s note: Updated information for PRTG Network Monitor and alternative solutions to reflect features and capabilities in 2026, added details on PRTG architecture, and added three more competitors.
Key Features of PRTG Network Monitor
Here are some of the key features that make PRTG a useful tool for maintaining efficient and reliable network operations:
- Automatic network discovery: Automatically scans and discovers devices in the network, applying preconfigured device templates to speed up deployment and sensor setup.
- 24/7 monitoring of core metrics: Continuously monitors availability, bandwidth, usage, and device health to ensure network performance and uptime.
- Preconfigured sensors for major vendors: Includes built-in sensors tailored to devices from popular manufacturers, simplifying configuration and ensuring broad compatibility.
- Traffic and bandwidth analysis: Identifies which applications, connections, and data types generate the most network load to support capacity planning and troubleshooting.
- Centralized management console: Provides a single pane of glass for monitoring the entire IT infrastructure from one interface.
- Flexible deployment options: Supports on-premises monitoring with full data control or cloud-based hosting managed by Paessler.
- Cluster and failover support: Offers built-in cluster functionality with a failover node to maintain monitoring continuity.
- Distributed monitoring: Enables monitoring of remote sites and branch offices from a central system.
- Multi-language interface: Supports multiple languages, including English, German, Spanish, French, Portuguese, Dutch, Russian, Japanese, and Simplified Chinese.
- Multi-method data collection: Supports common network monitoring methods such as SNMP, packet sniffing, and flow-based technologies.
How PRTG Network Monitor Works
PRTG uses a centralized architecture made up of a core server and one or more probes. The core server handles configuration, stores monitoring data, and provides the web interface. Probes are responsible for collecting data from devices and systems across the network.
Monitoring in PRTG is built around sensors. Sensors are the basic monitoring units. Each sensor tracks a specific metric or aspect of a device, such as uptime, CPU load, bandwidth usage, temperature, or database requests. You assign sensors to devices based on what you want to measure.
PRTG gathers data in two main ways:
- Actively polling devices at regular intervals. This means it queries devices for status information, resource usage, or performance metrics. It can also collect data through methods such as HTTP or HTTPS requests, port checks, email checks, FTP downloads, and database queries.
- Passively receiving data. Devices and applications can send information such as SNMP traps, Syslog messages, flow data, or event logs. This allows PRTG to capture unexpected events and detailed traffic information without constantly querying the device.
PRTG includes hundreds of built-in sensors. Some are preconfigured for common monitoring tasks, while others are more generic. Users can also create custom sensors or use scripts to return application-specific data.
PRTG retrieves monitoring data through standard protocols. These include Ping and SNMP for general device status, HTTP and HTTPS for web services, POP3, IMAP, and SMTP for email services, and WMI for Windows systems. For bandwidth analysis, it supports flow technologies such as NetFlow, jFlow, sFlow, and IPFIX, as well as packet sniffing and SNMP. It can also use SSH, SOAP, and scripts such as PowerShell or Python to gather hardware and system data.
Why Consider Alternatives to PRTG Network Monitor?
PRTG Network Monitor is a powerful tool for tracking network health and performance, but it has limitations that may impact certain organizations:
- High cost: Licensing and ongoing support costs for PRTG can be high, particularly for organizations with limited budgets, making it challenging to justify for smaller IT teams.
- Customization time requirements: To tailor PRTG to more unique needs, significant time and effort are often required for setup and customization, potentially consuming extensive man hours.
- Limited multi-device and ip management: PRTG struggles with managing devices with multiple IPs or those that change locations frequently, which can hinder accurate device tracking and data consistency.
- Slower alerting response time: Users report delays in PRTG’s alerting response, which can affect the tool’s effectiveness for real-time monitoring and quick troubleshooting.
- Complex and limited dashboard options: While customizable, the dashboard interface can feel cluttered and less intuitive, potentially making data visualization and analysis more challenging for some users.
- Restrictive historical data options: The default historical data intervals are limited, with options for live, 2-day, or 30-day views, which may not meet every organization’s reporting needs.
- Performance issues with the web interface: Some users experience slow load times in the web interface, especially when moving quickly between different monitors or metrics.
- Limited auto-upgrade for agents: The desktop agent doesn’t automatically upgrade alongside server updates, requiring manual intervention to ensure consistency across the system.
- False alerts with high bandwidth usage: Under certain conditions, like high bandwidth over MPLS networks, PRTG may issue false alerts indicating that equipment is down when it is not, affecting monitoring reliability.
Notable Alternatives to PRTG Network Monitor
Application Dependency and Topology Mapping Specialists
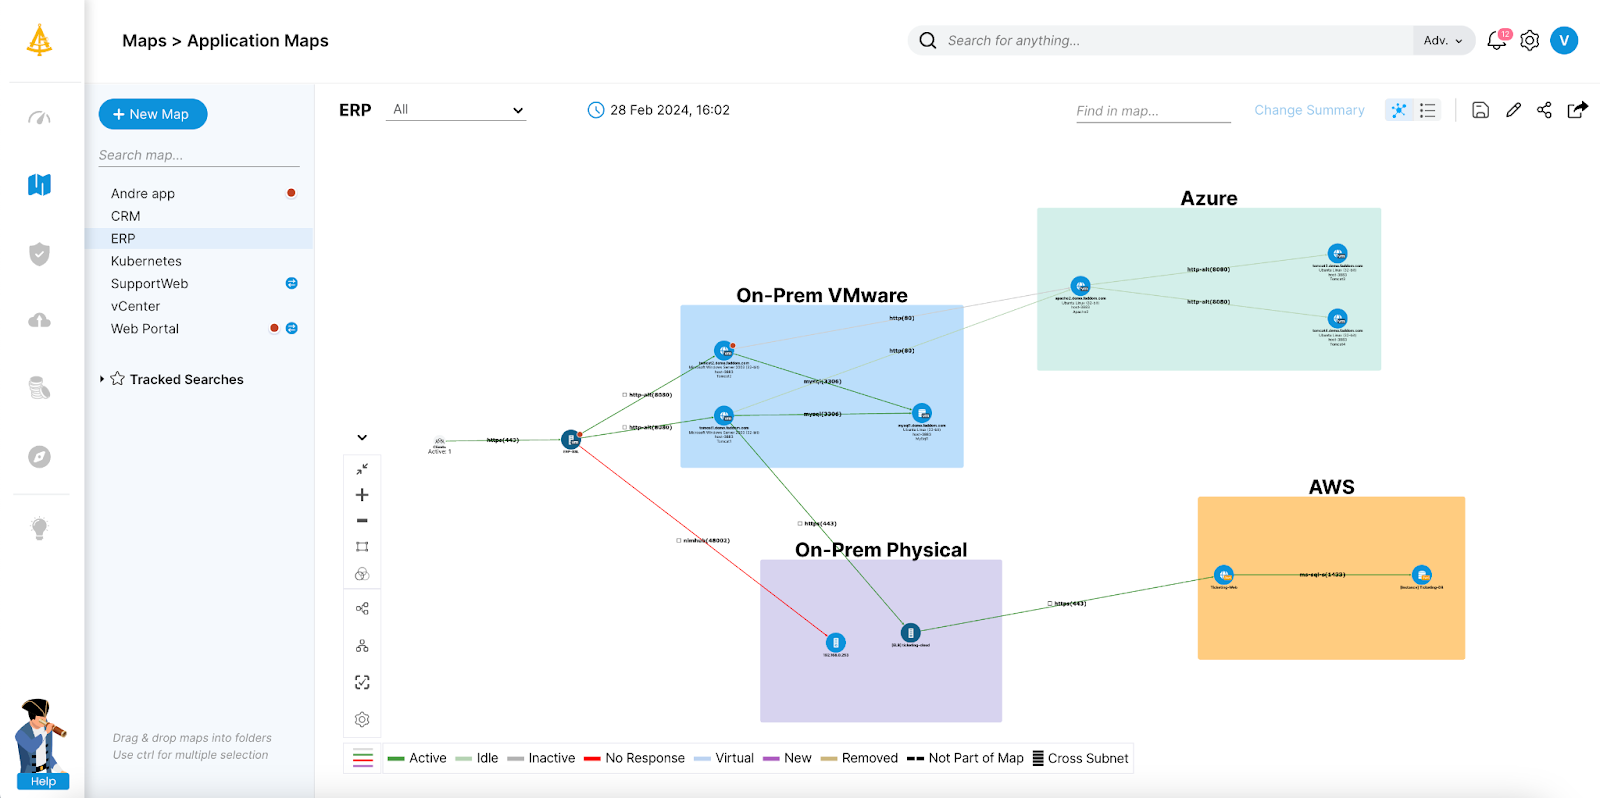
1. Faddom

Faddom is a lightweight application dependency mapping tool. It allows you to map all your servers into the business app they support in less than 60 minutes. It is agentless, it doesn’t require any credentials, and it’s very affordable, starting at $10K/year.
Key features:
- Hybrid Mapping: Supports all IT resources, on-premises and in the cloud, including KVM, AWS, Azure, Google Cloud, and Oracle Cloud.
- Real-time mapping: Faddom maps the entire environment in real-time, updating 24/7
- Easy deployment: Automated lightweight deployment, takes less than 60 minutes
2. Device42
![]()
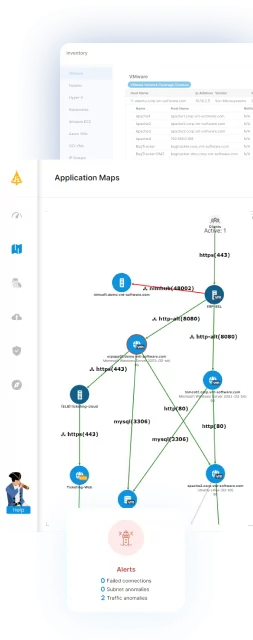
Device42 is an IT asset management and dependency mapping platform to provide visibility into application, service, and infrastructure relationships across hybrid and multi-cloud environments. It focuses on mapping business services to the underlying devices and resources that support them, helping teams understand dependencies, support audits, and improve incident response and change management processes.
Key features of Device42:
- Application dependency mapping: Visualizes relationships between applications, services, and infrastructure components to clarify upstream and downstream dependencies.
- Business service modeling: Builds visual representations of business services, including associated devices, connections, metadata, owners, and SLAs.
- Hybrid and multi-cloud visibility: Maps dependencies across on-premises and cloud environments to provide a unified architectural view.
- Impact analysis tools: Provides impact charts and lists to assess how outages or changes affect related systems and services.
- Automated service discovery: Identifies and maps services and their interactions to maintain up-to-date documentation.
- Compliance and audit support: Supports audit preparation by exposing cross-environment communication and maintaining clear documentation of service relationships.
Source: Device42
3. Dynatrace Smartscape
![]()
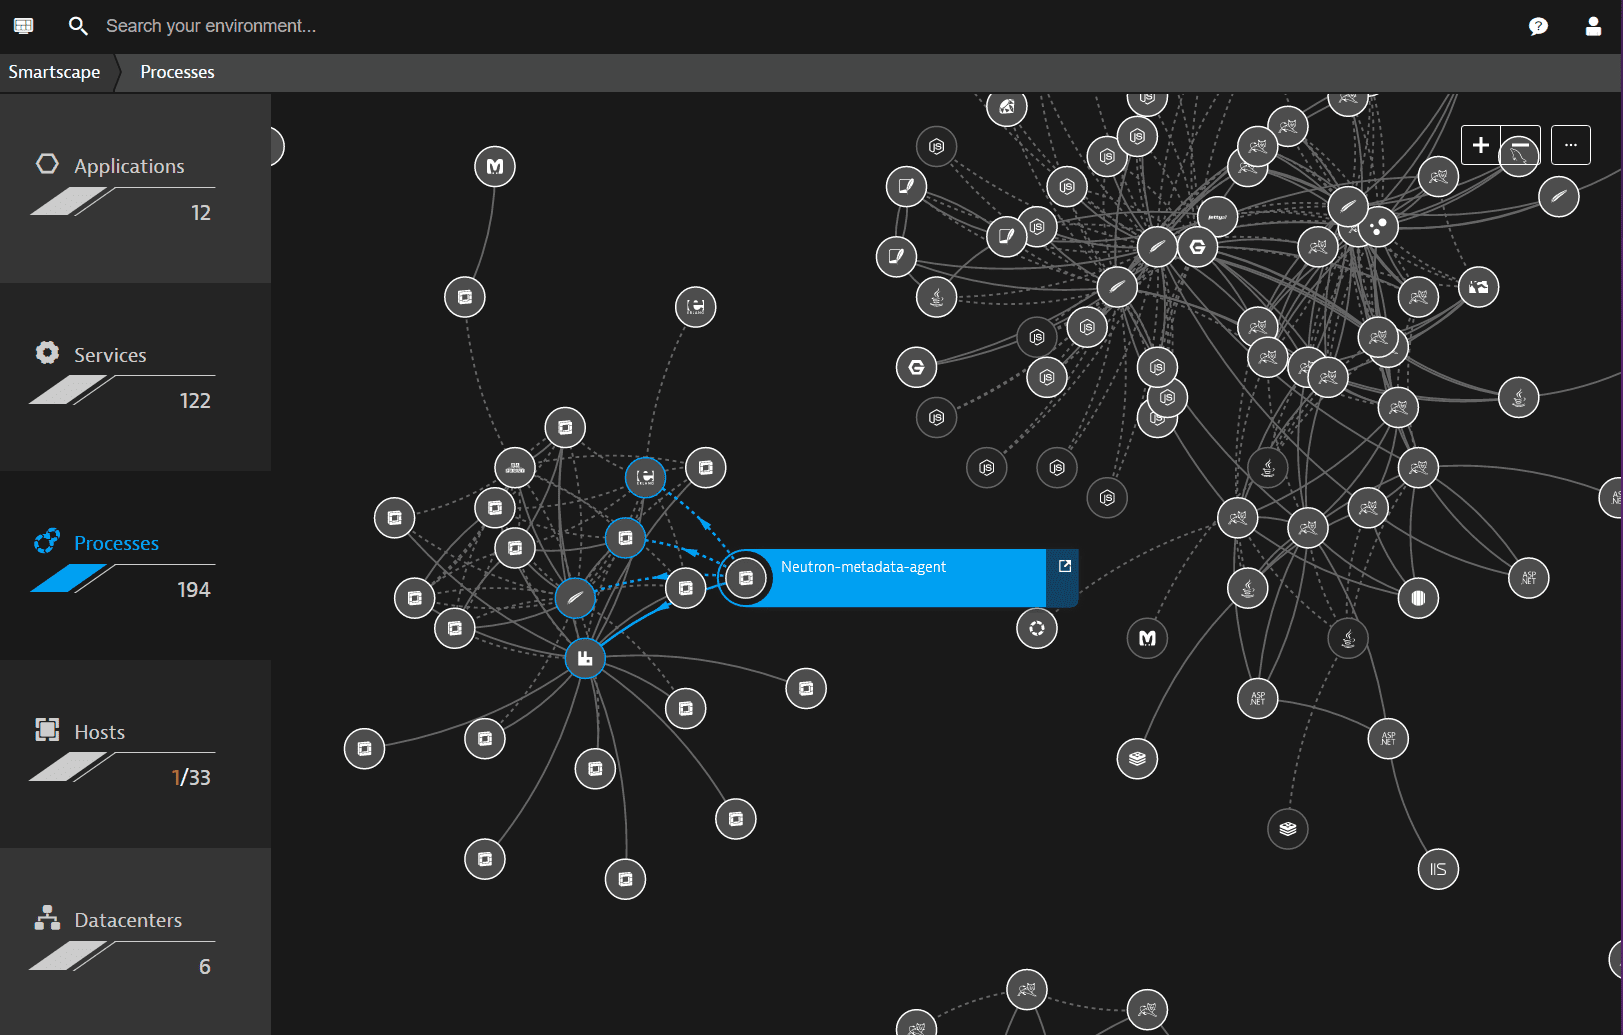
Dynatrace Smartscape is a dependency mapping and topology visualization capability within the Dynatrace platform. It automatically builds and updates a live topology graph of infrastructure, applications, services, and cloud environments, providing contextual insights to support root cause analysis, incident response, and operational automation.
Key features of Dynatrace Smartscape:
- Real-time dependency graph: Automatically maps relationships across infrastructure, services, Kubernetes objects, and cloud resources, continuously updating as the environment changes.
- Full-stack topology visibility: Provides views across multicloud and on-premises environments, from infrastructure layers to applications.
- Automatic topology updates: Maintains always-accurate maps without manual tagging or upkeep.
- Context for root cause analysis: Identifies upstream and downstream dependencies, blast radius, and ownership to accelerate incident resolution.
- Kubernetes-aware mapping: Displays Kubernetes clusters, namespaces, workloads, and services with contextual relationships.
- Security and exposure visualization: Highlights security exposure and misconfigurations within topology context to support targeted remediation.

Source: Dynatrace
Network and Infrastructure Monitoring Platforms
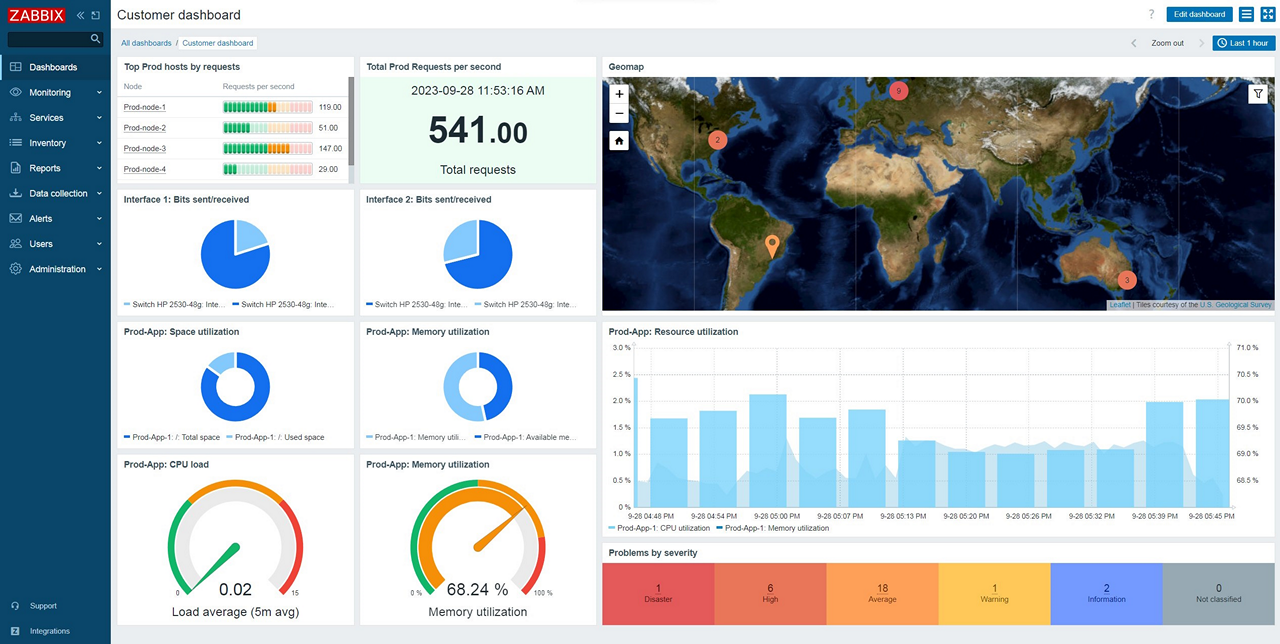
4. Zabbix

Zabbix is an open-source observability and monitoring platform to provide unified visibility across IT and OT environments. It supports deployment on-premises, in the cloud, or within third-party cloud environments, and is built to monitor networks, servers, cloud services, and IoT infrastructure through a centralized interface.
Key features of Zabbix:
- Open-source monitoring platform: Provides full access to source code with no license fees or per-device charges.
- Unified observability: Monitors cloud, networks, services, IoT, and on-premises infrastructure from a single pane of glass.
- Flexible deployment options: Available for on-premises deployment, managed cloud hosting, or third-party cloud environments.
- Scalable architecture: Designed for enterprise scalability and long-term growth across distributed environments.
- Enterprise-grade security: Built with security and compliance considerations to support regulated industries.
- Extensive integration ecosystem: Integrates with external systems and tools to extend monitoring and automation capabilities.

Source: Zabbix
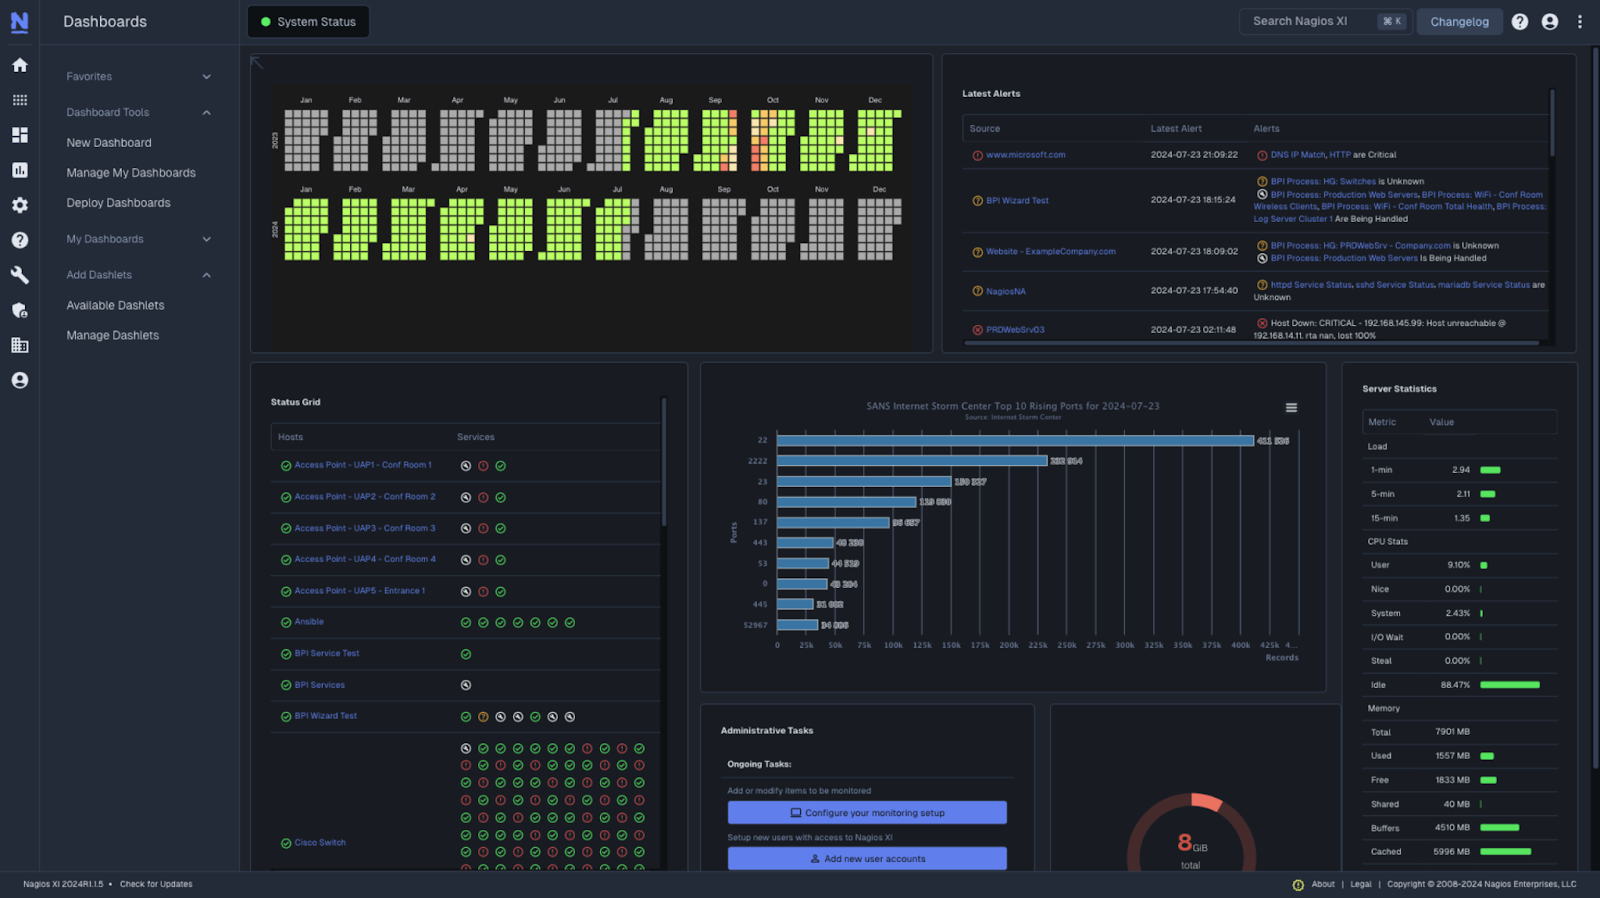
5. Nagios XI

Nagios XI is an enterprise IT infrastructure monitoring platform built on the Nagios Core engine. It provides centralized monitoring for servers, network devices, applications, virtual environments, and cloud infrastructure, with support for alerting, reporting, and automation to help IT teams maintain availability and performance across complex environments.
Key features of Nagios XI:
- Infrastructure monitoring: Monitors Windows, Linux, VMware, Hyper-V, network devices, applications, databases, and cloud workloads from a single dashboard.
- Customizable dashboards and views: Offers configurable dashboards with graphs, gauges, maps, and status summaries, along with role-based access to monitoring views.
- Event-driven remediation: Supports automated execution of scripts and predefined actions when state changes occur to reduce manual intervention.
- Multi-channel alerting and escalation: Provides notifications via email, SMS, Slack, Microsoft Teams, and other channels, with configurable escalation policies.
- Capacity planning and SLA reporting: Includes trending, forecasting, and availability reporting tools to support capacity planning and SLA tracking.
- On-premises deployment and access control: Enables control of monitoring data with role-based permissions, audit logs, and support for LDAP, Active Directory, SSO, and two-factor authentication.
Source: Nagios
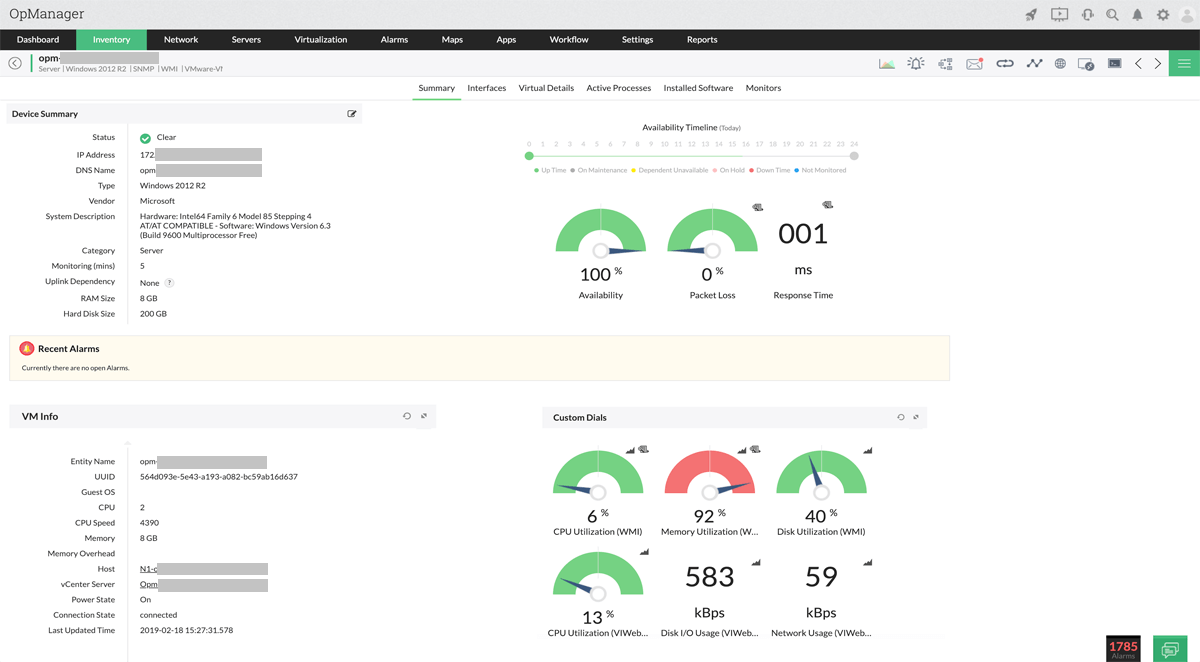
6. ManageEngine OpManager

ManageEngine OpManager is a network and server monitoring platform that provides visibility into performance, availability, and health across distributed IT environments. It supports monitoring of routers, switches, firewalls, servers, virtual machines, wireless devices, and storage systems, with centralized dashboards and distributed architecture for multi-site environments.
Key features of ManageEngine OpManager:
- In-depth network monitoring: Provides visibility into device health, availability, and performance for IP-based devices.
- Physical and virtual server monitoring: Supports monitoring of platforms such as VMware, Hyper-V, Citrix, Xen, and Nutanix HCI.
- Wireless and WAN monitoring: Tracks wireless access points and WAN link performance, including Cisco IPSLA-based monitoring.
- Distributed probe architecture: Uses a probe-central architecture to monitor geographically distributed networks from a single console.
- Network visualization tools: Offers Layer 2 maps, topology maps, business views, and data center rack and floor views.
- Fault management and alerting: Correlates network events, filters noise, and generates severity-based alerts with email and SMS notifications.
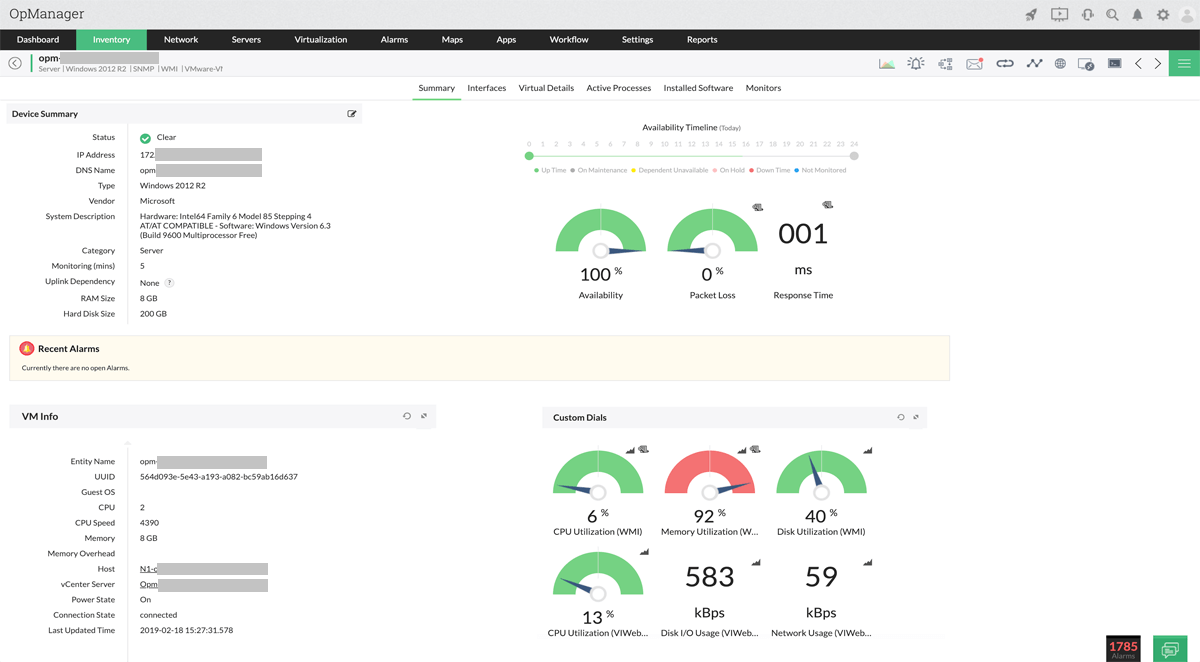
Source: ManageEngine
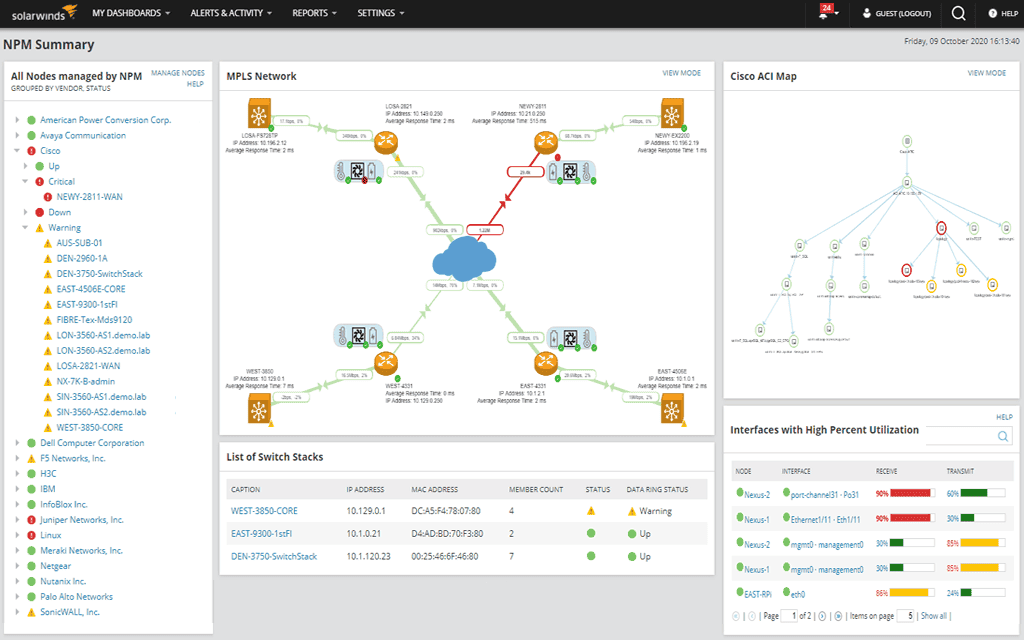
7. SolarWinds Network Performance Monitor

SolarWinds Network Performance Monitor (NPM) is a network monitoring system to provide visibility into device performance, application traffic, and network availability across on-premises, cloud, and hybrid environments. Built on the SolarWinds Platform, NPM combines automated discovery, topology mapping, and performance analytics to support troubleshooting and capacity planning.
Key features of SolarWinds Network Performance Monitor:
- Automated network discovery: Uses a network device scanner to automatically detect and onboard devices for monitoring.
- End-to-end topology mapping: Visualizes connections between devices, applications, and services to improve visibility and troubleshooting.
- NetPath™ hop-by-hop analysis: Provides path analysis across on-premises and cloud environments to identify latency and bottlenecks.
- PerfStack™ performance correlation: Enables drag-and-drop correlation of multiple performance metrics on a unified timeline for root cause analysis.
- Intelligent alerting and baselining: Uses historical data to establish performance baselines and trigger alerts based on deviations or threshold breaches.
- Wireless monitoring integration: Monitors wired and wireless devices within a single platform, including Wi-Fi performance and connectivity updates.
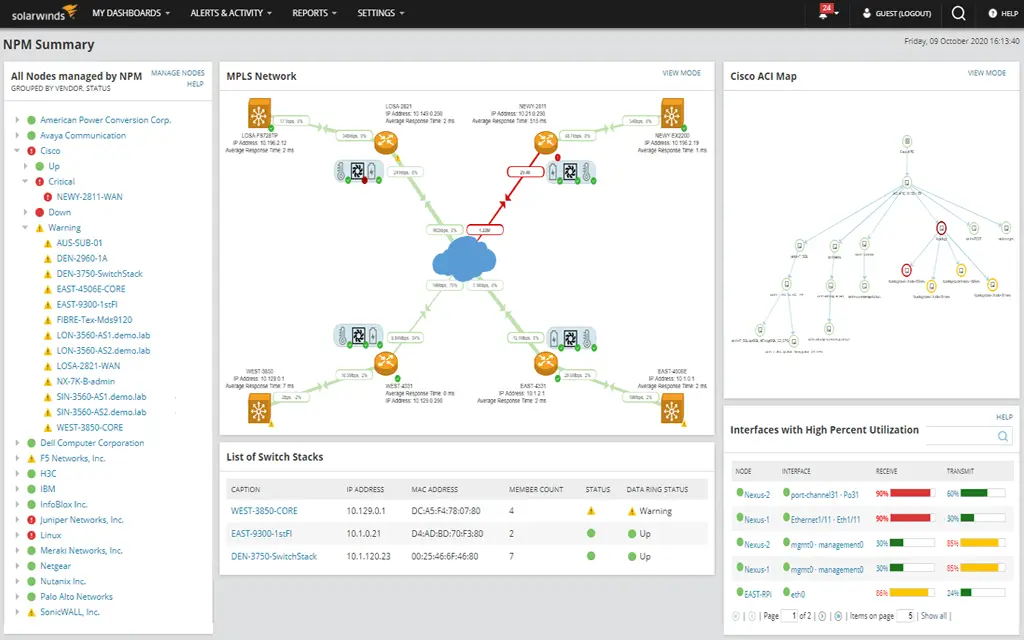
Source: SolarWinds
Learn more in our detailed guide to PTRG network monitor vs SolarWinds
8. LogicMonitor

LogicMonitor is a cloud-based observability platform that provides infrastructure and network monitoring across hybrid and multi-cloud environments. It delivers visibility into dynamic IT landscapes through automated discovery, extensive integrations, and AI-driven analytics for incident detection and resolution.
Key features of LogicMonitor:
- Hybrid infrastructure monitoring: Provides contextual visibility across on-premises data centers and cloud platforms such as AWS, Azure, and GCP.
- Extensive integration library: Supports thousands of out-of-the-box integrations for network devices, cloud services, and applications.
- Unified event intelligence: Correlates alerts and events to reduce noise and streamline troubleshooting workflows.
- Log analytics integration: Correlates logs with performance metrics and alerts within a unified console.
- Collector-based architecture: Enables rapid deployment and visibility across hybrid environments.
- AI-assisted operations: Incorporates AI-driven insights to assist with root cause analysis and incident prioritization.
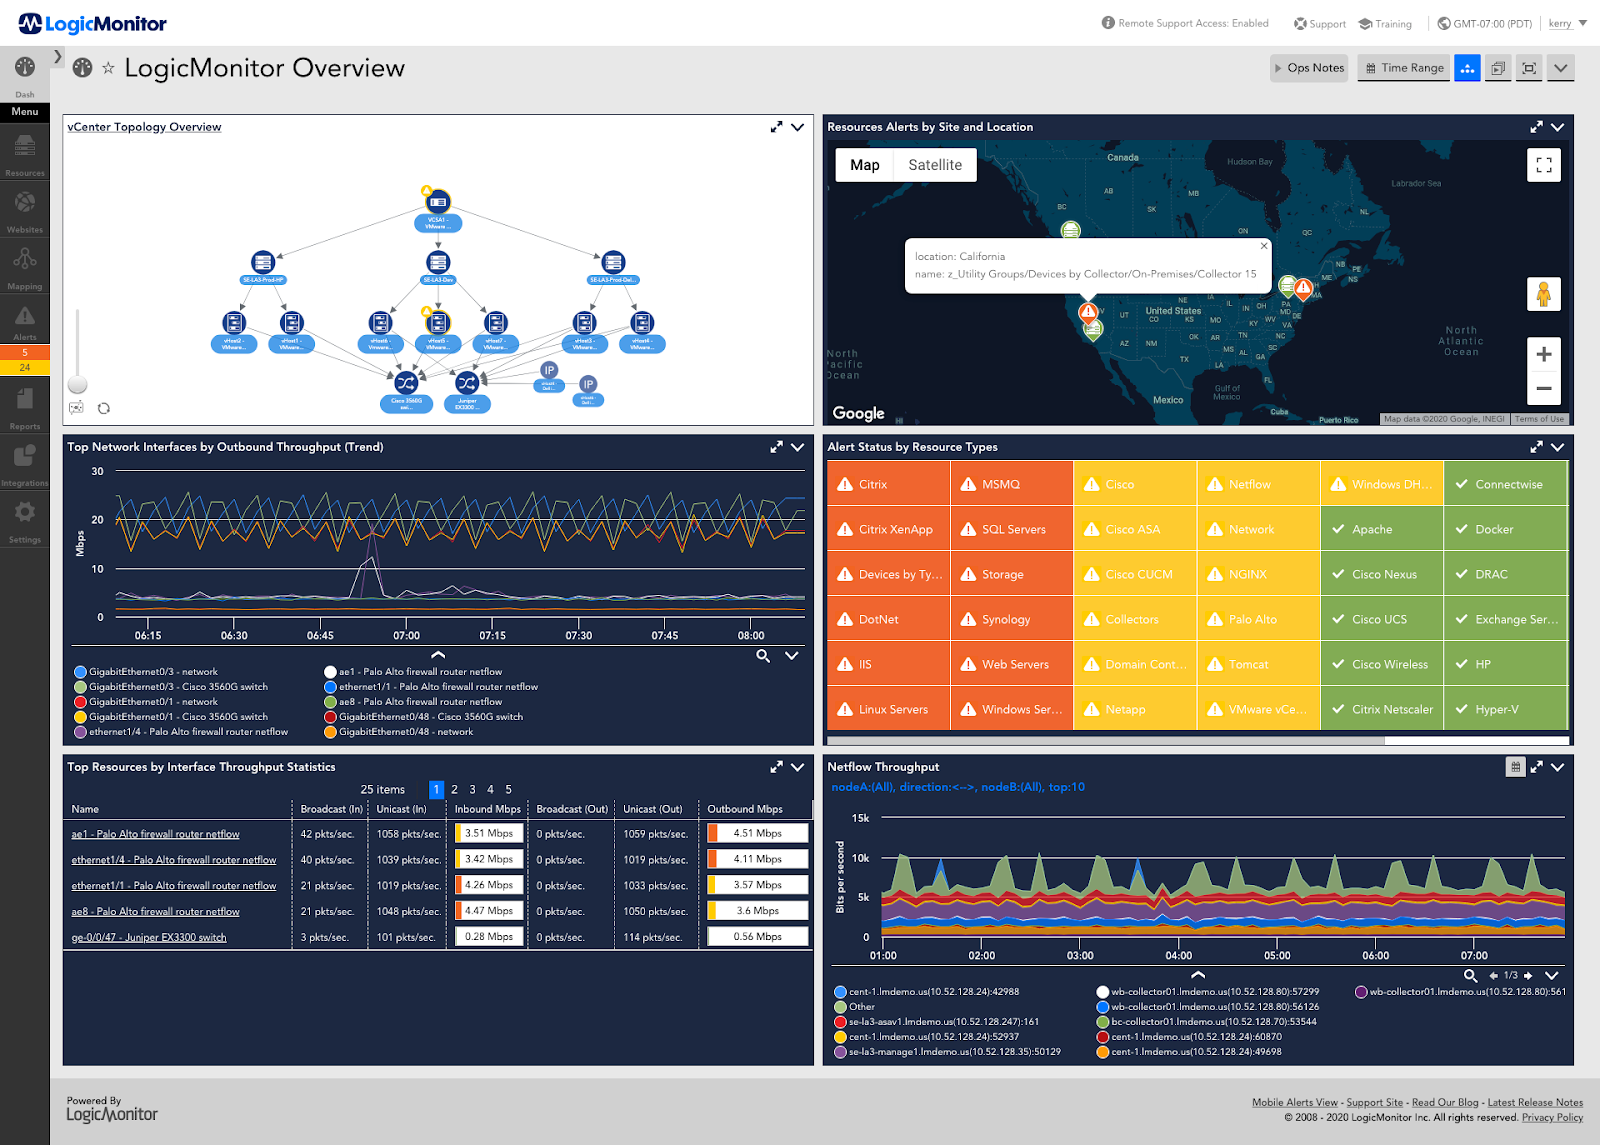
Source: LogicMonitor
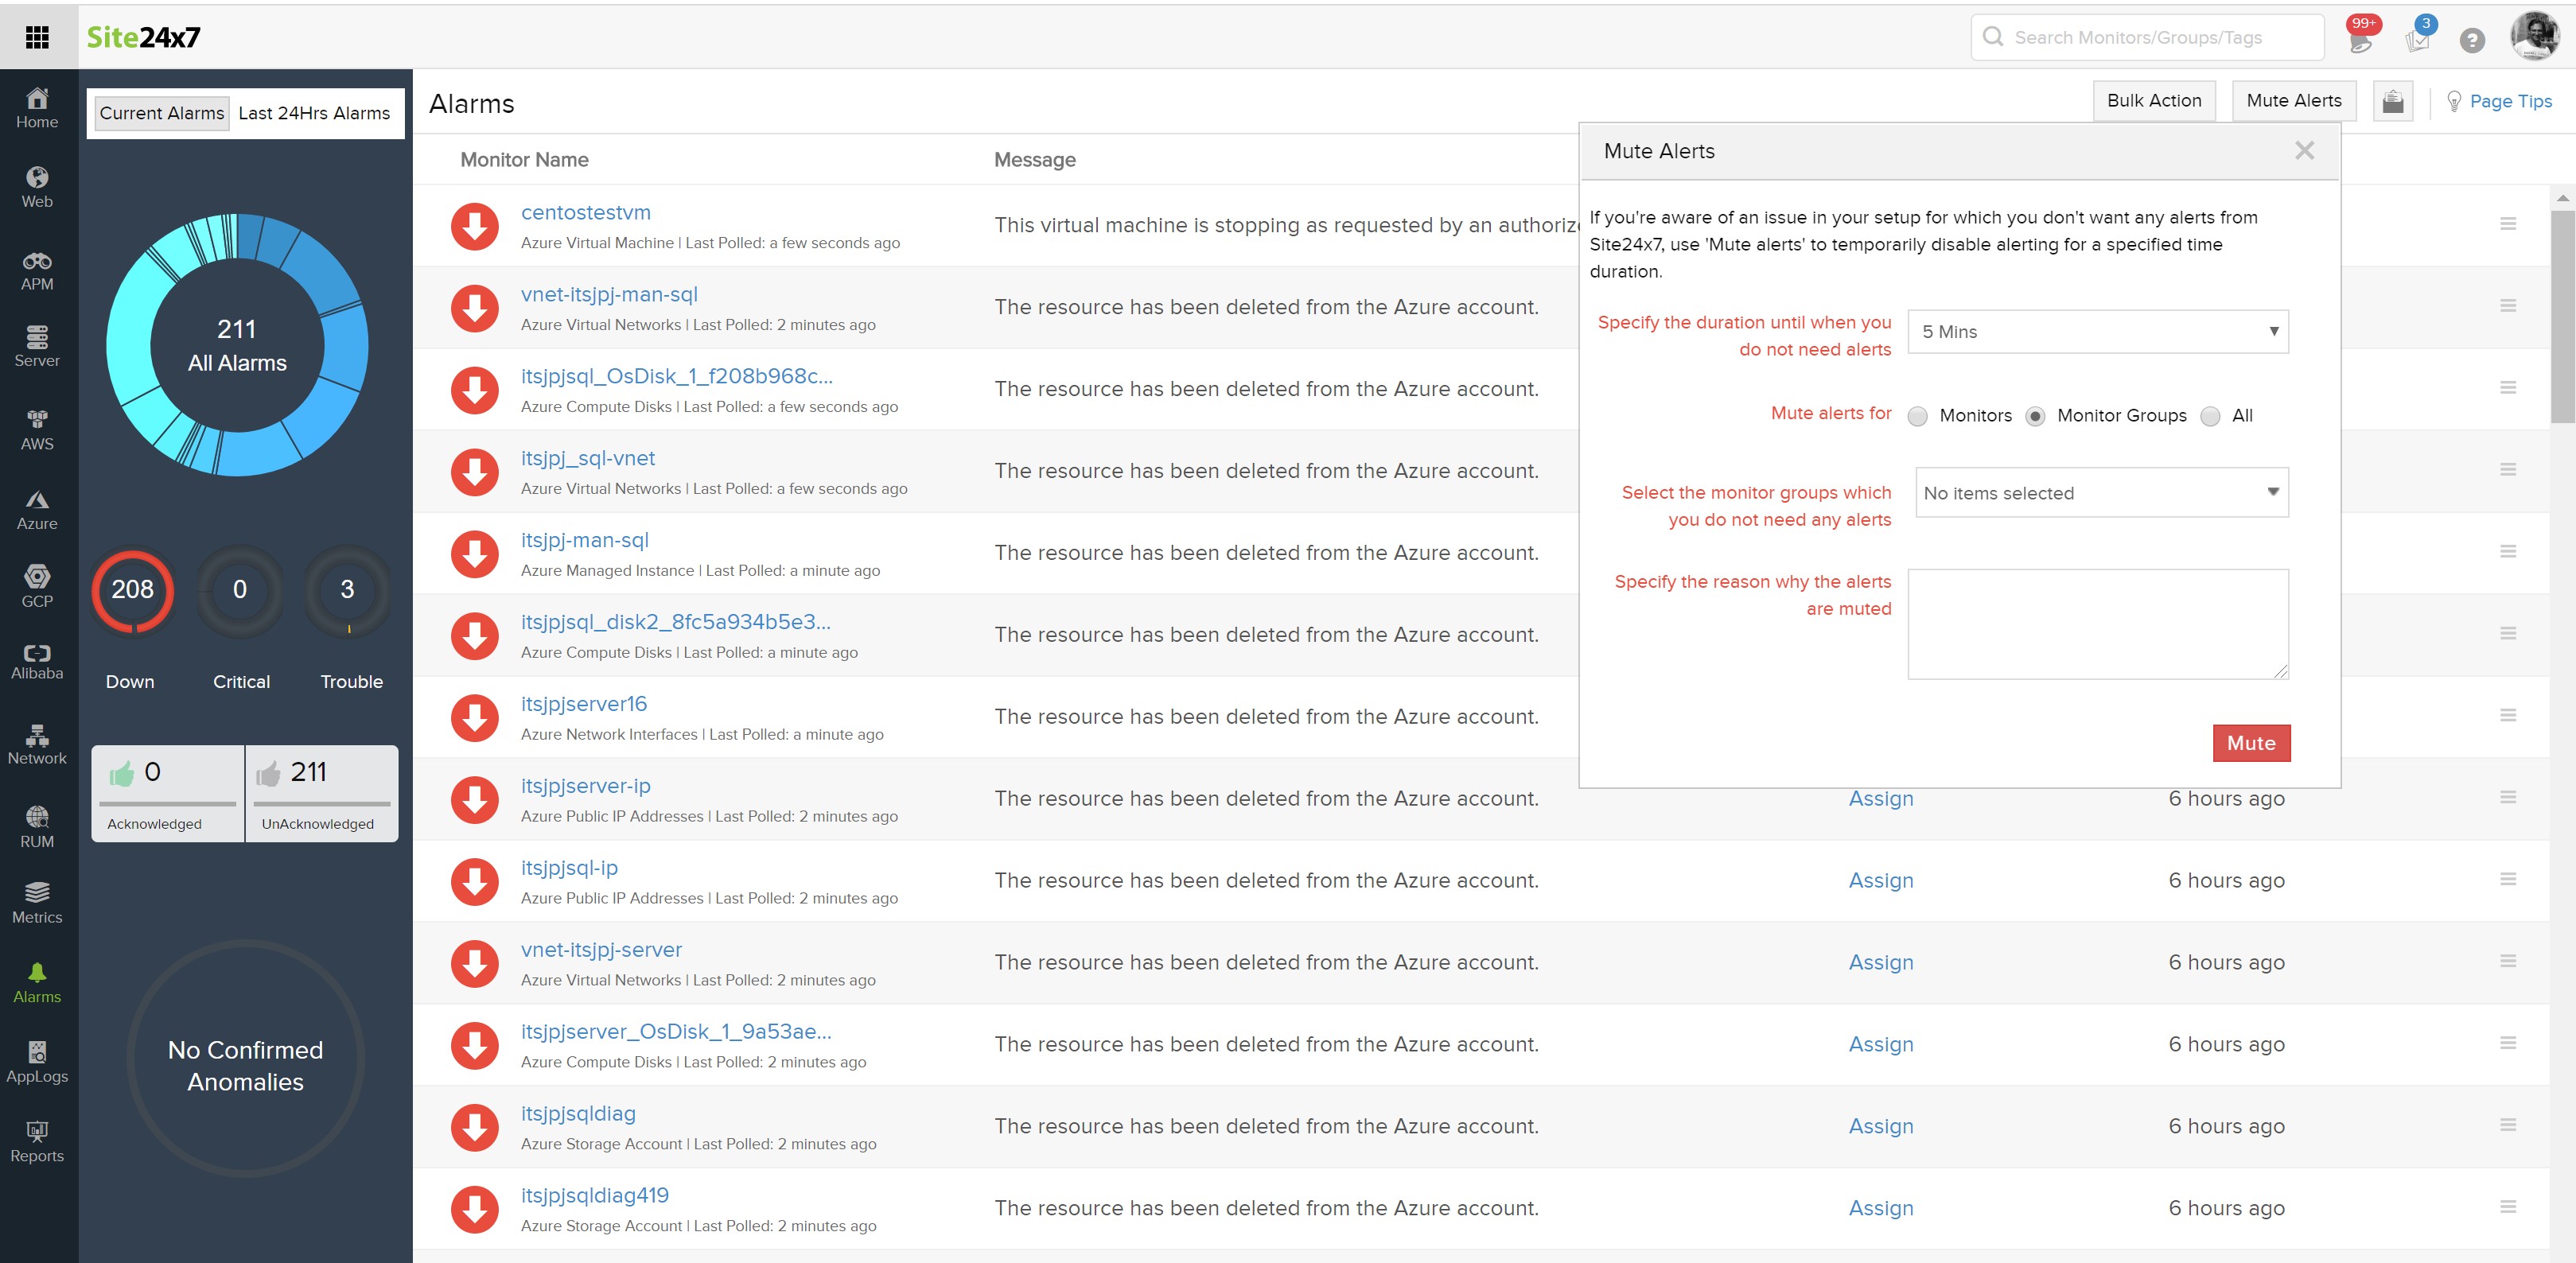
9. Site24x7

Site24x7 is a cloud-hosted network monitoring solution to provide real-time visibility into network devices, traffic, and performance metrics across distributed environments. It integrates network monitoring with broader observability capabilities for infrastructure, applications, and cloud services.
Key features of Site24x7:
- Automated device discovery and mapping: Detects devices within IP ranges or CIDR blocks and generates topology and Layer 2 maps.
- Multi-vendor device support: Supports monitoring of routers, switches, firewalls, load balancers, and wireless controllers across numerous vendors.
- Performance and interface monitoring: Tracks bandwidth usage, latency, packet errors, and interface utilization in real time.
- Flow-based traffic analysis: Supports NetFlow, sFlow, J-Flow, and related formats for bandwidth and traffic pattern analysis.
- SNMP trap processing and alerting: Processes SNMP traps and generates alerts based on predefined or custom thresholds.
- Unified cloud console: Delivers monitoring through a centralized, cloud-native interface accessible across locations.
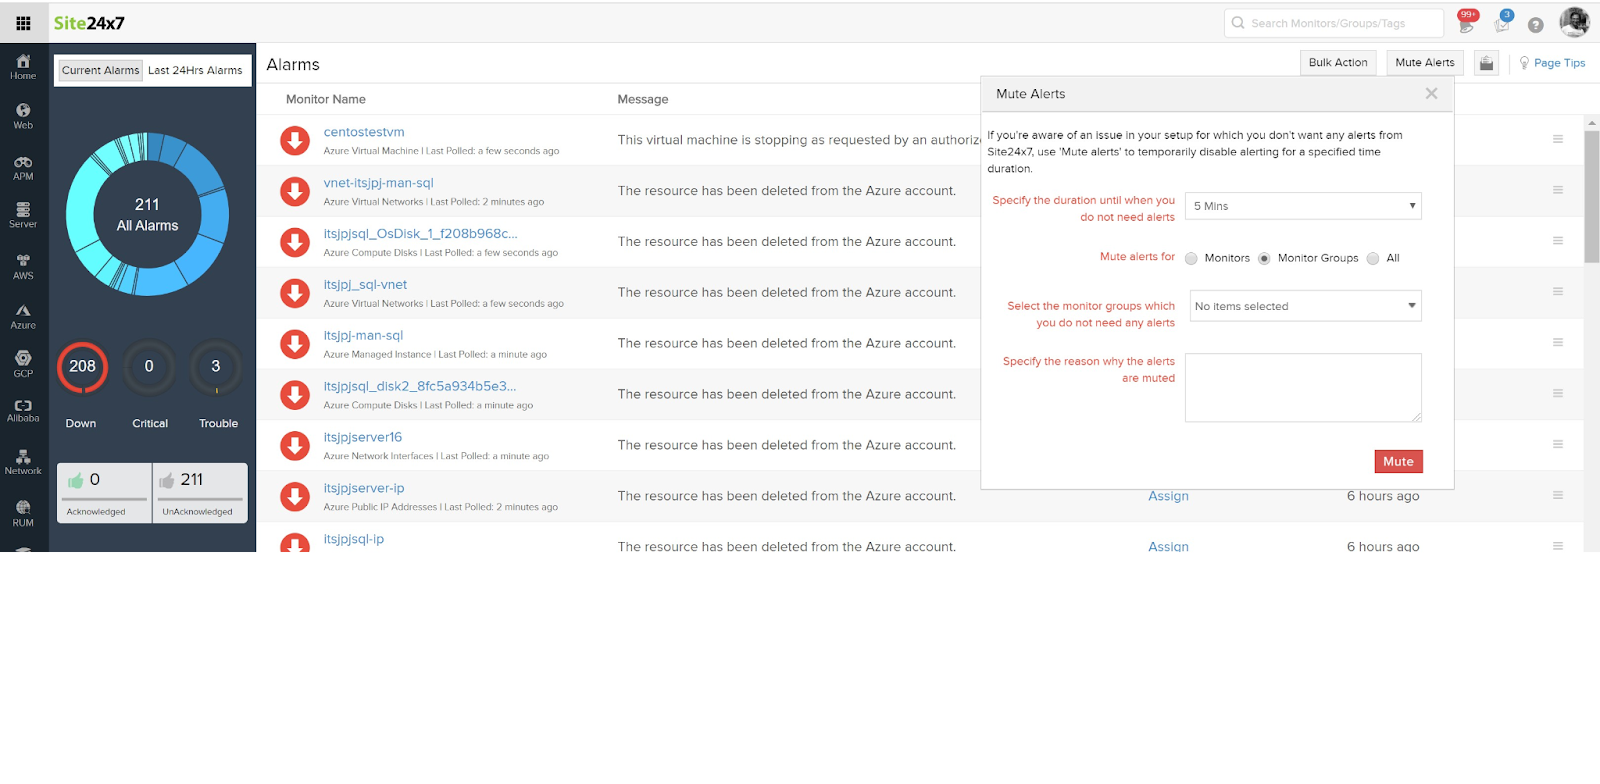
Source: Site24x7
10. Progress WhatsUp Gold

Progress WhatsUp Gold is a network monitoring platform providing visibility into infrastructure, performance, and traffic across on-premises and cloud environments. It supports monitoring of servers, network devices, applications, and traffic flows, with tools for root cause analysis, capacity planning, and configuration management.
Key features of Progress WhatsUp Gold:
- Automated device discovery and mapping: Discovers network devices and generates dynamic topology maps to visualize interconnections and dependencies.
- Customizable dashboards and NOC views: Provides preconfigured and custom dashboards, along with a configurable NOC viewer that cycles through multiple monitoring screens.
- Active and passive monitoring: Supports proactive polling as well as collection of SNMP traps, Syslog messages, and Windows events.
- Flow-based traffic analysis: Monitors network traffic using formats such as NetFlow, IPFIX, sFlow, and jFlow to analyze bandwidth usage and application performance.
- Hardware and environmental monitoring: Tracks hardware health indicators including temperature, fan status, power supplies, memory, storage, and CPU conditions.
- Alert escalation and integrations: Enables alert policies with integrations to service desks, Microsoft Teams, Slack, and other collaboration tools.
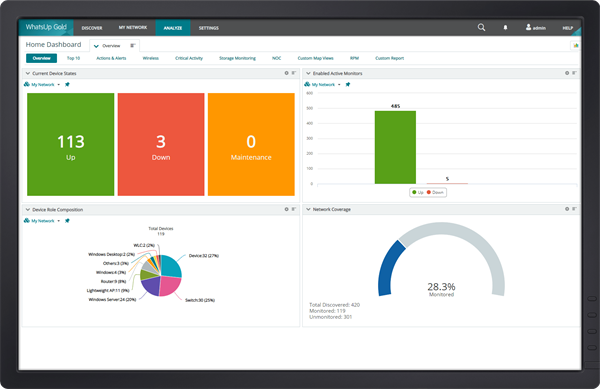
Source: WhatsUp Gold
Cloud-Native Observability and AIOps Platforms
11. Datadog
Datadog is a cloud-based observability platform that provides monitoring across infrastructure, applications, logs, and networks. Its network monitoring capabilities deliver visibility into traffic flows, service communication, and performance metrics across cloud and hybrid environments.
Key features of Datadog:
- Full-stack observability platform: Combines infrastructure monitoring, application performance monitoring, log management, and network monitoring within a unified system.
- Network performance monitoring: Tracks connections and traffic across hosts, containers, and services to identify bottlenecks and connectivity issues.
- Topology and service visibility: Provides insight into relationships between components across distributed environments.
- Cloud and container monitoring: Supports visibility into dynamic cloud and containerized workloads.
- Integrated security monitoring: Includes security-related capabilities such as cloud security posture and workload protection within the broader platform.
- Extensive integrations and APIs: Offers a wide set of integrations and APIs to connect with cloud services, infrastructure tools, and development workflows.
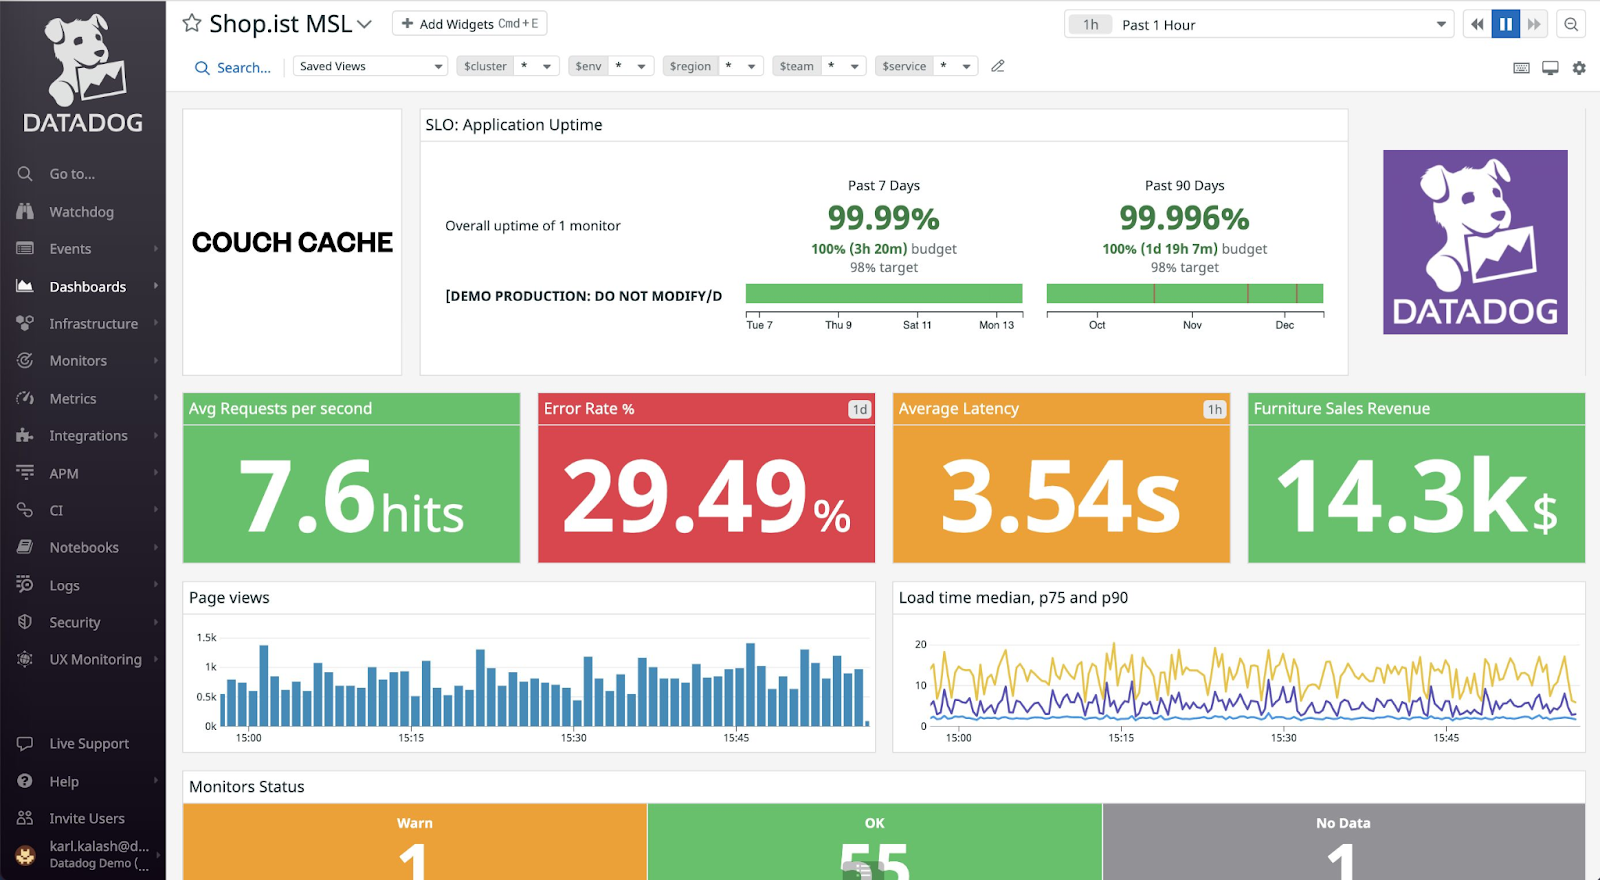
Source: Datadog
12. ScienceLogic

ScienceLogic is an AI-driven IT operations and observability platform to provide unified monitoring, automation, and analytics across hybrid and multi-cloud environments. Its modular architecture supports infrastructure monitoring, configuration management, automation, and AI-assisted root cause analysis.
Key features of ScienceLogic:
- Hybrid cloud monitoring: Provides visibility across distributed on-premises and cloud environments through a centralized platform.
- AI-powered root cause analysis: Uses AI-driven analytics to identify root causes and reduce mean time to repair.
- Configuration and compliance management: Monitors, records, and backs up network configurations to support audits and rapid restoration.
- Workflow automation: Enables low-code and no-code automation to streamline IT operations.
- Business service management: Connects infrastructure and application components to business services for impact analysis.
- Extensive integration library: Supports integrations across IT systems to consolidate tools and centralize operational data.
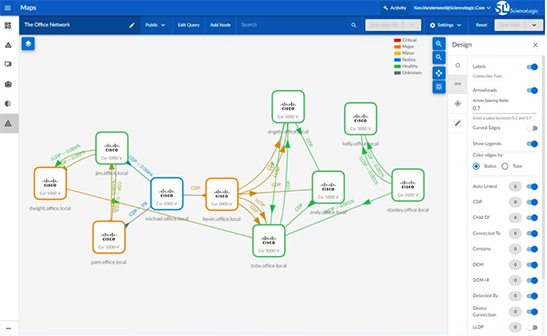
Source: ScienceLogic
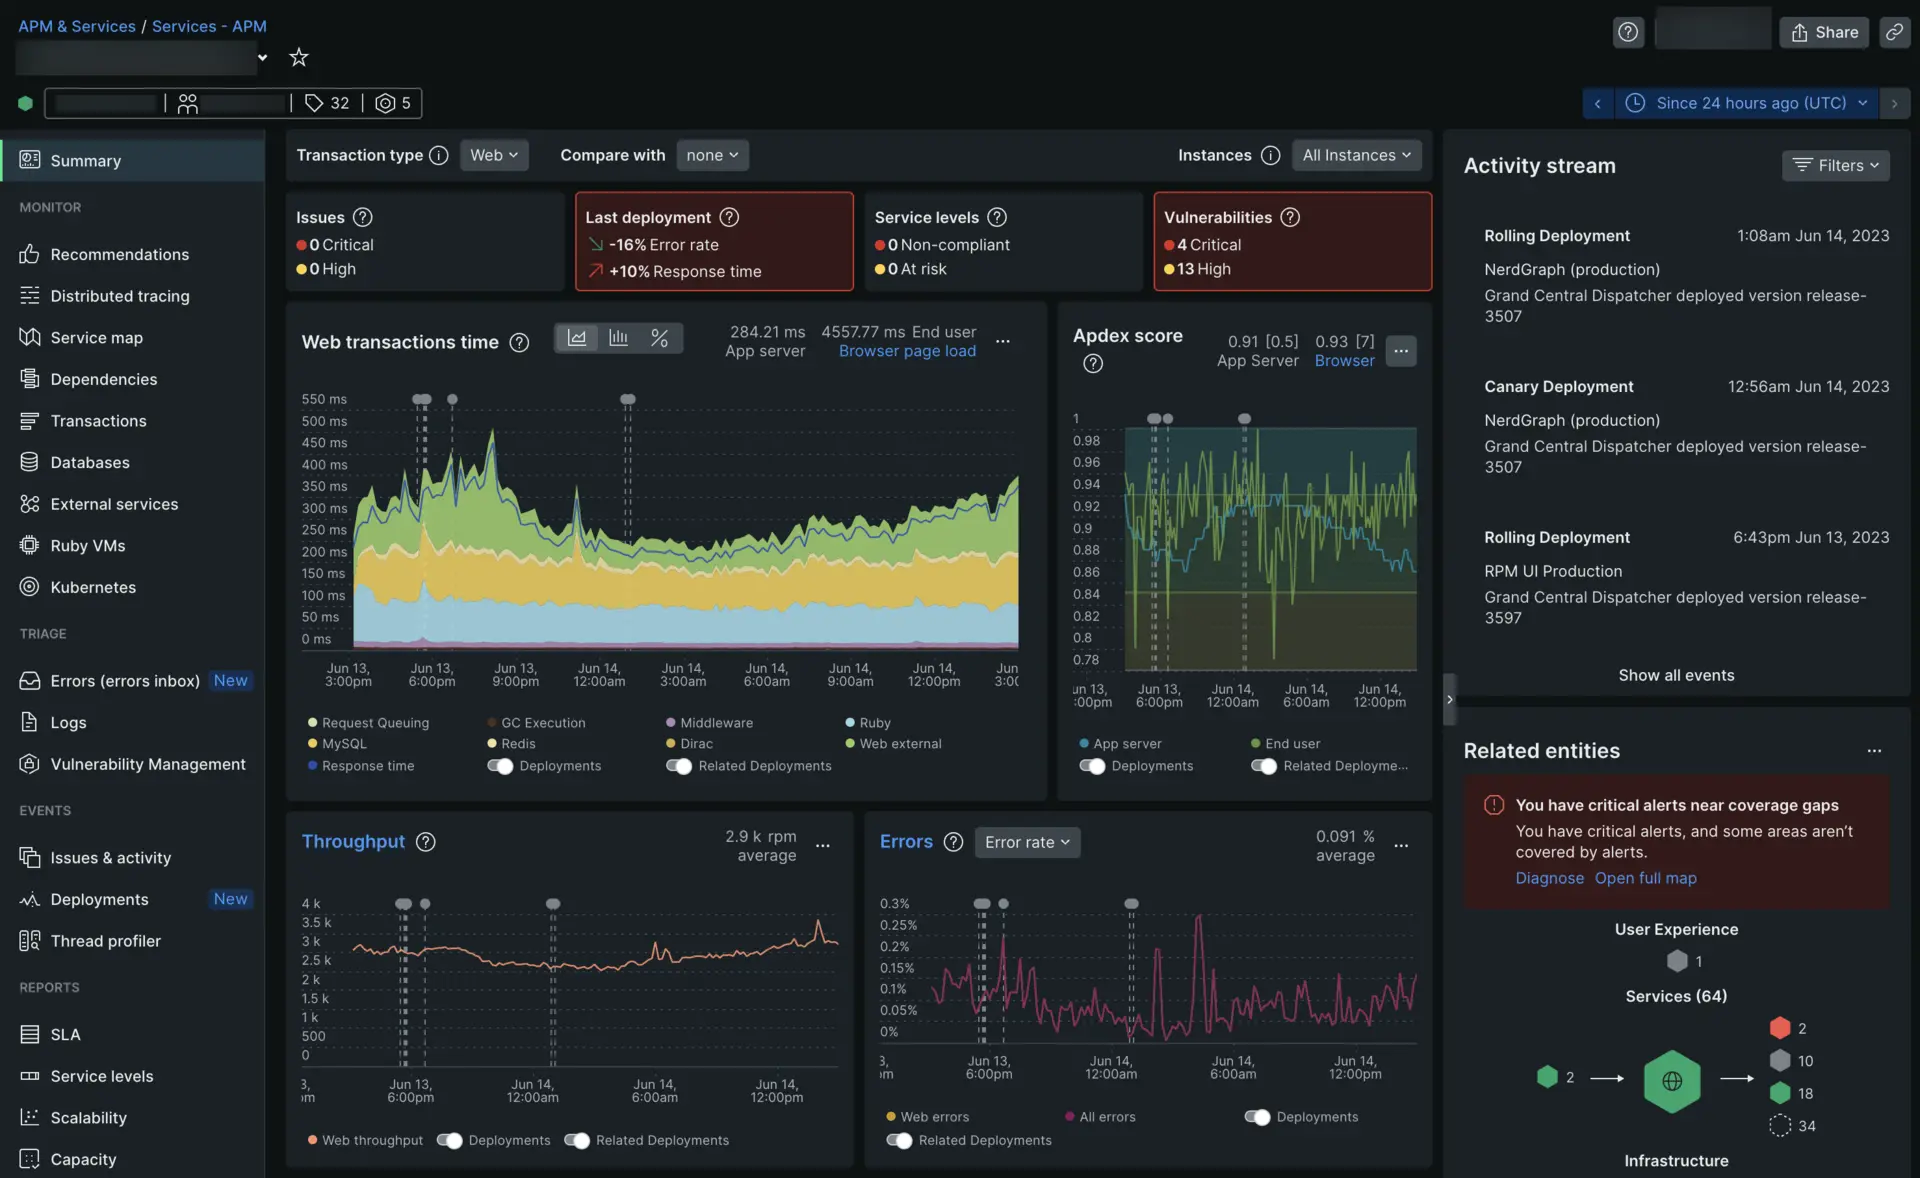
13. ScienceLogic
![]()
New Relic is an observability platform that includes proactive AIOps capabilities to detect anomalies, correlate incidents, and perform root cause analysis across complex, multi-cloud systems. It combines telemetry data with machine learning and topology mapping to support faster detection and resolution of incidents.
Key features of New Relic:
- Predictive anomaly detection: Uses machine learning models to detect abnormal patterns and reduce mean time to detection.
- Incident correlation: Groups related alerts into single issues to simplify investigation and reduce alert noise.
- Graph-based root cause analysis: Applies causal reasoning and probabilistic models to identify root causes and service relationships.
- Real-time topology insights: Provides visibility into service relationships through a live topology graph.
- Integrated incident workflows: Supports incident lifecycle management with contextual access to metrics, logs, and traces.
- Alert prioritization and collaboration: Enables configurable alert policies and integrations with collaboration and ITSM tools.
Source: New Relic
Conclusion
Choosing the right network monitoring tool depends on your organization’s specific needs. While PRTG Network Monitor offers comprehensive infrastructure management capabilities, it may not suit every environment due to cost, complexity, and scalability. Alternatives can provide faster, more cost-effective deployment with real-time visibility across both on-premises and cloud environments. These options often feature intuitive dashboards, flexible alerts, and scalability, ensuring optimal performance with minimal complexity. Whether you’re focused on overall network health or detailed application insights, there are solutions that deliver better results without the limitations of traditional tools.


