
What Are Application Dependency Mapping Solutions?
Application dependency mapping (ADM) solutions help organizations visualize and understand the relationships between applications, services, and infrastructure components. These solutions identify dependencies between software components, databases, APIs, and cloud resources, enabling IT teams to manage performance, troubleshoot issues, and optimize deployments.
ADM is essential for cloud migrations, incident response, and security audits, as it provides a clear view of how applications interact across environments. By using ADM, organizations can reduce downtime, improve efficiency, and ensure compliance with IT governance policies.
This is part of a series of articles about application mapping
Types of Application Dependency Mapping Solutions
Manual Code Analysis
Manual code analysis involves a detailed review of an application’s source code, configuration files, and dependencies to identify relationships between components. This method requires developers or architects to examine function calls, module imports, API interactions, and database connections.
This approach is accurate for understanding how applications work internally, especially for legacy systems where automated tools may not provide complete insights. However, it is labor-intensive, time-consuming, and prone to human error. It is best suited for small applications or environments where security policies restrict automated scanning.
Automated Discovery Tools
Automated discovery tools scan an application environment using various techniques such as network traffic analysis, log parsing, and API queries to detect dependencies. These tools generate real-time dependency maps, helping IT teams visualize relationships between applications, databases, and infrastructure components.
Popular automated discovery tools include application performance monitoring (APM) platforms, cloud-native observability tools, and infrastructure monitoring solutions. While they significantly reduce manual effort, they may require configuration to fine-tune results and minimize false positives or missing dependencies.
Agent-Based Monitoring
Agent-based monitoring solutions deploy lightweight software agents on servers, containers, or virtual machines to collect real-time telemetry data. These agents track application processes, API calls, network requests, and system resource usage to build a detailed dependency map.
This method provides continuous monitoring, making it particularly effective for dynamic, cloud-native environments where dependencies frequently change. However, agent-based solutions can introduce overhead, requiring careful resource management. Some organizations may also have security concerns about deploying third-party agents on critical infrastructure.
Agentless Monitoring
Agentless monitoring uses external systems and protocols—such as SNMP, WMI, or API integrations—to collect data without installing software agents on target systems. This approach reduces deployment complexity and avoids introducing additional resource consumption on monitored hosts.
While some agentless solutions may offer less granular visibility compared to agent-based approaches, they are easier to maintain and pose fewer security concerns. Their effectiveness often depends on proper access permissions and integration with existing infrastructure management tools.
Top-Down Mapping
Top-down mapping starts by analyzing high-level business processes, user interactions, and application workflows before identifying underlying infrastructure dependencies. This approach often relies on service topology data, API documentation, and business logic to trace how different components interact.
It is useful for organizations that prioritize business continuity and service-level objectives, as it helps IT teams understand the impact of application dependencies on end-users. However, because it focuses on functional relationships first, it may overlook lower-level dependencies unless combined with infrastructure-level analysis.
Bottom-Up Mapping
Bottom-up mapping begins at the infrastructure level, identifying relationships between servers, databases, network components, and middleware before linking them to applications. It leverages system logs, configuration management databases (CMDBs), cloud monitoring tools, and network traffic analysis to construct dependency maps.
This method is particularly useful for IT operations teams managing hybrid or multi-cloud environments, as it provides deep visibility into infrastructure dependencies. However, bottom-up mapping can be complex, requiring additional correlation efforts to connect infrastructure data with application functionality.
10 Notable Application Dependency Mapping Solutions
Agentless Dependency Mapping and Discovery Tools
1. Faddom

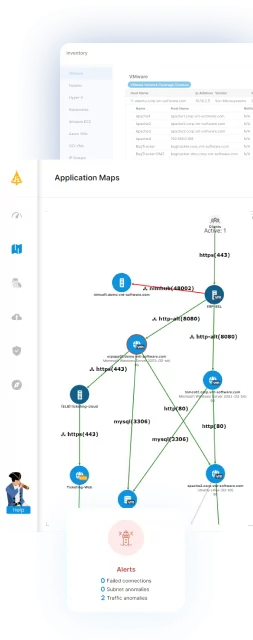
Faddom is an agentless application dependency mapping platform that maps on-premises and cloud infrastructure in real time and automatically groups servers into business applications. It works by passively collecting a copy of network traffic and reading protocols such as SNMP and flow data, so it requires no agents, no server credentials, and no firewall changes, and it can run offline without data leaving the environment. Maps are typically generated within about an hour of deployment and update continuously, around the clock. The platform applies AI-driven correlation, branded as Faddom AI, to turn raw network data into application and dependency maps. It is used for asset discovery and documentation, change management and impact analysis, data center and cloud migration, cost optimization, security, and IT audit and compliance.
Key features include:
- Agentless, passive discovery: Faddom collects a copy of network traffic and reads protocols such as SNMP and flow data, so no agents or server credentials are installed and no firewall changes are required. It is read-only and can run offline, keeping all data inside the environment.
- Real-time hybrid mapping: The platform maps on-premises and cloud infrastructure together and automatically groups servers into business applications. Maps refresh continuously so the view of dependencies stays current as the environment changes.
- Change tracking and impact simulation: Faddom records changes across the environment on an ongoing basis and lets teams simulate the impact of a planned change before it is made. This supports change management and reduces the risk of unexpected disruption.
- AI-driven correlation: Faddom AI correlates raw network data into application and dependency maps, providing the context teams use to understand and operate hybrid environments. It is positioned as the layer that translates traffic into usable topology.
- Security and discovery insights: The platform surfaces vulnerabilities, traffic anomalies, unknown outbound or external connections, and shadow IT. This data supports network segmentation, attack-surface review, and audit and compliance work.
- Fast, lightweight deployment: Faddom is designed to deploy in under an hour and produce a single source of truth across on-premises and cloud environments. It is offered with plans aimed at consultants, small businesses, and large enterprises.
Limitations (as reported by users on G2):
- Interface refinement: Some users note that the interface could be modernized, an update the vendor has indicated is in progress.
- Onboarding for non-technical users: The depth of data presented can make initial navigation feel complex for less technical users.
- Coverage of non-standard sources: Because discovery is agentless and traffic-based, some non-standard systems or cloud-native resources may require manual adjustment or additional configuration.

2. BMC Helix Discovery

BMC Helix Discovery is a discovery and dependency-modeling solution, available as SaaS or on-premises, that automatically finds IT assets and maps their relationships across cloud and on-premises environments. It uses agentless continuous discovery to keep inventory current without manual updates, and it feeds topology data into the broader BMC Helix platform to support observability and AIOps. The solution applies blueprint-based service modeling to visualize the infrastructure that supports specific business services, and it reconciles data from multiple topology sources into a single view. It connects service models, topology, and telemetry to help identify root causes and assess related impacts. It also surfaces security and compliance information such as hidden assets and SSL/TLS certificates. Deployment uses a cloud-native service together with on-premises Discovery Outposts that scan data center and cloud environments.
Key features include:
- Agentless continuous discovery: The solution automatically discovers assets and maps their relationships across cloud and on-premises environments. Data is refreshed without manual updates so the inventory stays current.
- Blueprint-automated service modeling: A library of service-modeling blueprints, along with “start anywhere” application modeling, visualizes the infrastructure that supports a given business service. This helps teams see which components underpin each service.
- Data reconciliation: BMC Helix Discovery unifies data from diverse topology sources into a single, consistent view and can publish that data to a CMDB. This reduces conflicting records across sources.
- Real-time service awareness: By connecting service models, topology, and telemetry, the solution helps pinpoint root causes and visualize the impact of issues. The topology data also feeds AIOps insights in the BMC Helix platform.
- Security and compliance visibility: Blind spot detection exposes hidden or undocumented assets and dependencies, and SSL/TLS certificate discovery helps manage certificates. Automated asset inventories support regulatory audits.
- Multi-cloud visibility: The solution discovers and manages resources across cloud environments to support migration planning, capacity work, and security. It is intended to keep pace with frequent infrastructure changes.
Limitations (as reported by users on PeerSpot):
- Client-side discovery gaps: Discovery is focused on the data center, and coverage of client-side devices such as desktops and printers is reported as limited.
- Stability and update cadence: Some users report stability concerns and would prefer more frequent updates.
- Query language learning curve: The pattern and query language used for customization is described as challenging to learn, and customization options are seen as limited.
- Pricing and scalability: Pricing and the licensing model are viewed as high, and some users report scalability shortcomings.
- Duplicate records and database configuration: Reducing duplicate records and configuring the database are cited as areas needing attention.

Source: BMC
3. Lansweeper

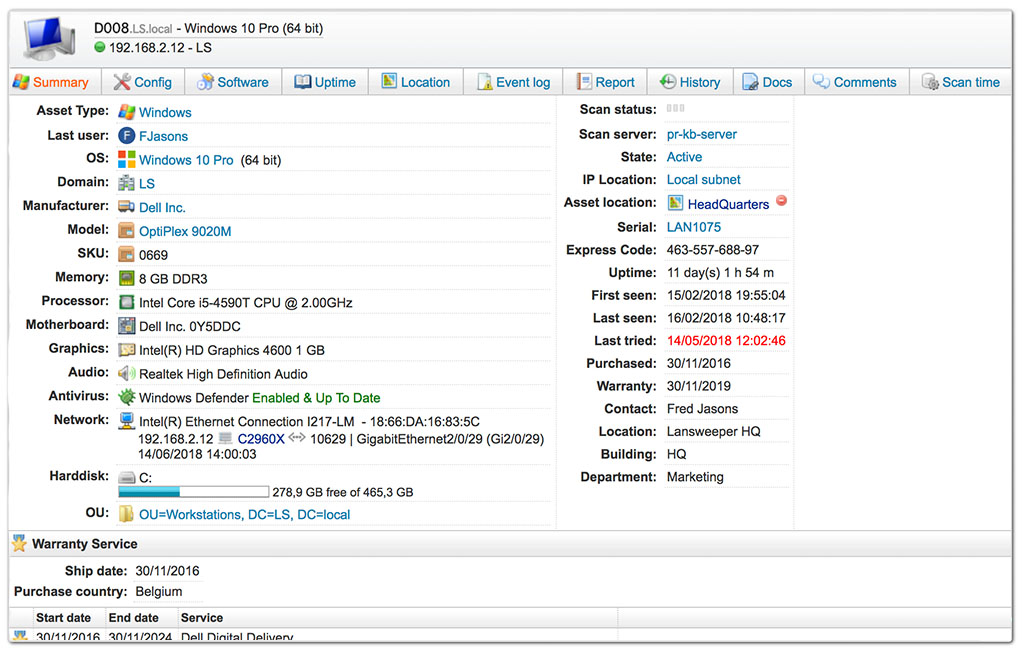
Lansweeper is an agentless IT asset discovery and inventory platform that consolidates IT, OT, and cloud assets into a single source of truth and can visualize how those assets connect through network topology diagrams. Its discovery finds managed, unmanaged, and shadow devices, and its switch port mapping automatically identifies the devices connected to each switch port. Diagrams are generated automatically from the inventory and configured IP locations, organized by network topology and virtual environments, and they expose relationships, uplinks, and orphan assets to support dependency mapping. The platform uses standard protocols such as SNMP, SSH, and WMI, with custom OID scanning and imported MIB files for deeper detail. Clean asset data is pushed to ITSM, CMDB, and security tools through native integrations and an open API.
Key features include:
- Agentless asset discovery: Lansweeper finds managed, unmanaged, and shadow assets across IT, OT, and cloud environments without installing agents. It uses standard protocols to gather hardware, software, and configuration data.
- Network topology diagrams and dependency mapping: Diagrams are generated automatically from the inventory and IP locations and organized by network topology and virtual environments. They reveal relationships, uplinks, and orphan assets so teams can map dependencies between devices.
- Switch port mapping: The platform automatically discovers and documents the devices connected to each switch port and centralizes switch and network-interface data. Items are hyperlinked so users can move between port and device views.
- Custom OID and MIB scanning: Custom OID scanning collects device-specific SNMP data beyond the default discovery, and MIB files can be imported from a library. This allows deeper, more targeted data collection.
- Reporting and analytics: Customizable reports, dashboards, vulnerability data, lifecycle insights, and benchmarking turn inventory into analysis. These help teams spot risks and plan spending.
- Integrations and open API: Native integrations and an open API push asset data to ITSM, CMDB, and security tools such as ServiceNow and Jira. Automation workflows can reclaim licenses, power down idle servers, and enrich tickets.
Limitations (as reported by users on G2):
- Support channels: Support is largely delivered through knowledge-base articles, forums, and chat, with limited direct, real-time interaction.
- On-premises and cloud divergence: New capabilities are added mainly to the cloud instance, and on-premises reporting is complex, requiring SQL and database knowledge.
- Data residency: The cloud instance stores data in an EU cloud region, which raises data-sovereignty considerations for some organizations.
- Pricing tiers: The jump from the free 100-asset tier to the next paid tier can be costly for smaller organizations.
- Deployment and interface: Software deployment features are reported as limited, and the interface can feel overwhelming for new users.

Source: Lansweeper
4. JDisc Discovery

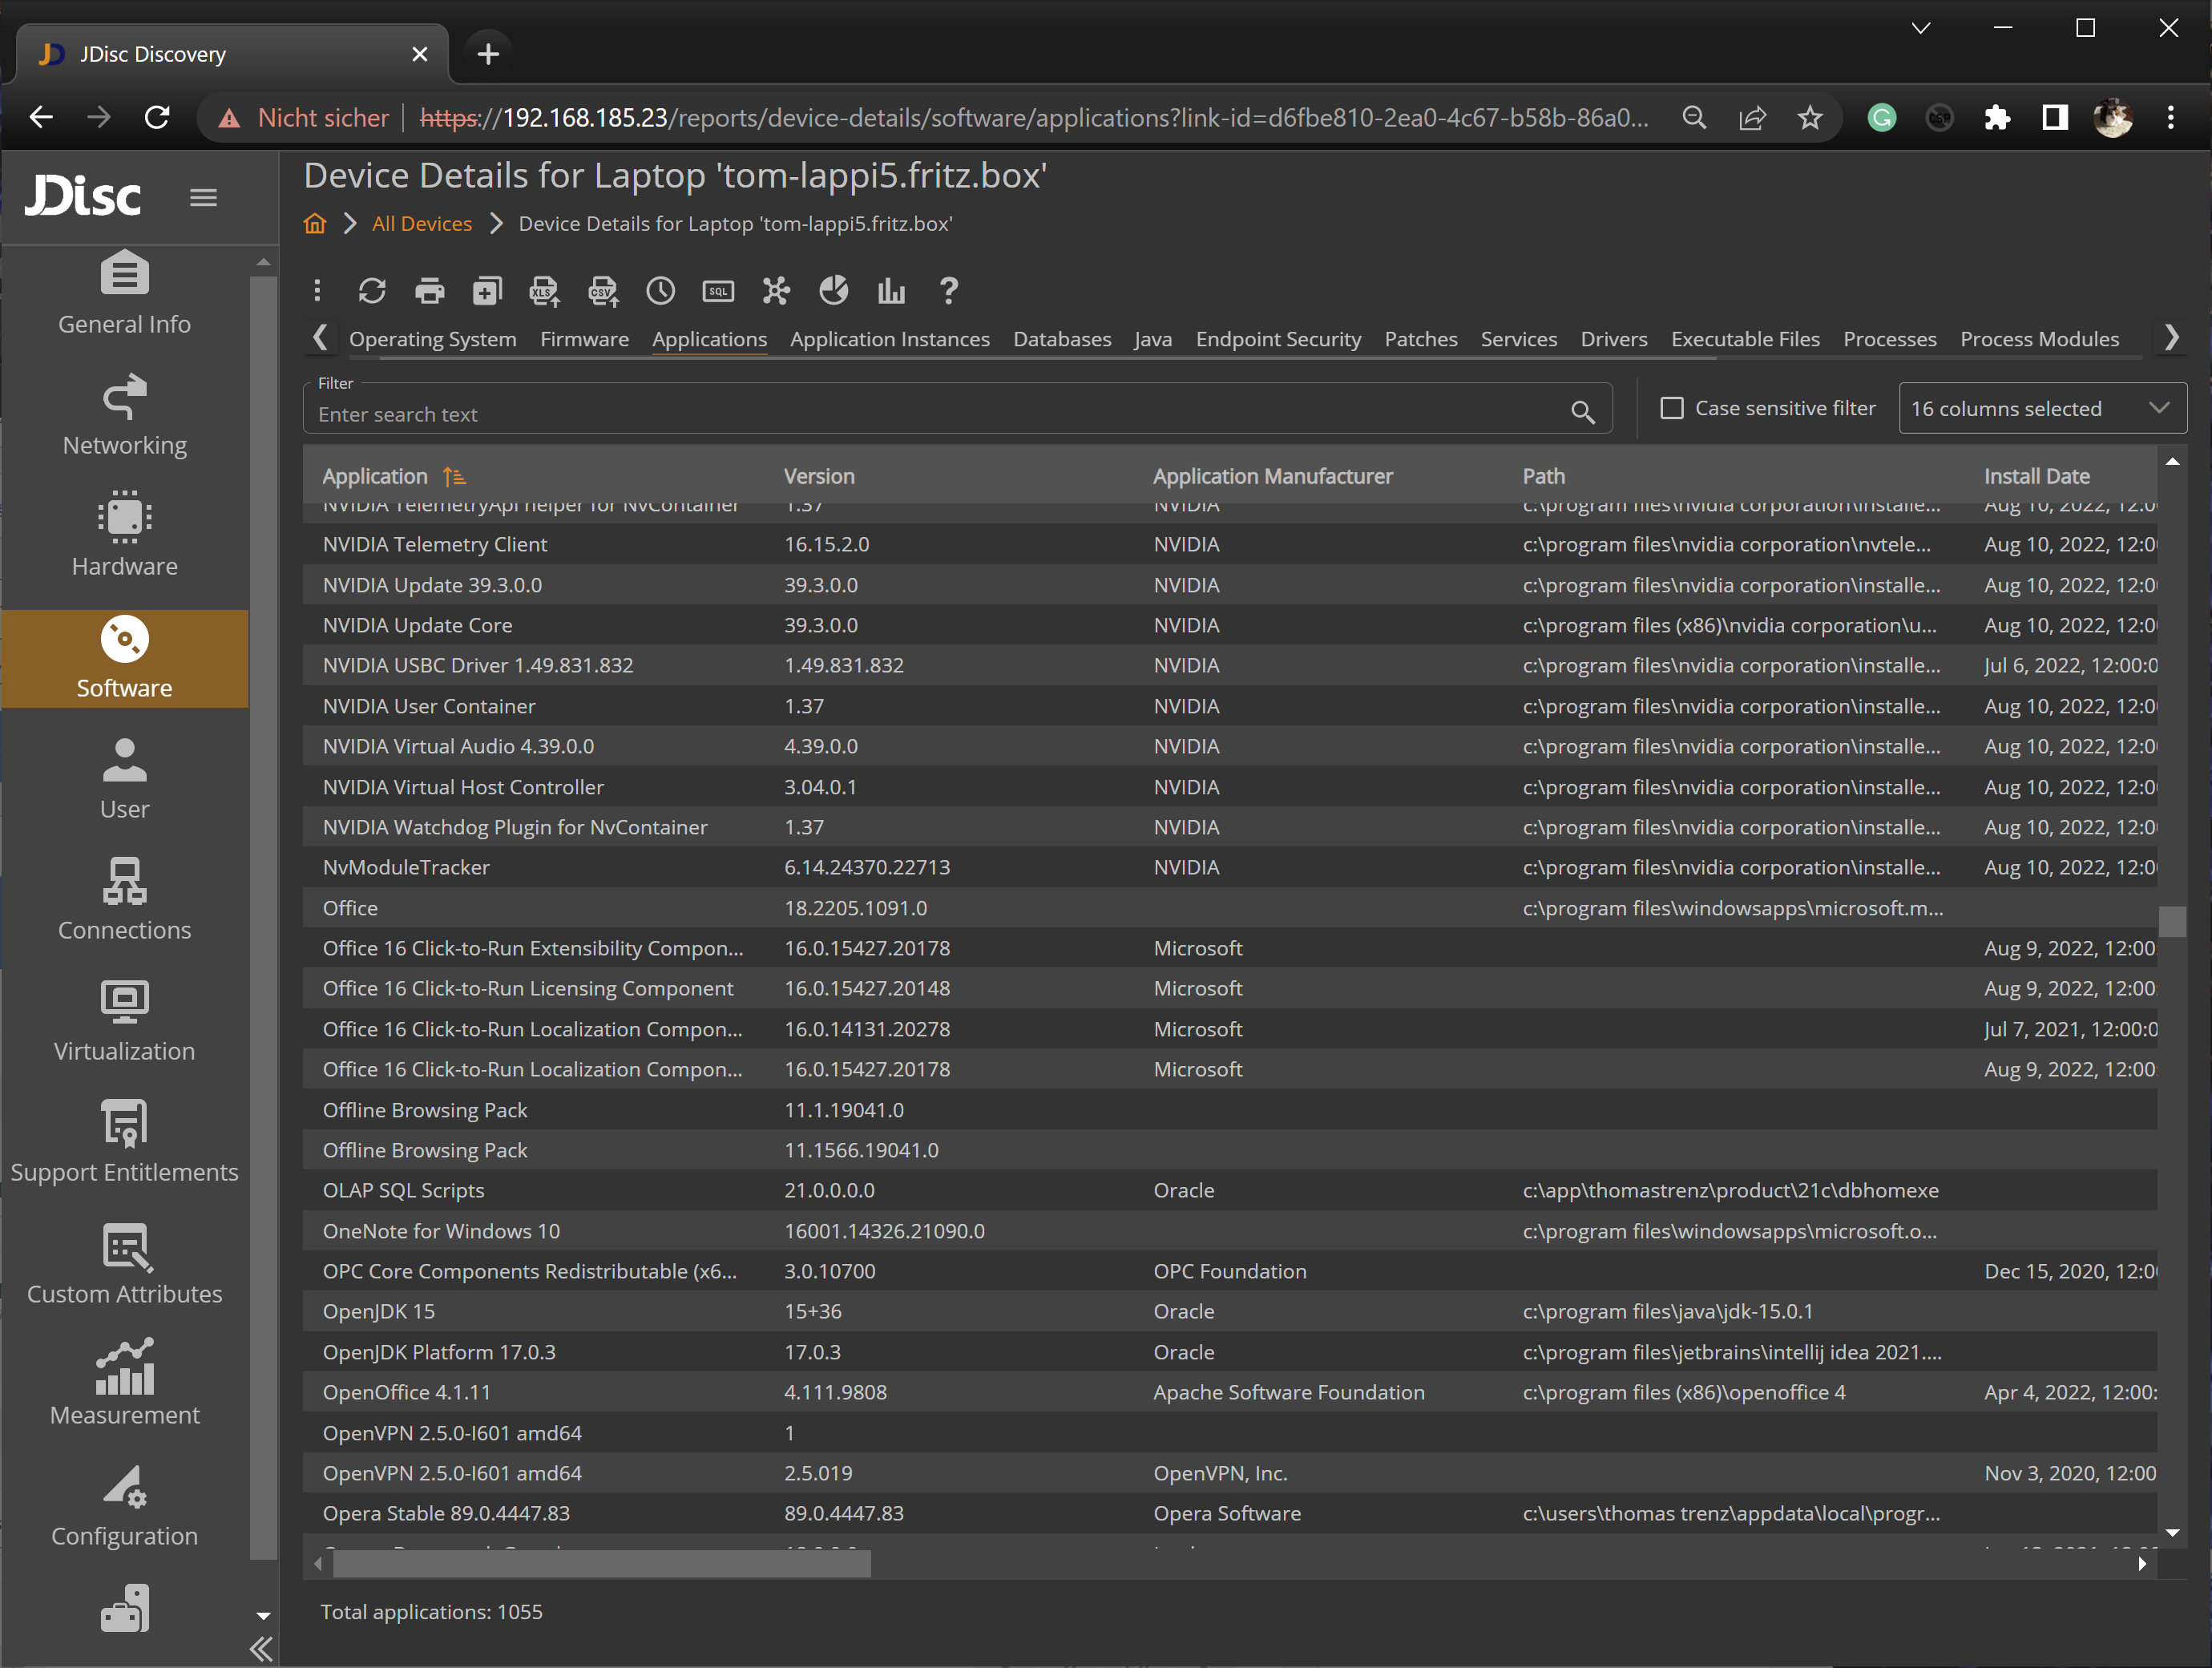
JDisc Discovery is an agentless network discovery and IT documentation tool that scans heterogeneous networks without proprietary agents and builds an inventory of hardware, software, and dependencies. It detects major operating systems—including Windows, Linux, macOS, AIX, Solaris, HP-UX, and FreeBSD—and SNMP-based network devices, and it supports cloud environments such as Azure, AWS, Google Cloud, Cisco Meraki, and Hetzner. Its Dependency Mapping add-on finds TCP connections between devices and detects open TCP and UDP ports, displaying them as graphical dependency maps or table-based reports. It can associate processes with ports and retrieve SSL certificates, which supports migration, consolidation, and security audits. Collected data is stored in a PostgreSQL database with encrypted credentials, and a GraphQL API plus CMDB integrations feed other systems.
Key features include:
- Agentless discovery: JDisc scans without permanent agents, using SNMP and remote login to reach devices. It covers a broad range of operating systems and SNMP-based network devices.
- Dependency Mapping add-on: The add-on finds TCP connections between devices and detects open TCP and UDP ports, then displays them as graphical dependency maps or table reports. This makes it possible to see how distributed applications communicate.
- Process and port detail: The add-on identifies processes listening on ports and retrieves SSL certificates, and with the security add-on it can determine SSL encryption. This supports simple security audits, such as locating exposed services.
- Cloud and virtualization discovery: Discovery covers Azure, AWS, Google Cloud, Cisco Meraki, and Hetzner, and it links virtual machines to their physical hosts. This extends documentation across hybrid environments.
- Map filtering and editing: Device-type and port filters suppress irrelevant devices and connections, the hop limit can be adjusted to widen the view, and connections can be edited manually. This keeps dependency maps focused.
- Integration and data security: Ready-made CMDB integrations and a GraphQL API feed other systems, and custom scripts and attributes extend data collection. Data is stored in PostgreSQL with AES-128 encrypted passwords and SSL/HTTPS communication.
Limitations (as reported by users on Capterra):
- Install and update process: Minor build updates can require a full reinstall, and keeping multiple installations on the latest build is cumbersome.
- Windows client architecture: Some administrative tasks require the Windows client built on .NET, and a full web interface is still in development.
- Credential storage: Using the product to its full extent requires storing access credentials, so the host operating system needs to be hardened.
- Agentless trade-off: In networks with many unwanted devices, agentless scanning can surface clutter that must be filtered out.

Source: JDisc
APM and Observability Platforms
5. Dynatrace

Dynatrace is an observability platform that automatically discovers the components and dependencies of an entire technology stack and maps them in real time. After a single agent, OneAgent, is installed, its Smartscape technology detects dependencies between applications, services, processes, hosts, networks, and infrastructure, typically within minutes, and presents them as an interactive topology. It covers a broad range of technologies, including AWS, Azure, Google Cloud, Kubernetes, Docker, Java, .NET, databases, Linux, and Windows. The platform automatically learns normal performance baselines and uses AI to detect anomalies and perform root-cause analysis. The topology updates continuously as the environment changes, providing a current view without manual assembly of data.
Key features include:
- Automated topology discovery: A single agent auto-discovers the components and dependencies of the full technology stack end to end, typically in minutes and without manual configuration. This removes the need to define the topology by hand.
- Smartscape visualization: Smartscape presents an interactive, real-time dependency graph across applications, services, processes, hosts, networks, and infrastructure. It shows full-stack dependencies on one axis and incoming and outgoing call relationships on another.
- AI-driven analysis: Dynatrace learns each environment’s normal performance, detects anomalies automatically, and performs root-cause analysis. This is intended to reduce manual diagnosis time.
- Broad technology coverage: The platform monitors AWS, Azure, Google Cloud, Kubernetes, Docker, Java, .NET, databases, Linux, and Windows, among others. This supports mixed and cloud-native environments.
- Continuous change tracking: Dynatrace recognizes changes to infrastructure and application topology on the fly, keeping an up-to-date blueprint of the architecture. Teams do not have to correlate data manually.
- Drill-down performance detail: Any component in the topology can be selected to view its performance details. This connects the dependency view to operational data.
Limitations (as reported by users on G2):
- Pricing: The pricing model is reported as expensive, particularly at larger scale, and the pricing structure can be hard to estimate.
- Learning curve and complexity: The breadth of features creates a steep learning curve and requires significant training and time.
- Documentation gaps: Some framework-specific documentation is described as outdated, leading to trial-and-error troubleshooting.
- Support response: Delays are reported for more complex technical support issues.

Source: Dynatrace
6. SolarWinds Server & Application Monitor

SolarWinds Server & Application Monitor (SAM), part of SolarWinds Observability Self-Hosted, monitors servers and applications across on-premises, cloud, and hybrid environments and maps how applications and servers depend on one another. Its application dependency mapping feature automatically discovers and visualizes the communication-based relationships between applications and servers and tracks connection metrics such as latency and packet loss. It provides end-to-end monitoring of the application stack using more than 1,200 templates, along with server capacity forecasting and custom application monitoring. The AppStack view provides interactive visual mapping across the environment to help locate the root cause of performance and availability issues. SAM can also monitor AWS instances, Azure VMs, and Microsoft 365 alongside on-premises systems, and it runs behind the firewall.
Key features include:
- Application dependency mapping: SAM automatically discovers and visualizes application-to-application and application-to-server relationships. It monitors connection quality metrics such as latency and packet loss to show whether network issues affect applications.
- AppStack environment mapping: AppStack provides an interactive visual map across the environment to help identify the root cause of performance and availability issues. It links application and infrastructure layers in one view.
- End-to-end application and server monitoring: The product tracks server and application components across the stack using more than 1,200 templates and supports custom application monitoring. This covers a range of on-premises and cloud applications.
- Server capacity forecasting: SAM tracks CPU, memory, and storage usage trends to help prevent resource exhaustion. This supports planning for future growth.
- Hybrid and cloud monitoring: The product can monitor AWS instances, Azure VMs, and Microsoft 365 alongside on-premises systems from one view. This extends dependency and performance monitoring to cloud workloads.
- Self-hosted deployment: SAM runs behind the firewall as part of SolarWinds Observability Self-Hosted and integrates with other Orion modules. It is also available as a standalone module.
Limitations (as reported by users on TrustRadius):
- Tuning required: Out-of-the-box monitors need ongoing tuning and threshold adjustment before they are fully useful.
- Custom alerting and reporting effort: Configuring custom SNMP alerts is described as onerous, and custom reporting is not easy to use.
- Interface navigation: The web interface reloads on some pop-up actions, which interrupts navigation.
- Protocol issues: WMI and SNMP issues are reported with certain devices, and polling can generate network noise that some remote networks block.

Source: SolarWinds
5. ManageEngine Applications Manager

ManageEngine Applications Manager provides Application Discovery and Dependency Mapping (ADDM) that discovers applications, servers, and databases across the network and maps the relationships between them. Administrators predefine an IP range for discovery, choose which resource types to include, and can schedule periodic re-discoveries so that new resources are added automatically. The Dependency Map View draws relationships between servers and applications, with newly discovered applications added automatically and adjustable map layouts. A separate Business Service Map View presents resources as a flow chart for a higher-level view of how components connect across the infrastructure. Discovered components and their dependencies can be pushed into the ServiceDesk Plus CMDB as configuration items, where they support change and impact analysis.
Key features include:
- Application discovery and dependency mapping: ADDM discovers applications, servers, and databases within a defined IP range and maps the dependencies between them. Administrators can select which resource types to include in discovery.
- Scheduled re-discovery: Periodic re-discoveries scan the network automatically so new resources are added without manual effort. A scan summary report shows scan status and the number of devices and applications found.
- Dependency Map View: The view automatically draws relationships between servers and applications, adds newly discovered applications to existing maps, and adjusts positioning to avoid overlap. Maps can also be repositioned manually.
- Business Service Map View: This flow-chart view breaks down the resources within each monitor group for broader visibility, helping teams see connections and locate faulty devices without browsing the whole infrastructure.
- CMDB integration: Components and dependencies can be placed in the ServiceDesk Plus CMDB as configuration items, and the CMDB is updated automatically. This supports change and impact analysis from the relationship maps.
- Periodic and on-demand mapping: Dependency maps can be created from network discovery profiles and refreshed on a schedule, keeping the mapped view aligned with the environment.
Limitations (as reported by users on G2):
- Setup complexity: Initial setup and tuning of discovery rules can be time-consuming for large environments, and there are no guided wizards for complex configurations.
- Interface: Some modules have legacy or cluttered interface elements that feel inconsistent with modern expectations.
- Integrations and scalability: Third-party integration is described as somewhat limited, and scalability is a concern for very large enterprises.
- Alert noise: Default alert thresholds can generate excessive notifications that require customization.
- Tiering and mobile app: Some advanced features require higher licensing tiers, and the mobile app offers limited functionality compared with the desktop version.

Source: ManageEngine
CMDB, ITSM, and Cloud Migration Discovery
8. ServiceNow IT Operations Management

ServiceNow IT Operations Management (ITOM) provides discovery and service mapping that automatically find IT resources and map end-to-end service dependencies across on-premises and cloud environments. ITOM Visibility combines Discovery and Service Mapping, which populate and maintain the Configuration Management Database (CMDB) using the Common Services Data Model so teams get a unified service graph with business context. The platform federates signals from systems, services, and applications to support root-cause analysis, prioritization, and impact assessment from first-party and third-party data. Change Impact Analysis shows the downstream effect of a planned change, and Event Intelligence correlates and de-duplicates alerts across monitoring tools. ITOM integrates natively with ServiceNow ITSM and applies AIOps for anomaly detection and automated remediation.
Key features include:
- Dynamic discovery: ITOM automatically discovers and maps end-to-end service dependencies in real time, drawing on first-party and third-party discovery data. This supports faster root-cause analysis and impact assessment.
- Service mapping and CMDB: Service Mapping builds dynamic service maps with the Common Services Data Model and keeps the CMDB accurate by linking components to business services. This maintains an up-to-date record of assets and relationships.
- Unified service graph: ITOM provides business context across hybrid and cloud environments in a single service graph. This connects infrastructure to the services it supports.
- Change impact analysis: The platform shows the downstream impact of a planned update so a single change does not inadvertently affect another service. This helps prevent self-inflicted incidents.
- Event intelligence and AIOps: ITOM correlates and de-duplicates alerts across monitoring tools, reduces alert noise, and uses automated and agentic workflows to drive remediation. This streamlines incident handling.
- Service Graph Connectors and certificate management: Service Graph Connectors unify data from third-party tools into the CMDB, and TLS certificate management tracks certificates across the environment.
Limitations (as reported by users on PeerSpot):
- Complexity and setup: Implementation is reported as complex and typically requires skilled administrators to build patterns and manage credentials.
- Cost: Per-CI, usage-based pricing is described as expensive, and Service Mapping is a separate add-on.
- Discovery at scale: Discovery can be complex in large or fast-changing environments, and duplicate configuration items can appear without proper reconciliation rules.
- Interface: Navigation can feel cumbersome when teams need only a small part of the platform.
- Integrations and customization: Some discovery scenarios require third-party integration, and users ask for better integrations and more customization options.

Source: ServiceNow
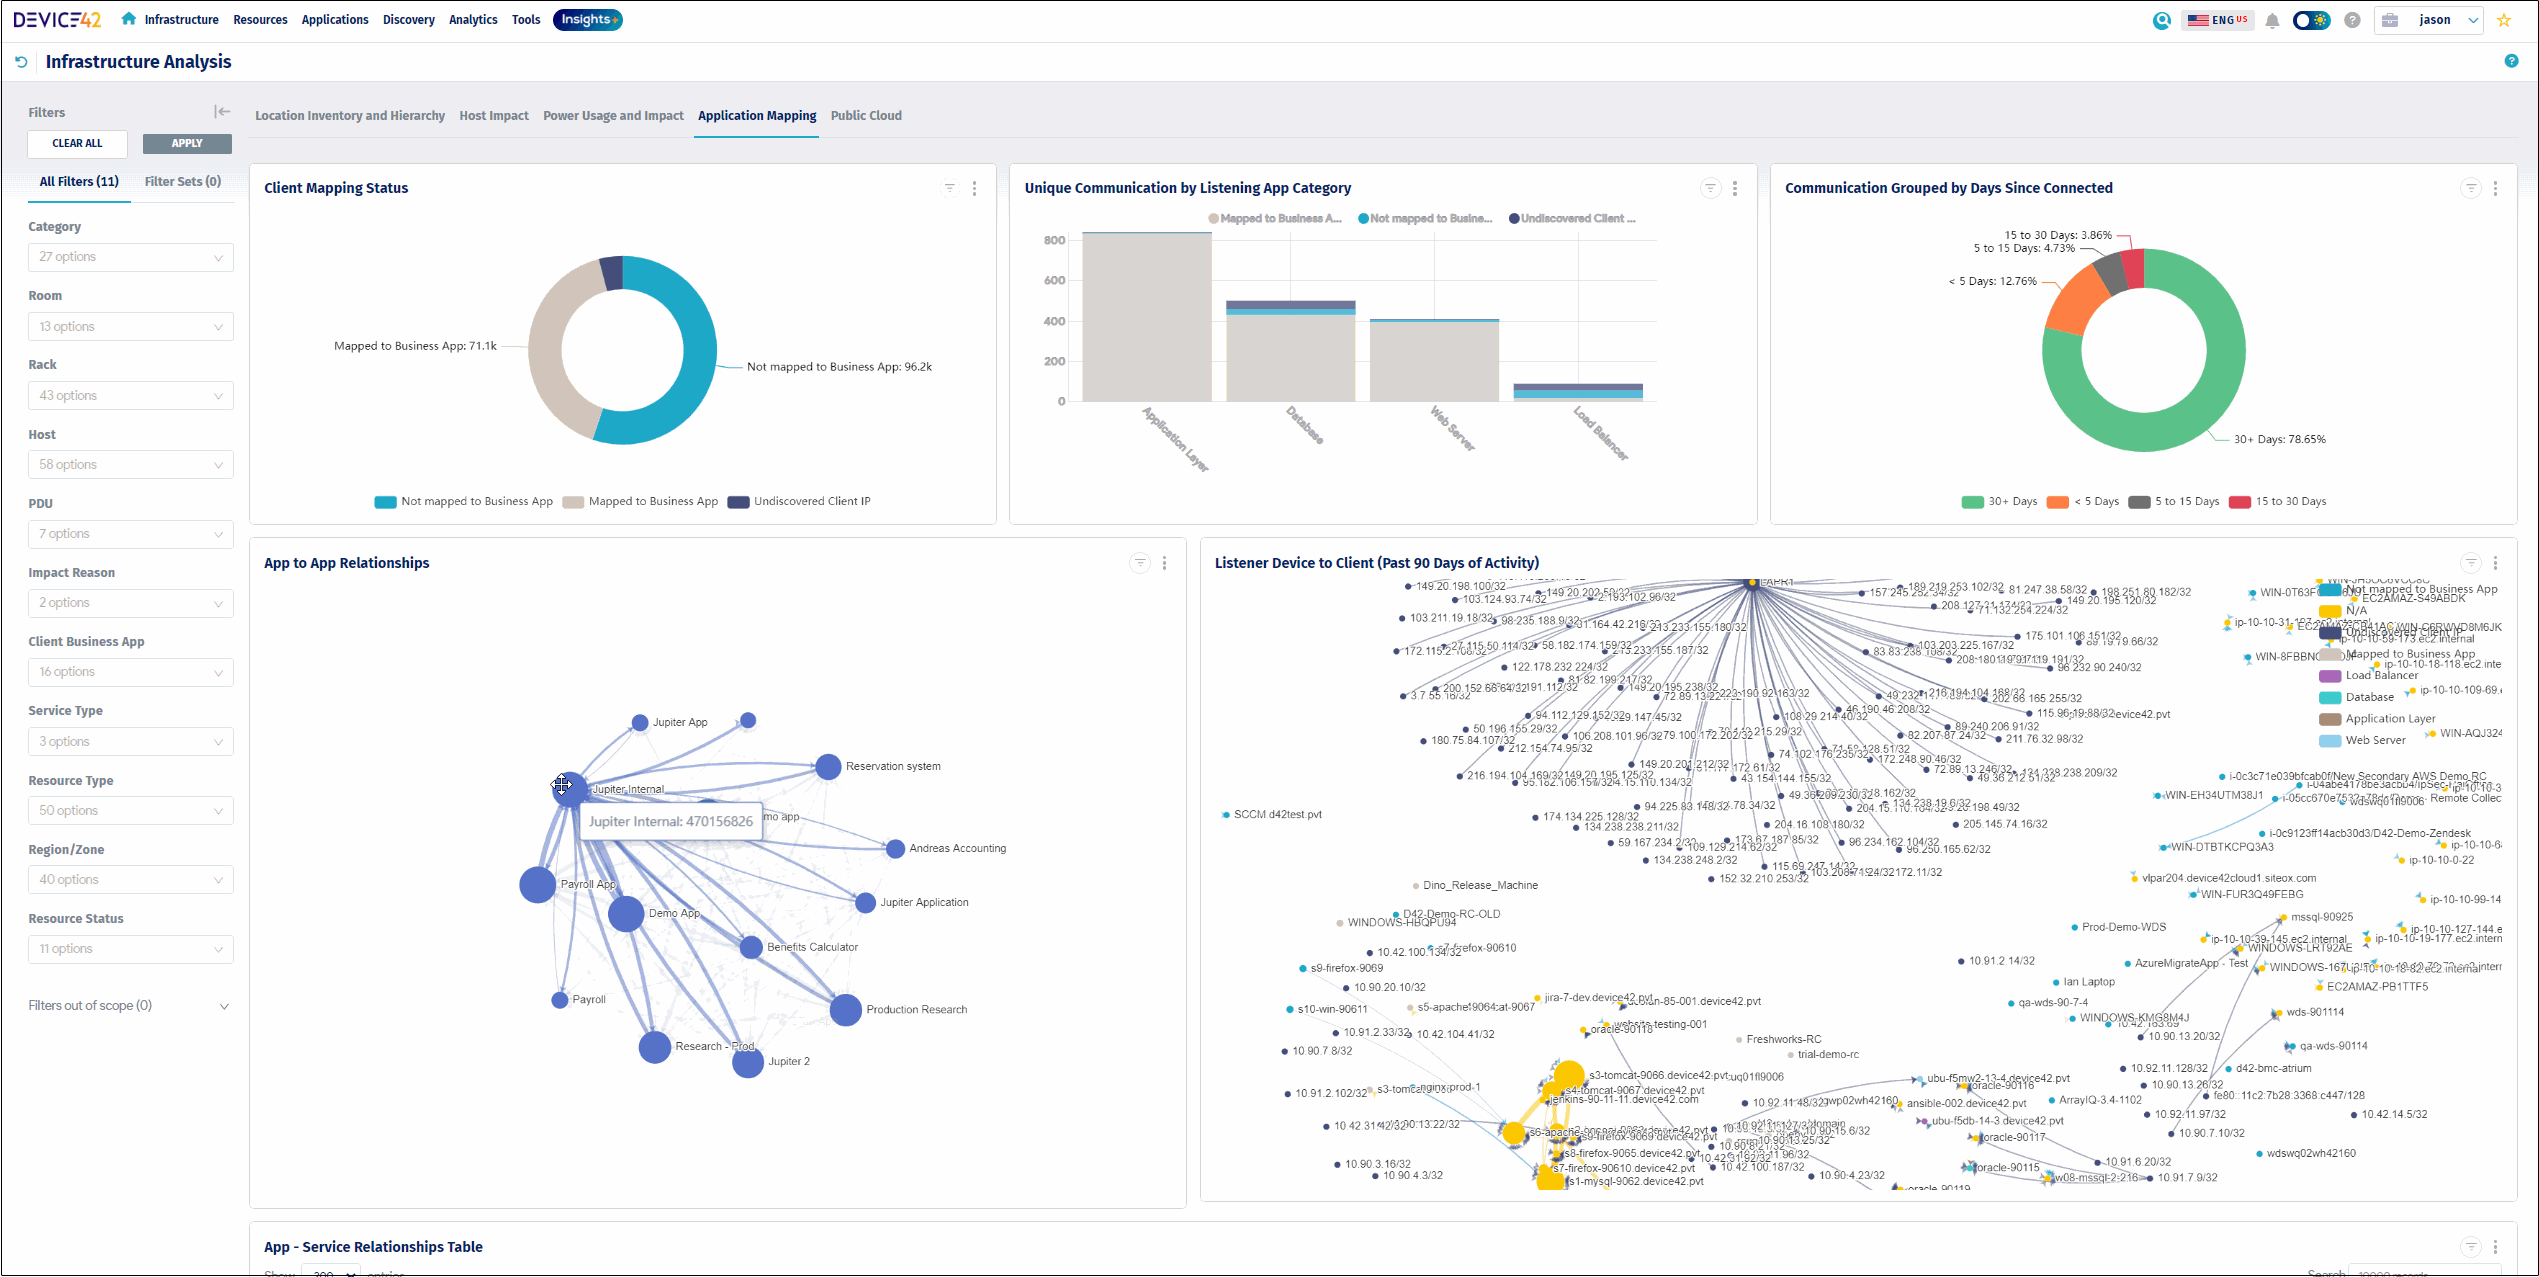
9. Device42

Device42, now a Freshworks company, is an agentless discovery and CMDB platform that maps application and infrastructure dependencies across hybrid and multi-cloud environments. Its native application dependency mapping builds Business Services and Application Groups by automatically grouping assets based on real communication patterns, using configurable calculation rules. Automated Service Discovery identifies active services, ports, and connections across on-premises, cloud, and hybrid systems, and it can collect dependency data without configuring span ports. Impact Charts and Impact Lists visualize upstream and downstream relationships to show how a change or outage ripples across the environment. The resulting data supports incident response, change management, compliance documentation, and migration planning.
Key features include:
- Automated application dependency mapping: Device42 groups assets based on real communication patterns into Application Groups and Business Services. This produces a map of how applications and infrastructure connect.
- Application Group calculation rules: Rules define group membership using criteria such as service type, server inclusion, and start or end points, and a timeline view tracks changes over time. This keeps groups aligned with the environment.
- Automated service discovery: The platform identifies active services, ports, and connections across on-premises, cloud, and hybrid systems and recognizes which communication patterns matter. It can gather dependency data without configuring span ports.
- Impact Charts and Impact Lists: Auto-generated charts and lists show upstream and downstream service connections and the ripple effects of a change or outage. This supports impact analysis before changes.
- Agentless discovery and CMDB: Agentless discovery using protocols such as WMI, SSH, and SNMP feeds a CMDB, with more than 30 integrations and a REST API for moving data in and out. This consolidates asset and dependency data.
- Migration support: Dependency data helps plan cloud migrations with fewer surprises and identifies legacy, orphaned, or redundant systems for consolidation or retirement.
Limitations (as reported by users on PeerSpot):
- Learning curve: The platform can be complex to set up and navigate at first, particularly for smaller teams.
- Performance at scale: Slowdowns are reported when handling large data volumes or large-scale deployments.
- Bulk operations and upgrades: Bulk deletion of assets is time-consuming, and upgrades are manual and require significant effort.
- Kubernetes and scalability: Kubernetes integration is reported as limited at high node counts.
- Reporting and documentation: Reporting capabilities and documentation are cited as areas needing improvement.

Source: Device42
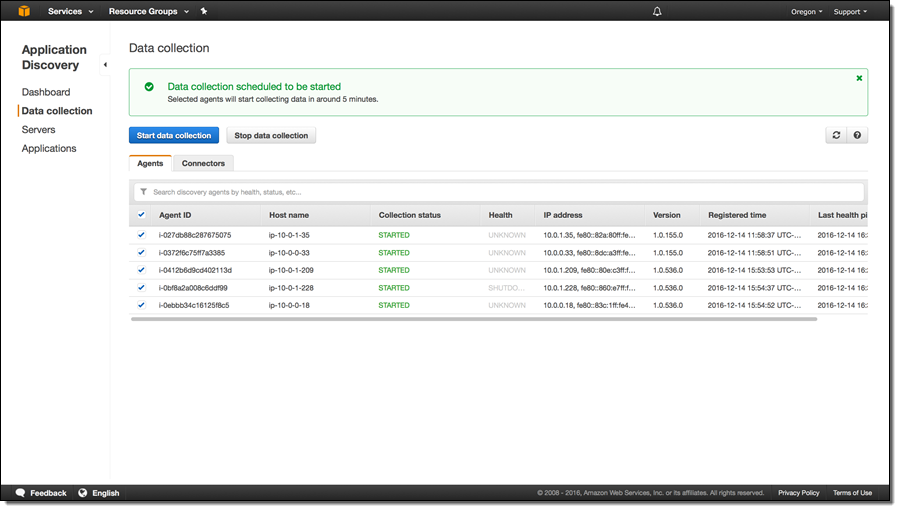
10. AWS Transform

AWS Transform is an agentic AI service for cloud migration and modernization that automates application discovery and dependency mapping as part of planning a move to AWS. It is the successor to AWS Application Discovery Service, which is no longer open to new customers. Its AI agents discover on-premises environments—including VMware, bare metal, Hyper-V, and databases—collect server specifications and network connections, and analyze application dependencies to group workloads into migration waves. The service generates network configurations such as VPCs, subnets, and transit gateways, produces migration plans, and supports rehosting to Amazon EC2 or replatforming to containers. Dependency mapping in AWS Transform is oriented toward migration wave planning rather than continuous operational monitoring.
Key features include:
- Automated discovery and dependency mapping: AWS Transform discovers on-premises environments and analyzes application dependencies to inform wave planning. It supports several ingestion formats, including RVTools and Migration Evaluator exports, so data can come from different sources.
- Migration wave planning: AI agents group workloads into dependency-aware migration waves based on technical constraints and business priorities. This is intended to minimize disruption and preserve application integrity during cutover.
- Network conversion: The service converts on-premises network configurations into AWS constructs such as VPCs, subnets, and transit gateways, and it outputs infrastructure-as-code in CloudFormation, CDK, Terraform, and Landing Zone Accelerator formats.
- Landing zone creation: AWS Transform generates Landing Zone Accelerator configurations to establish secure, multi-account AWS environments before workloads move. This sets up network isolation, encryption, and governance up front.
- Rehost or replatform: Workloads can be rehosted to Amazon EC2 or replatformed to Amazon ECS or EKS within the same workflow, with automated replication, testing, and cutover orchestration.
- Collaborative workspace with human-in-the-loop: A shared workspace brings teams together with AI agents, and artifacts are validated before execution. The service supports first-party, partner, and custom agent workflows.
Limitations (based on publicly available sources):
- Migration-oriented scope: Dependency mapping is part of a migration workflow targeting AWS rather than a continuous, standalone operational mapping tool.
- Job scope constraints: A VMware migration job targets a single AWS account and Region, NSX imports are supported only for end-to-end jobs, and concurrent network migrations for the same account and Region can conflict.
- Restart behavior: Stopping and then restarting a migration job restarts it from the beginning, losing in-progress work.
- Licensing and tenancy limits: The service does not support EC2 Dedicated Hosts or the Bring Your Own License model during migration.
- Human validation required: AI-generated network and migration configurations must be validated for security and compliance, and advanced code, such as advanced T-SQL, may need manual review or refactoring.

Source: Amazon
Conclusion
Application dependency mapping has become essential in today’s complex IT environments. Whether you are planning a cloud migration, enhancing your security posture, or improving IT governance, the right Application Dependency Mapping (ADM) solution can significantly reduce risk and accelerate decision-making. Solutions that provide agentless, real-time visibility, passive discovery, and extensive integration support are particularly effective. They simplify deployment and maintenance while offering valuable insights into the relationships between infrastructure and applications. For organizations aiming to achieve maximum value with minimal disruption, this approach enables the agility and clarity needed by modern IT teams.


