What Is ManageEngine Applications Manager?
ManageEngine Applications Manager is an application performance monitoring (APM) solution that helps organizations improve performance and availability of applications and the underlying infrastructure. It provides visibility into the health, performance, and user experience of critical business applications across various environments, including on-premises, cloud, and hybrid setups.
The software supports web applications, servers, databases, cloud services, virtualization platforms, and container technologies. It enables IT teams to detect, diagnose, and resolve application performance issues before they impact business operations.
ManageEngine Applications Manager provides an easy-to-use interface that simplifies the task of managing application performance. It supports proactive monitoring with real-time alerts and automated actions for quick issue resolution.
This is part of an extensive series of guides about cybersecurity
Key Features of ManageEngine Applications Manager
ManageEngine Applications Manager offers the following capabilities:
- Application performance monitoring: Allows IT and DevOps teams to troubleshoot and optimize application performance in real time. By providing code-level insights, distributed transaction tracing, and application service maps, it enables quick identification and resolution of performance bottlenecks.
- Real user monitoring (RUM): Analyzes the performance of web applications from the perspective of the end-user. It captures and analyzes every transaction by real users, providing insights into network, front-end, and back-end response times. This allows IT teams to understand how factors such as geographical location, browser type, device type, and internet service providers affect the user experience.
- Automated discovery and dependency mapping: Enables organizations to automatically identify and map the relationships between various applications and services within their IT environment. This feature creates a dynamic, real-time dependency map that visualizes how different components interact with each other.
- Container monitoring: Provides visibility into Docker, Kubernetes, and Red Hat OpenShift container environments. It helps in proactively identifying outages and pinpointing server issues with detailed root cause analysis capabilities. This helps prevent resource overloads.
- Synthetic transaction monitoring: Allows IT teams to simulate user interactions with web applications to test the performance of critical user paths. It uses Selenium for scripting tests, which can be run from real browsers like Chrome and Firefox. By performing checks from multiple locations, including enterprise branch offices or actual customer locations, teams can ensure consistent application performance across all touchpoints.
ManageEngine Applications Manager Editions and Pricing
ManageEngine Applications Manager is available in three editions: Free, Professional, and Enterprise. Each of the paid editions provides a 30-day free trial, after which they require a 1-year commitment.
Free Edition
- Supports: Up to 5 monitors
- Features: Limited monitoring, alerting, and reporting capabilities
- Cost: Free forever
- Suitable for: Small-scale environments or for users who want to explore the basic features of the application
Professional Edition
- Supports: Up to 500 applications based on load
- Features:
- Application Performance Monitoring (APM): Includes byte-code instrumentation for Java, .NET, .NET core, PHP, Node.js, and Python
- Infrastructure Monitoring: Supports servers, databases (Oracle, MS SQL, MongoDB, Cassandra, etc.), in-memory databases, big data stores, application servers, middleware components, web servers, ERP software, virtual servers, container technologies, and cloud platforms
- End User Experience Monitoring: Agent-based synthetic transaction monitoring and real user monitoring (both as add-ons)
- Alerting & Reporting: Static and adaptive thresholds, root cause analysis, anomaly detection, automated actions, integration with IT helpdesk systems, ChatOps integration, and ML-powered forecast reports
- Integrations: With ManageEngine OpManager, Site24x7, Analytics Plus, and AlarmsOne
- General: Automated application discovery, SLA management, user management, admin actions, dashboards, and business views
- Cost: Starts at $395/year
- Suitable for: Small to medium enterprises needing comprehensive monitoring capabilities
Enterprise Edition
- Supports: Over 500 applications, scalable up to 10,000 monitors with a distributed setup
- Features:
- All features of the Professional Edition
- Distributed Monitoring: High scalability with distributed architecture for large-scale deployments
- Failover/Virtual IP: Ensures high availability and reliability of monitoring services
- Cost: Starts at $9595/year
- Suitable for: Large enterprises requiring extensive and scalable monitoring solutions
ManageEngine Applications Manager Limitations
When evaluating ManageEngine Applications Manager, you should be aware of these limitations, reported by users on the G2 platform.
Data Accuracy Issues
Users have reported occasional inaccuracies in the data provided by ManageEngine Applications Manager. The tool sometimes struggles with accurately displaying endpoint resource details, leading to potential discrepancies in the monitoring data.
Complexity and Usability
The user interface, while functional, might be considered complex for beginners. New users often face a steep learning curve, requiring substantial time to become proficient with all features. Additionally, setting up maps and dashboards can be challenging and not intuitive, and the mobile application has limited functionality compared to the desktop version.
Outdated User Interface
The interface of ManageEngine Applications Manager is seen as outdated and not very user-friendly. Users have noted that the software could benefit from a more modern and attractive design to enhance the overall user experience. The current interface design can make navigation cumbersome, leading to slower response times in addressing performance issues.
Documentation and Notification Issues
Users have reported that the ManageEngine documentation can be difficult to follow and might not provide sufficient detail for effective troubleshooting. In addition, the alerting system may also produce inconsistent notifications, leading to delays or missed critical events, which can affect the reliability of monitoring.
ManageEngine Applications Manager Alternatives
Application Dependency Mapping and Visualization Tools
1. Faddom

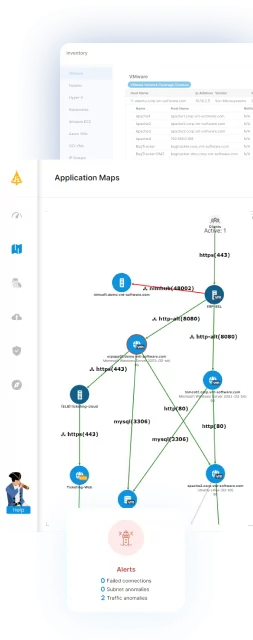
Faddom is an agentless application dependency mapping platform that visualizes on-premises and cloud infrastructure and automatically groups servers into business applications. It uses AI-driven correlation and analysis to turn raw network data into real-time application and dependency maps, and is built to produce a first map within about an hour of deployment. Faddom runs passively and read-only, without agents, credentials, or firewall changes, and keeps all data inside the customer’s environment, working even when offline. Its maps update continuously, 24/7, across hybrid and multi-cloud environments and are platform agnostic. The tool supports use cases such as asset discovery and documentation, change management, data center and cloud migration, resource and cost optimization, IT audit and compliance, and internal attack surface management.
Source: Faddom
Key features include:
- Agentless, passive discovery: Faddom maps an environment without deploying agents, supplying server credentials, or reconfiguring firewalls. Data stays within the customer’s environment, no internet connection is required, and lightweight deployment typically completes in under 60 minutes.
- Real-time dependency mapping: The platform discovers all types of servers, automatically groups them into business applications, and visualizes the dependencies and communication flows between them. Maps update continuously, 24/7, across on-premises, cloud, hybrid, and multi-cloud sources.
- Change management and impact analysis: Teams can track changes across the environment in real time and understand interdependencies before making changes, which supports change-control decisions and migration planning through wave-based execution.
- Cybersecurity and attack surface visibility: Faddom surfaces vulnerabilities and threats with actionable, real-time insights, giving operations and security teams a view of internal exposure across the mapped environment.
- Asset documentation and compliance: The continuously updated map acts as a single source of truth for IT asset documentation, which supports audit processes, compliance, and governance without manual diagram maintenance.
- Faddom AI: AI-driven correlation and analysis converts raw network data into accurate, real-time application and dependency maps, reducing the manual effort of interpreting traffic data.
Limitations (as reported by users on G2):
- Evaluation timelines: Some users note that fully validating the tool in a complex environment during a proof of concept can take a little longer than initially planned.
- Documentation consistency: A few users mention that some setup documentation could be clearer and more consistent across certain deployment scenarios.
- Focused scope: Because Faddom concentrates on agentless mapping and visibility, some users pair it with a separate CMDB or broader observability tool when they need those additional functions.
Learn more about Faddom or start a free trial to the right
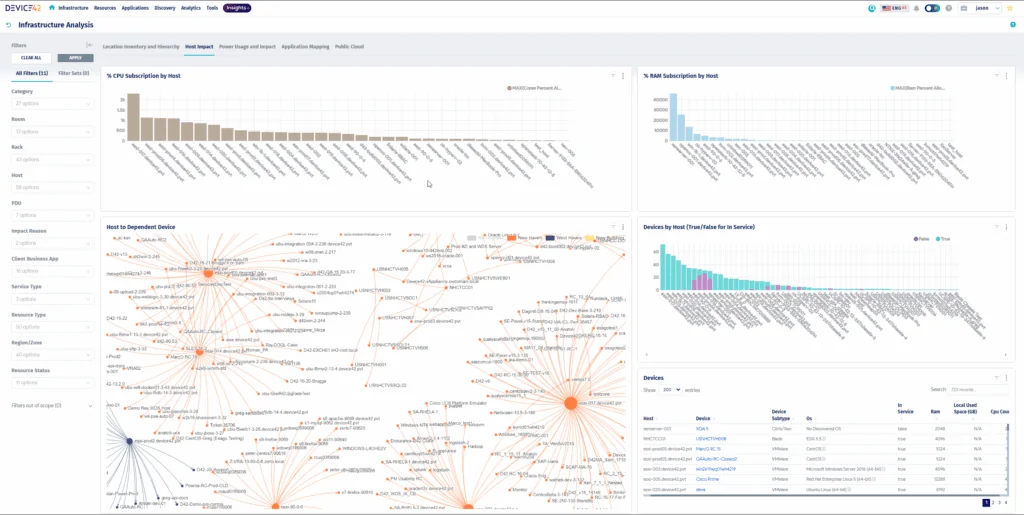
2. Device42
![]()
Device42, now a Freshworks company, is an IT discovery, asset management, and dependency mapping platform with built-in, native application dependency mapping (ADM). It automatically discovers infrastructure across on-premises, cloud, and hybrid environments and maps how applications, services, and devices connect. The ADM module groups assets into Application Groups based on real communication patterns and rolls them up into Business Services. Device42 is part of a broader platform that also includes infrastructure and cloud discovery, a CMDB, IP address management, software license management, SSL certificate management, and storage discovery. It is positioned for incident response, change management and modernization, compliance and audit, and migration planning.
Key features include:
- Application Groups: Device42 automatically maps the environment by grouping assets based on real communication patterns. Calculation rules define what belongs in a group using criteria such as service type, server inclusion, and start or end points, and a timeline view tracks changes over time.
- Business Services: The platform provides a visual representation of how components, devices, and resources combine into business services and applications. Business Services can be built manually or from an Application Group, enriched with metadata such as application type, owners, SLAs, and disaster recovery details, and exported.
- Automated Service Discovery: Device42 identifies active services and the ports they use, and delivers insight into inter-service dependencies across on-premises, cloud, and hybrid environments. Dependency data is collected without configuring span ports.
- Impact Charts and Impact Lists: Auto-generated diagrams illustrate service connections and potential ripple effects, while Impact Lists reveal the upstream and downstream services affected by a given device to assess the scope of an incident or change.
- Discovery and CMDB platform: Beyond ADM, Device42 includes infrastructure and cloud discovery, a near real-time CMDB, IPAM, software license management, SSL certificate management, and storage discovery in a single platform.
Limitations (as reported by users on G2):
- Setup and navigation complexity: Some users report that the platform can feel complex to set up and navigate at first, particularly for smaller teams.
- Performance with large datasets: Occasional performance slowdowns have been reported when handling very large data volumes or many simultaneous requests.
- Manual effort in places: A number of users note that certain workflows still require manual procedures that can be time-consuming.
- Learning curve: The breadth of features can feel overwhelming for new users before they become familiar with the platform.
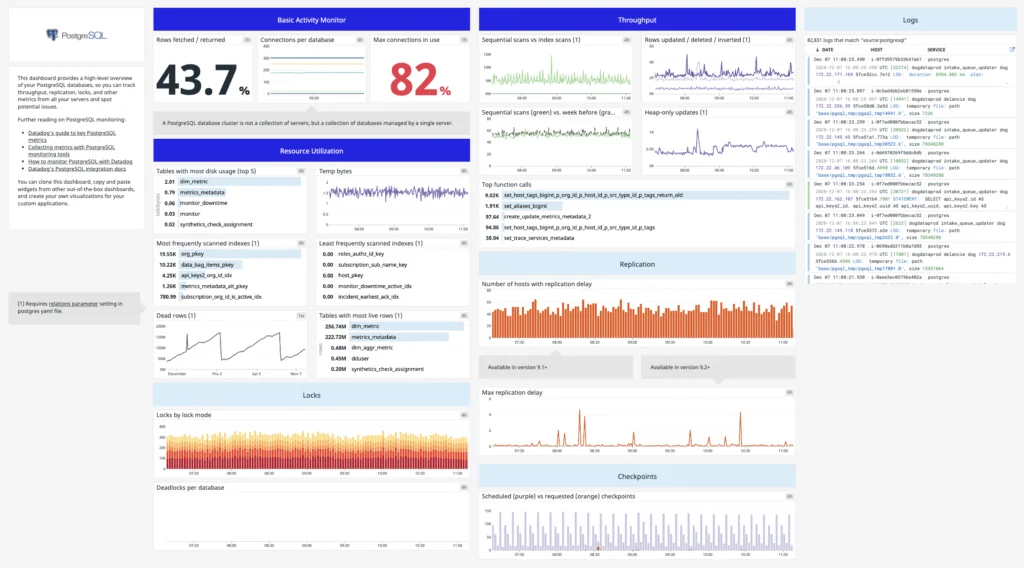
3. Datadog
![]()
Datadog Application Performance Monitoring is part of Datadog’s broader observability platform and provides code-level distributed tracing from browser and mobile applications through backend services and databases. It correlates traces with logs, infrastructure metrics, real user monitoring data, and security signals in a single view, and surfaces service health and dependencies for troubleshooting. Datadog connects application performance to deployments and configuration changes and uses its Watchdog engine for automated anomaly detection and root cause analysis. It supports OpenTelemetry and can instrument services through the Datadog Agent without code changes. The product sits alongside infrastructure monitoring, log management, and real user monitoring within the same platform.
Key features include:
- Thread-level distributed tracing: Datadog identifies the source of issues by correlating traces with logs, infrastructure metrics, database queries, network calls, and front-end telemetry in one view. It exposes the execution time and resource consumption of every method, code line, and thread.
- Service observability and dependencies: A centralized view presents service health metrics and dependencies alongside infrastructure and database telemetry. Teams can set SLOs, monitors, and synthetic tests, and access service owners, on-call engineers, and runbooks through the Software Catalog.
- Change tracking: Performance issues can be correlated with code deployments, feature flags, configuration changes, and database modifications. Error, latency, infrastructure, and profiling metrics can be compared across versions, with automatic detection and auto-rollback workflows, and Error Tracking groups errors into issues.
- Watchdog AI: Datadog’s Watchdog engine performs automated root cause analysis, generates ML-based alerts for anomalies and outliers, and surfaces error and latency outliers at query time.
- Flexible ingestion: Distributed tracing can be set up via the Datadog Agent without code changes or restarts, with fine-grained sampling controls at the host, service, and endpoint level. Datadog supports native and hybrid OpenTelemetry and auto-instruments serverless functions such as AWS Lambda and Azure App Service.
Limitations (as reported by users on G2):
- Cost at scale: Usage-based pricing means costs can rise quickly and unpredictably as hosts, logs, and metrics grow, and the gap between log ingestion and indexing can force teams to make data-retention tradeoffs.
- Pricing transparency: Some users find the billing model and cost forecasting complex to navigate.
- Learning curve and interface: Because the platform spans many areas such as security, CI visibility, and real user monitoring, the interface can feel cluttered and overwhelming for new team members.
- Configuration complexity: Some advanced features require strong technical knowledge to configure.
Application Performance Monitoring (APM) Tools
4. New Relic APM

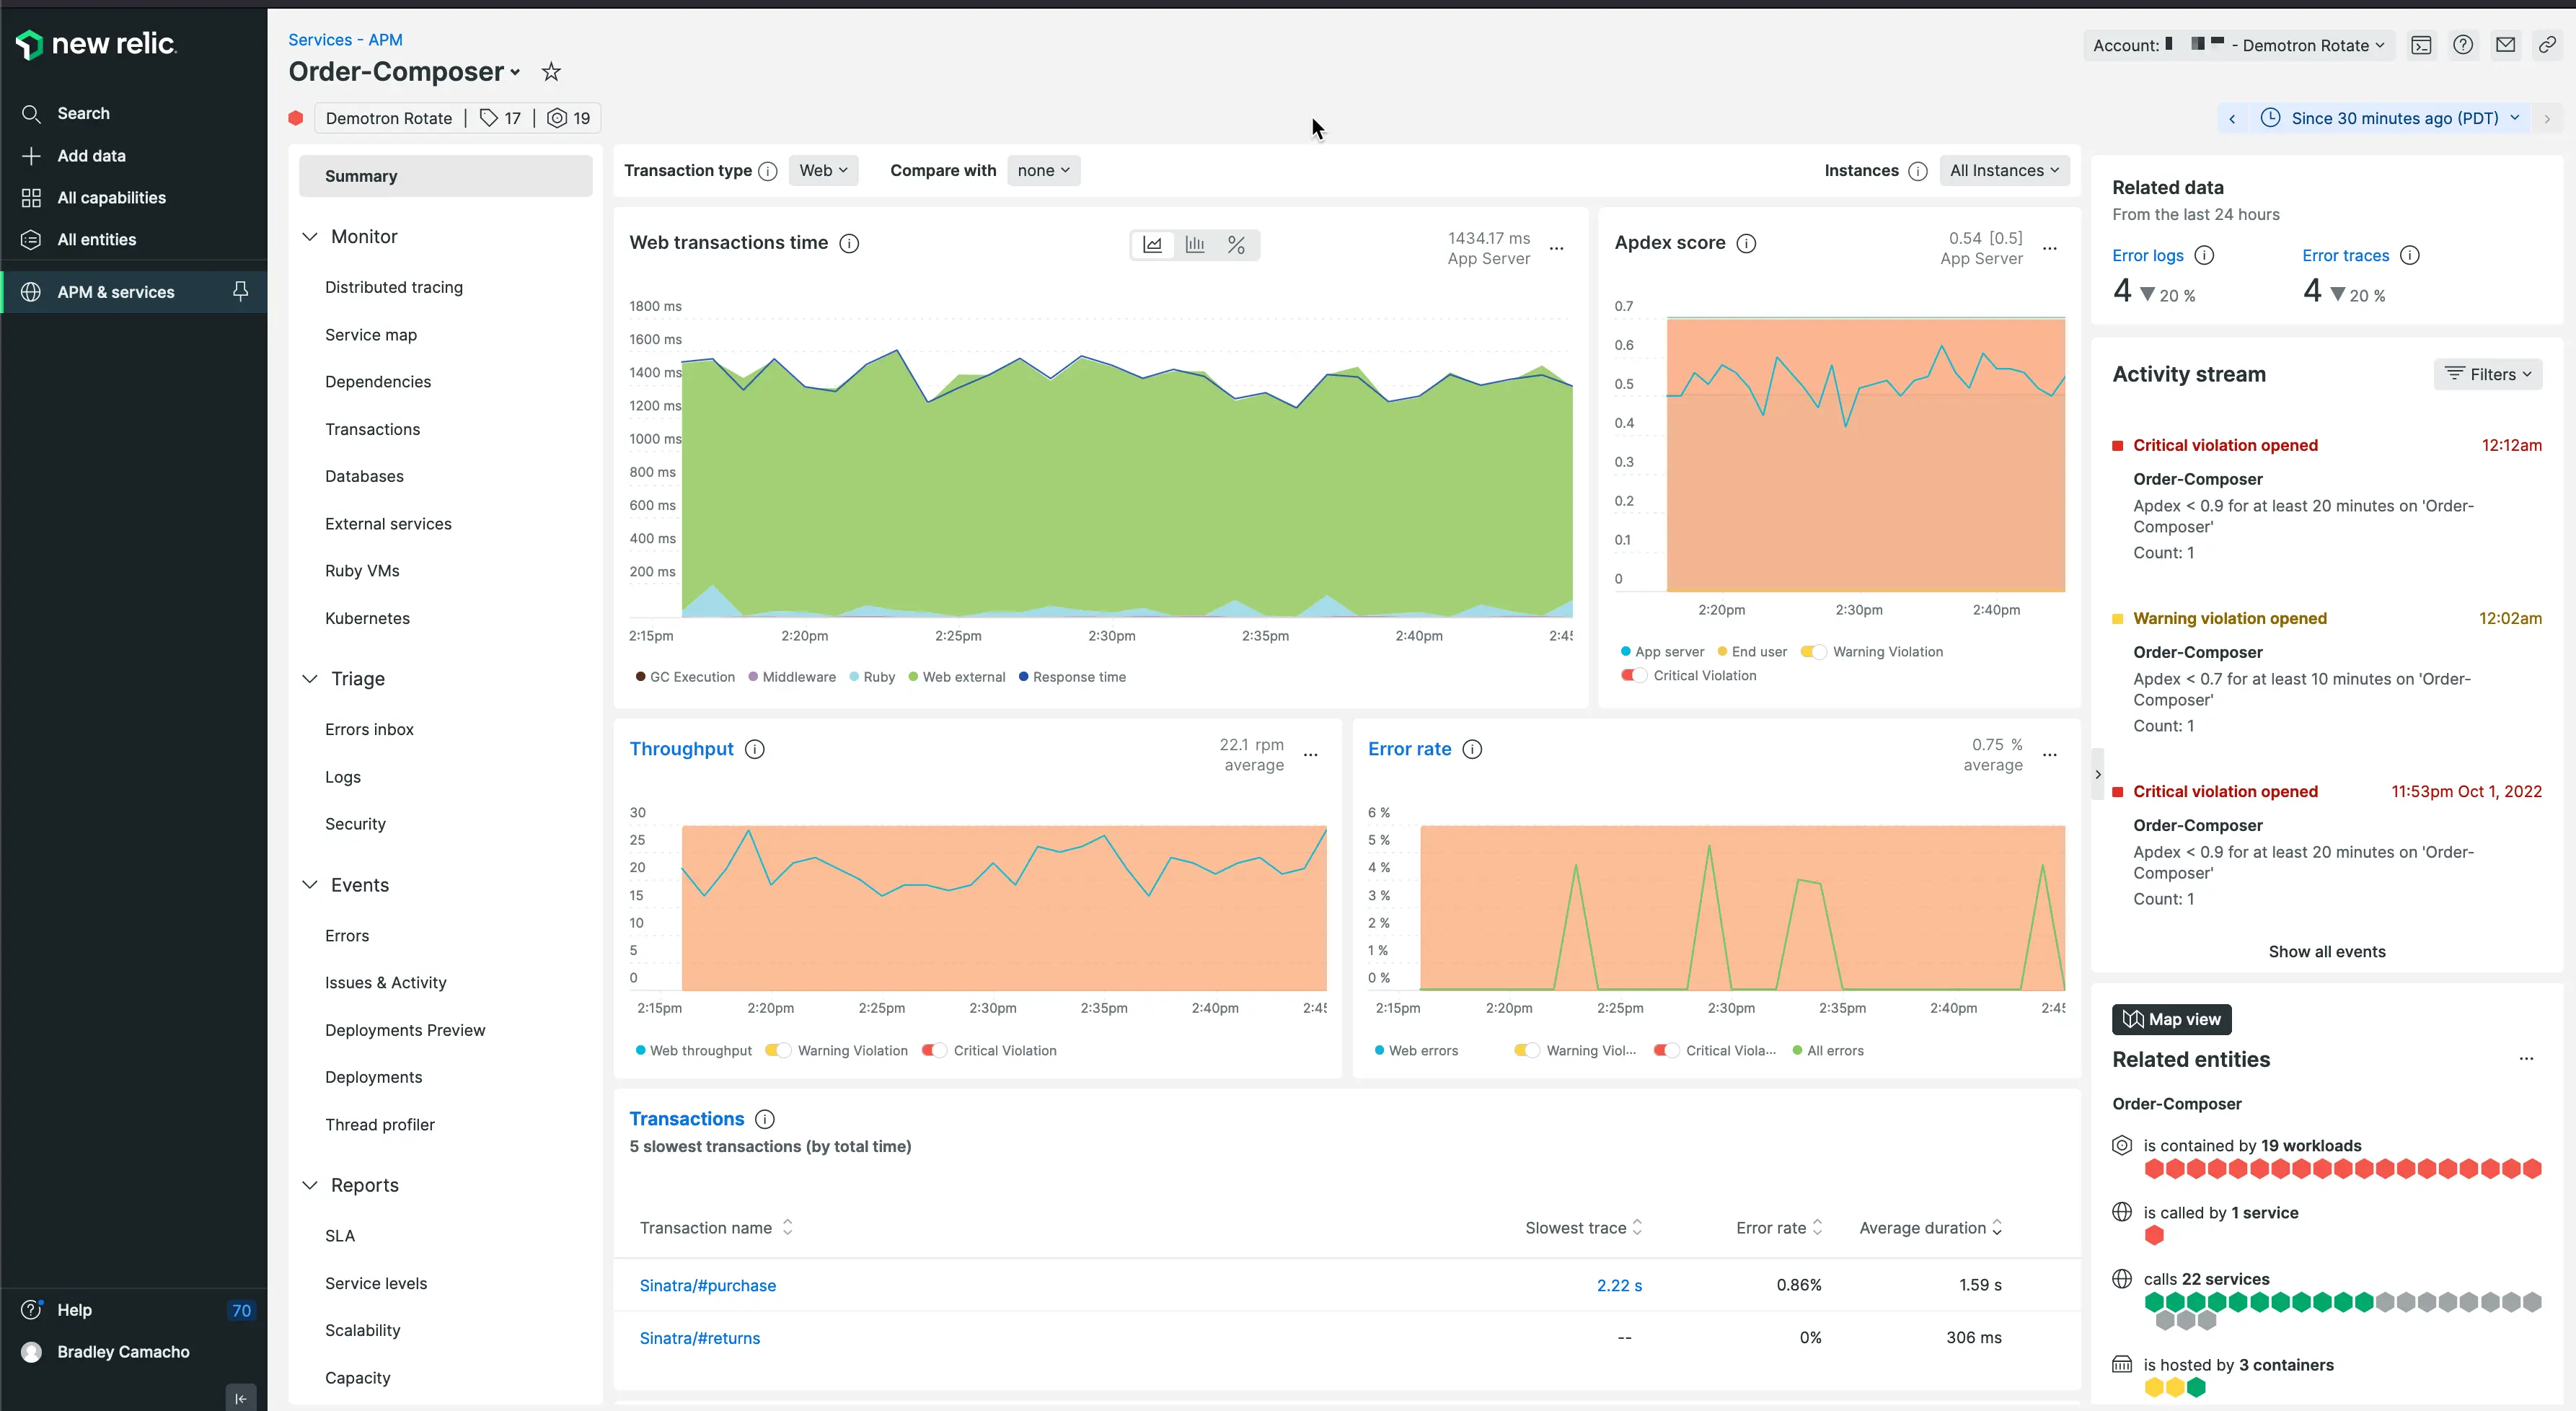
New Relic APM, part of New Relic’s all-in-one observability platform and marketed as APM 360, provides end-to-end visibility across applications and services, from the browser and front-end through application code to infrastructure. It offers at-a-glance health metrics, code-level insights, distributed tracing, and tools that connect technical performance to business processes. New Relic can be instrumented with its own agents, no-code eAPM (including for Kubernetes workloads), or OpenTelemetry, and it connects to more than 780 integrations. The product combines APM with browser monitoring, synthetic checks, error tracking, and alerting in a single interface, and aims to move teams from incident response toward proactive monitoring.
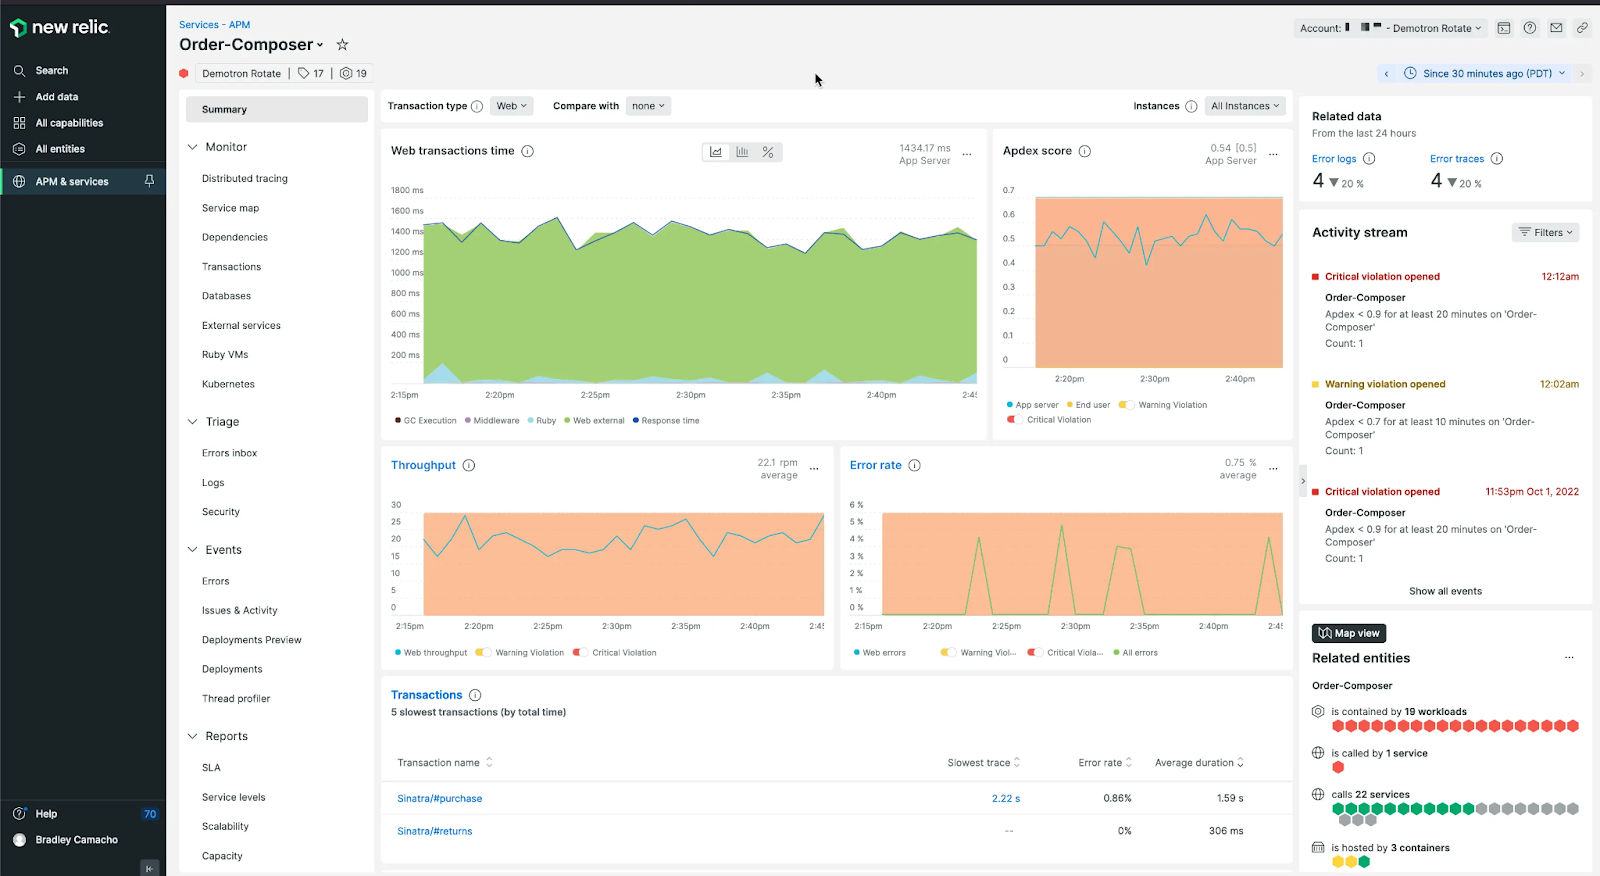
Source: New Relic
Key features include:
- Full-stack performance views: New Relic delivers code-level insights from the browser to infrastructure and presents infrastructure metrics, error user-impact views, and log patterns within the APM interface to help detect root causes.
- Transaction 360: This capability provides a dynamic view of the application stack impacting key transactions and monitors every service and infrastructure component involved in a specific business process as a single, cohesive workload.
- Distributed tracing and dependency visualization: Teams can visualize the path of any service request, monitor golden metrics, and use intelligent recommendations that automatically map the dependencies of critical business processes.
- Flexible instrumentation: New Relic supports its own agents, no-code eAPM instrumentation for Kubernetes workloads, and full OpenTelemetry ingestion, alongside more than 780 integrations.
- User experience and SLOs: The platform includes key transaction tracking, synthetic checks, and browser monitoring, and lets teams track SLOs and business KPIs in real time with alerts and error tracking.
- Deployment and change tracking: Users can track the impact of deployments and changes on performance, gain visibility into application vulnerabilities, and bring telemetry into the IDE through CodeStream.
Limitations (as reported by users on G2):
- Pricing: Usage- and data-ingestion-based pricing with multiple tiers means costs can climb and be difficult to predict, which some users find prohibitive for smaller teams.
- Setup complexity: Initial configuration can be challenging, particularly when instrumenting legacy applications.
- Learning curve: The volume of features and data can feel overwhelming for newcomers, and some users find the dashboard navigation could be more intuitive.
- Customization limits: Some users report limited customization in certain areas and occasional integration friction.
5. Dynatrace
![]()
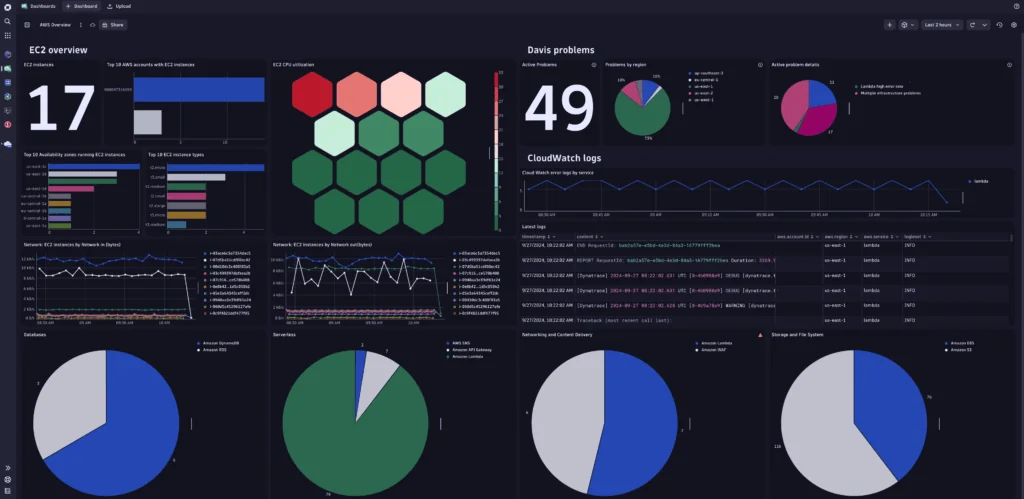
Dynatrace is a full-stack application monitoring and observability platform that measures application performance, availability, and user experience across hybrid and multi-cloud environments. It automatically detects application dependencies and tracks transactions across all tiers, and uses artificial intelligence to detect anomalies and identify root causes down to individual lines of code. Dynatrace continuously auto-discovers and maps applications and transaction flows without manual configuration, and combines real user monitoring with synthetic monitoring to track customer journeys end to end. It covers a broad range of technologies, including major clouds, operating systems, databases, containers, and Kubernetes, and is designed to scale to large environments.
Key features include:
- Full-stack monitoring: Dynatrace covers the front-end, back-end, infrastructure, and cloud in one solution, monitoring applications down to the code level with metrics delivered in real time.
- Automatic discovery and dependency detection: The platform auto-detects all application dependencies and continuously auto-discovers and maps applications and transaction flows with no manual configuration.
- AI-driven problem detection: Dynatrace learns how the environment performs and proactively detects anomalies, analyzing large volumes of events to indicate where and why applications break and delivering a single problem notification with the root cause.
- Business transaction analysis: It provides full insight into response times, threading, database calls, and complexity, and can pinpoint problems down to individual lines of code.
- Real user and synthetic monitoring: Integrated user-experience metrics from both real users and synthetic monitoring enable proactive monitoring of web and mobile apps, with each customer journey tracked end to end.
- Broad technology coverage: Dynatrace supports a wide range of technologies, including AWS, Azure, Google Cloud, Oracle Cloud, Java, .NET, Node.js, PHP, containers, Red Hat OpenShift, and VMware.
Limitations (as reported by users on G2):
- Learning curve: Many users report that the platform requires significant training and time investment, with configuration that can demand specialized expertise.
- Cost: Dynatrace can be expensive, particularly for smaller teams and startups, and data-unit-based ingestion pricing can add cost complexity on top of host-based pricing.
- Complexity and interface: The breadth of features can overwhelm new users, and some find the navigation and use of screen space less intuitive.
- Documentation gaps: Some users report documentation that is outdated for specific frameworks, requiring trial and error.
6. Site24x7

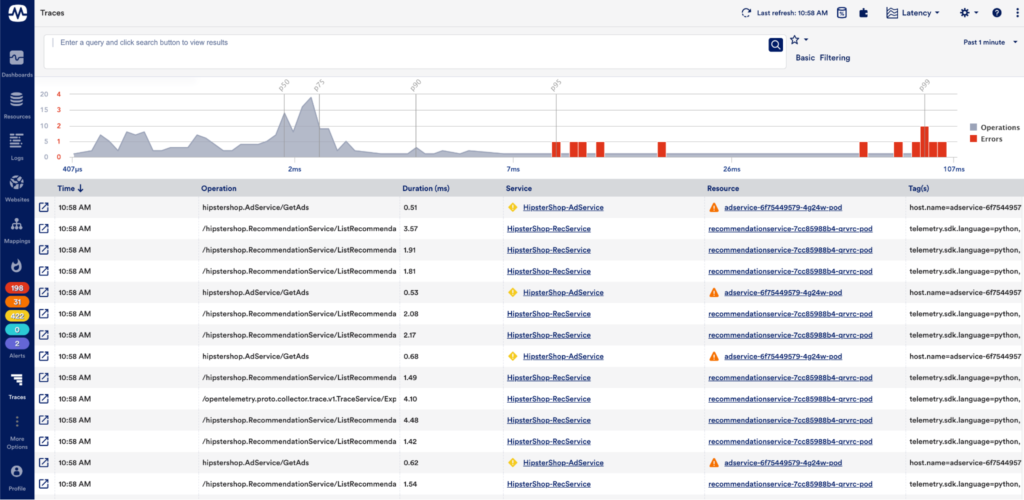
Site24x7 APM Insight is an application performance monitoring tool that provides code-level visibility across cloud, on-premises, and hybrid environments, with support for Java, .NET, PHP, Ruby, Node.js, Python, and Go through lightweight agents that deploy in minutes. It maps application architecture and interdependencies, traces transactions across distributed systems with thread-level tracing, and uses AI-driven anomaly detection to surface root causes. Site24x7 is OpenTelemetry-native and correlates application metrics with infrastructure health and real-user experience. The APM tool is part of a broader monitoring suite that also covers servers, networks, databases, cloud platforms, and digital experience monitoring.
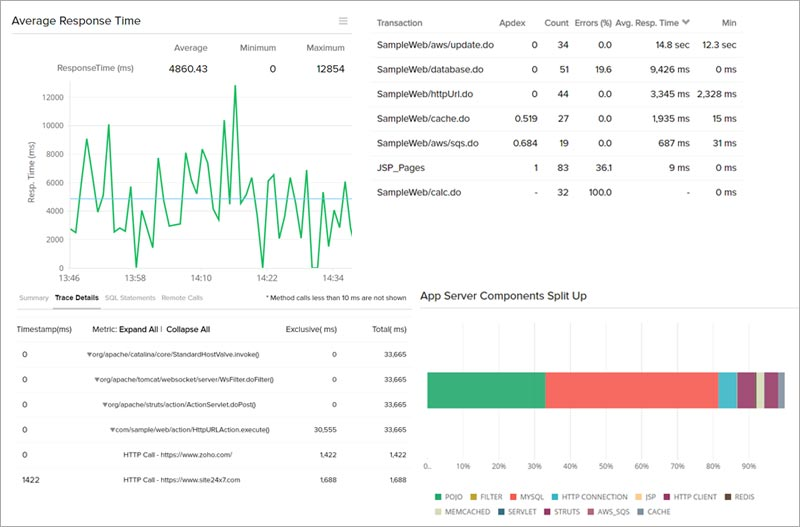
Source: Site24x7
Key features include:
- Application dependency mapping and service topology: Site24x7 provides an overview of application architecture and the interdependencies between services, databases, and external resources, using automated topology discovery to isolate the source of transaction failures or degraded components.
- Thread-level distributed tracing: The tool observes web transactions end to end across microservices, pinpoints slow code segments, database queries, and methods, and correlates traces with logs and front-end and back-end metrics in a single view.
- AI-powered anomaly detection and alerting: AI-driven algorithms detect unusual patterns and performance deviations, trace root cause down to the line of code, and prioritize alerts to reduce alert fatigue.
- Release and deployment monitoring: Teams can compare application performance metrics before and after deployments, monitor the impact of code changes and feature flags, and detect post-deployment regressions.
- OpenTelemetry integration: Site24x7 integrates with any OpenTelemetry-supported language or framework to ingest traces, metrics, and logs, and correlates that telemetry with alerts and root cause analysis without vendor lock-in.
- Multi-language and container support: It supports Java, .NET, PHP, Ruby, Node.js, Python, and Go, and monitors Docker containers and Kubernetes clusters with automatic discovery of new services as they scale.
Limitations (as reported by users on G2):
- Interface: Some users find the interface dated and cluttered and report that locating specific advanced settings can be difficult, with the feature density feeling overwhelming for new users.
- Alert noise: Default thresholds can be too sensitive, producing repetitive notifications for a single incident unless thresholds are fine-tuned early on.
- Pricing structure: The pricing model can be complex to navigate as monitors and add-ons are added.
- Resource requirements: The on-premises poller has notable RAM requirements that some users find restrictive depending on available infrastructure.
Infrastructure and Network Monitoring Tools
7. LogicMonitor
LogicMonitor, whose observability platform is branded LM Envision, is a hybrid observability platform that monitors infrastructure, networks, servers, cloud, and applications in a single view, with application performance monitoring built on distributed traces, custom metrics, and synthetic checks. Its APM capabilities use OpenTelemetry-powered tracing with auto-instrumentation for Java, .NET, and Python, plus AI-assisted correlation that maps services and connects spans to surface root cause. The platform spans on-premises, cloud, and hybrid environments and offers more than 3,000 integrations. LogicMonitor’s Edwin AI links traces, metrics, and logs to cut alert noise and speed troubleshooting across teams.

Source: LogicMonitor
Key features include:
- Distributed tracing: LogicMonitor tracks transactions across services, APIs, and hybrid environments with OpenTelemetry-powered tracing, auto-instruments Java, .NET, and Python, and follows each transaction from start to finish to show where slowdowns occur.
- Metrics and KPIs: The platform monitors high-level business KPIs and granular technical indicators such as latency, error rates, and throughput, and ingests data via the PushMetrics API or OpenMetrics endpoints without custom scripts.
- Synthetic monitoring: Synthetic tests run from global locations to verify that critical paths are available and fast, detecting latency and availability issues before they affect real users.
- AI-powered correlation and dependency mapping: Automated service mapping and span-level correlation, surfaced through service maps, help visualize what is connected and impacted, while Edwin AI links signals to reduce alert noise and identify root cause.
- Broad infrastructure and platform coverage: Alongside APM, LogicMonitor provides network, server, VM, storage, database, container, and cloud monitoring, with more than 3,000 integrations and a collector-based, API-friendly architecture.
Limitations (as reported by users on G2):
- Learning curve: Advanced features such as custom DataSources and LogicModules can require training or scripting, and configuration and tuning can be laborious.
- Cost: LogicMonitor can be expensive, particularly for smaller teams with limited budgets, and some users find licensing and cost forecasting difficult.
- Initial setup and interface: Setup can feel complex at first, and some users feel the interface could be more intuitive for new users.
- Feature and integration gaps: Some users report integration gaps with legacy systems and occasional data latency.
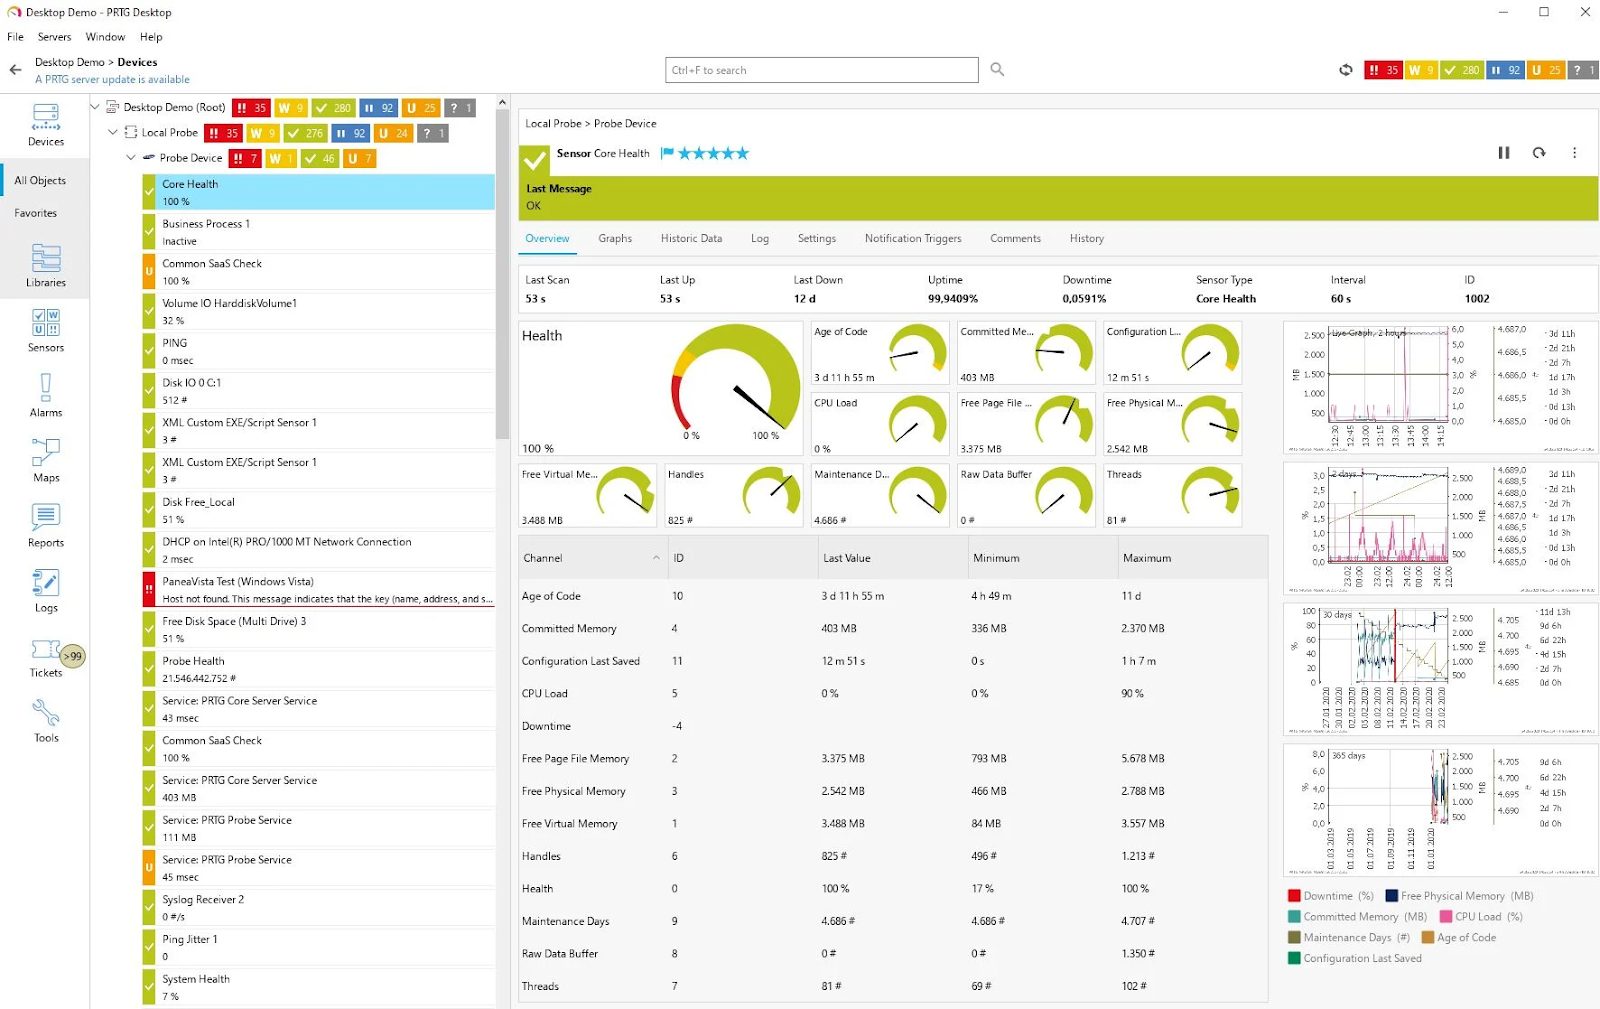
8. PRTG
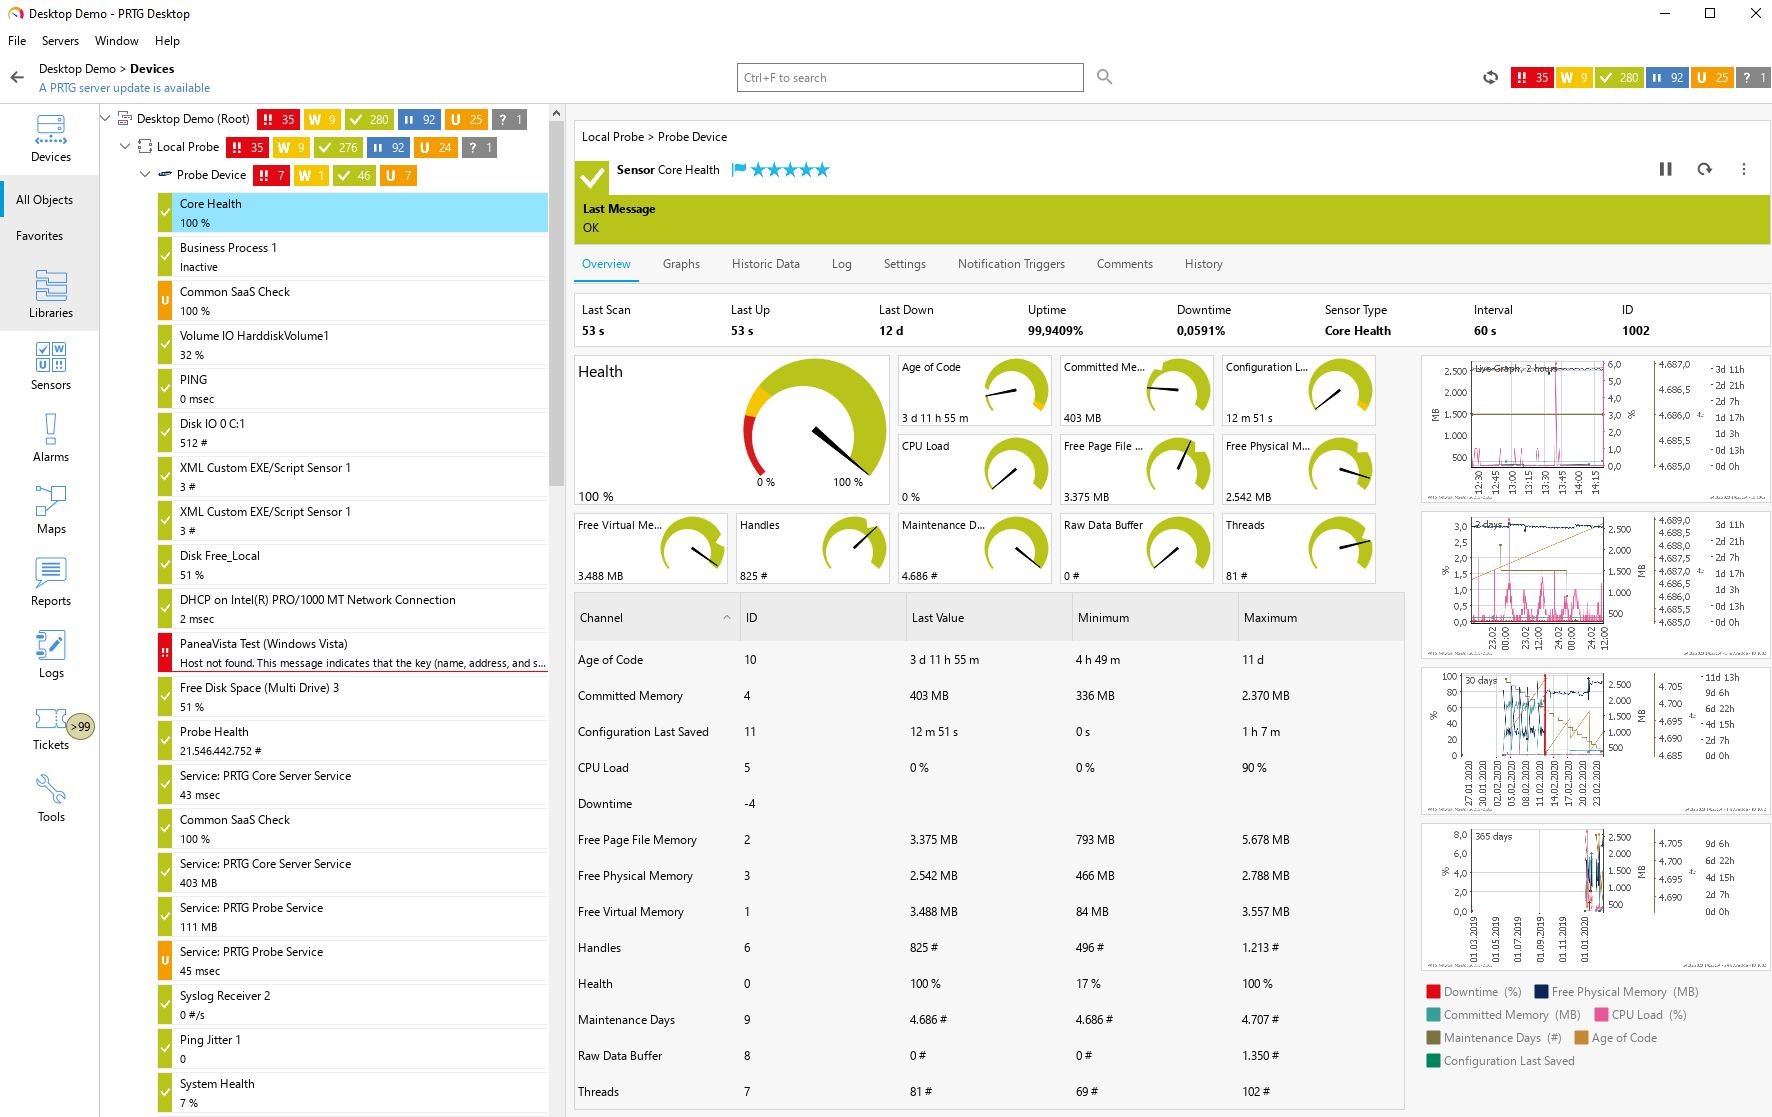
Paessler PRTG is an all-in-one infrastructure monitoring tool that tracks the systems, devices, traffic, and applications across an IT environment. It uses a sensor-based model in which each monitored metric is configured as a sensor, with a library of predefined sensors and the ability to create custom sensors through the HTTP API. PRTG monitors networks, servers, databases (via configured sensors and SQL queries), applications, cloud services, LANs, and SNMP devices, and presents status through real-time maps and dashboards. It includes configurable alerts and notifications, distributed monitoring, and customizable reporting, and is available as PRTG Network Monitor, PRTG Enterprise Monitor, and PRTG Hosted Monitor.
Source: Paessler
Key features include:
- Broad infrastructure monitoring: PRTG monitors networks, servers, databases, applications, cloud services, LANs, and SNMP devices, tracking availability, capacity, and reliability across the IT infrastructure.
- Sensor-based architecture: Each monitored metric is configured as a sensor, with a library of predefined PRTG sensors and the ability to build custom sensors through the HTTP API for specific needs.
- Maps and dashboards: Real-time maps display live status information, and the PRTG map designer lets teams build dashboards and network maps that visualize the environment.
- Alerts and notifications: Users can set custom thresholds for performance metrics and receive alerts through built-in notification methods such as email, push notifications, and HTTP requests.
- Multiple interfaces and distributed monitoring: PRTG offers a web interface, a desktop app for editing multiple objects at once, and iOS and Android apps, along with distributed monitoring and customizable reporting.
Limitations (as reported by users on G2):
- Sensor-based licensing cost: Because each metric counts as a separate sensor, license limits can be reached faster than expected, and costs can rise as environments scale.
- Configuration complexity: Initial setup for complex infrastructures can feel overwhelming, and advanced customization such as custom sensors and scripts requires deeper technical knowledge.
- Interface performance: The web interface can feel sluggish or overloaded when managing large deployments, and some users consider the UI dated.
- Customization limits: Some users report that dashboard and map customization can feel limited.
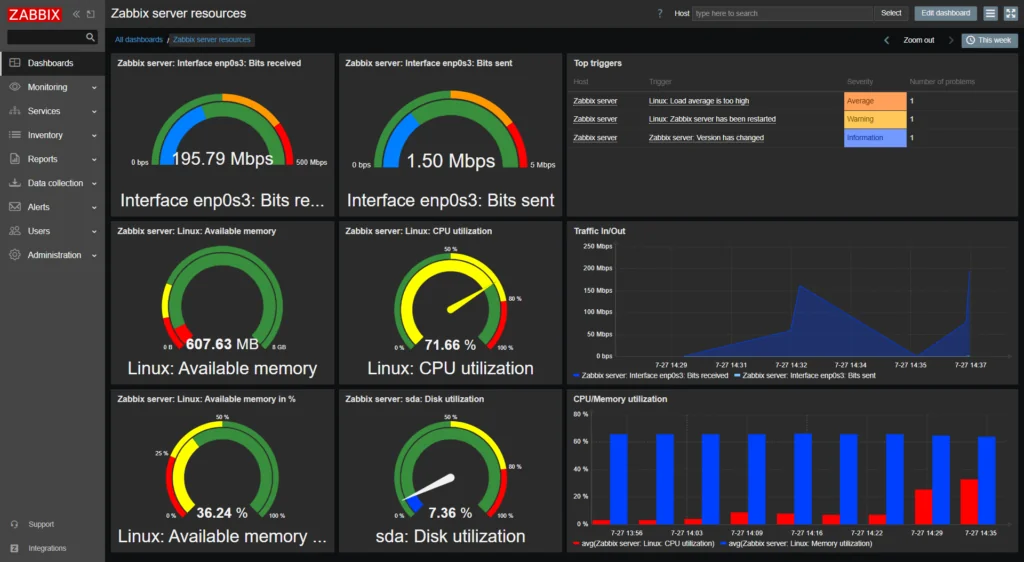
9. Zabbix

Zabbix is an open-source enterprise monitoring platform that collects, processes, and visualizes data from networks, servers, cloud services, containers, virtual machines, applications, services, databases, and IoT devices. It supports both agent-based monitoring, through a native agent for all major operating systems, and agentless monitoring using protocols such as SNMP, IPMI, SSH/Telnet, ODBC, ICMP/TCP, HTTP, and Prometheus, plus synthetic web monitoring. Zabbix detects problems with flexible thresholds, anomaly detection, and trend prediction, and supports alerting, escalation, and auto-remediation. It scales through distributed monitoring with proxies and high availability, and is extensible via custom scripts, plugins, and an API.
Key features include:
- Flexible metric collection: Zabbix collects metrics through agent-based and agentless methods, including SNMP, IPMI, SSH/Telnet, ODBC, ICMP/TCP, HTTP, Prometheus, and Modbus/MQTT, along with synthetic web monitoring and data transformation for normalizing collected data.
- Problem detection: The platform uses smart, flexible thresholds, baseline-based anomaly detection, and trend prediction and forecasting, and performs root cause analysis through problem correlation.
- Alerting and remediation: Zabbix supports multiple messaging channels such as email, SMS, Slack, MS Teams, Telegram, PagerDuty, and Opsgenie, with escalation scenarios, auto-remediation, and webhooks for ITSM and ticketing systems.
- Visualization and dashboards: Widget-based dashboards, graphs, geo-maps, and infrastructure maps present the environment, with scheduled PDF reports, multi-tenancy, and inventory views.
- Business service and SLA monitoring: Service trees model business services, calculate SLAs, assess business-level impact, and can simulate an outage to show its effect.
- Integrations and scalability: Out-of-the-box templates cover major vendors, ITSM systems, Kubernetes and OpenShift, and clouds such as AWS, Azure, Google Cloud, and Oracle Cloud, with a Zabbix API and distributed monitoring with proxies and high availability for scale.
Limitations (as reported by users on G2):
- Learning curve: Users report a steep learning curve, particularly during initial setup and configuration, with custom items, templates, and scripting requiring technical expertise.
- Interface and dashboards: Some users feel the interface needs modernization and that built-in dashboard and visualization options are limited, leading them to complement Zabbix with Grafana.
- Resource usage at scale: Zabbix can be resource-intensive in large environments with high data volumes, with performance and scaling considerations across many nodes.
- Support model: The software is free and open source, but professional support is a separate paid offering.
Related content: Read our guide to ManageEngine alternatives
Conclusion
ManageEngine Applications Manager is a robust tool that offers extensive capabilities for monitoring and managing application performance across diverse environments. Despite its comprehensive feature set, potential users should be mindful of certain limitations such as data accuracy issues and a potentially steep learning curve. The choice of APM solution should be based on a thorough assessment of organizational needs and a clear strategy for addressing its known challenges.
Learn more about Faddom for resource and cost optimization or start a free trial today!
See Additional Guides on Key Cybersecurity Topics
Together with our content partners, we have authored in-depth guides on several other topics that can also be useful as you explore the world of cybersecurity.
Solarwinds SAM
Authored by Faddom
- [Guide] SolarWinds SAM: Key Features,Pricing, Limitations, and Alternatives
- [Guide] PRTG Network Monitor vs. SolarWinds: 4 Key Differences and How to Choose
Device42
Authored by Faddom
- [Guide] Device42: 5 Key Features, Limitations, and Alternatives
- [Guide] Device42 Pricing: The 5 Pricing Tiers Explained – Faddom
- [Product] Faddom | Instant Application Dependency Mapping Tool
API Security
Authored by Radware
