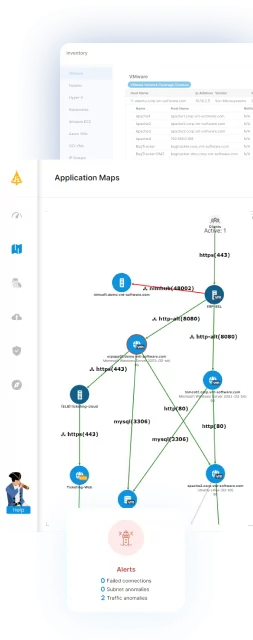
One of the biggest challenges in modern data centers is getting visibility into what is happening on the network. Whether you want to get information on East-West traffic inside the data center, or North-South, in and out, with the sheer complexity and volume of data flowing through modern networks, this can be a daunting task.
To help simplify the monitoring of these environments, NetFlow, sFlow, and similar protocols were introduced to allow consolidated monitoring of network traffic.
Table of Contents
ToggleIn this blog, we will introduce these protocols and give a brief overview of what they do and what the differences between them are.
Looking at NetFlow/IPFIX
The NetFlow protocol was first introduced by Cisco in the mid-1990s and is widely available today. It is supported by network switches and routers from many vendors as well as by some software-defined networks such as VMware vDS switches and Cisco ACI. It was originally a Cisco trademark but has since been superseded by the IPFIX protocol (sometimes referred to as NetFlow v10) which is an IETF standard.
NetFlow is a UDP-based protocol that sends summarized data on the flows that it sees on the network. A NetFlow capable device will aggregate data on each flow that it sees and then send that data, encapsulated in a UDP packet, to a NetFlow Collector.
A unique flow is defined by the 5-Tuple value, containing the following fields:
- Source IP address
- Source port
- Destination IP address
- Destination port, and
- Protocol
A sampling rate may also be optionally set to reduce the load on the device generating NetFlow, having it only analyze one out of a pre-determined number of packets.
The data that is collected on each of these flows depends on the version of the protocol being used, with the earlier versions using a pre-defined record format containing specific fields, and the later versions allowing customizable fields based on templates. Commonly, this data will contain the number of packets, bytes, TCP flags, and interface ids.
The data on all of these flows is stored in memory on the NetFlow Exporter, and it will send data on each flow at each set interval. Usually there are 2 intervals, one for sessions that are active, and another for those that have expired. The Exporter will aggregate approximately 30 of these flows into a single UDP packet, and then send that packet to the Collector.

Understanding sFlow
The sFlow protocol was introduced in 2001 specifically as an alternative to NetFlow. One of the issues that sFlow came to solve is the overhead that generating NetFlow traffic can create on a NetFlow Exporter. The sFlow protocol is meant to have minimal overhead on the Exporter, while still providing the same visibility into the network traffic.
The way that sFlow works is that it samples 1 out of every specific number of packets, and collects the first 128 bytes of each. It will collect a few of these packets (usually 6-7), aggregate them in a UDP packet, then send that packet to an sFlow collector. In this way, there is minimum work that the Exporter needs to do. No aggregation logic is required, and minimal memory is used.
In addition, sFlow is an extensible protocol. This means that other information can be included in the sFlow datagrams such as counters or custom protocol data.
Comparison
Here is a short comparison between the protocols and what each one provides:
| Feature | NetFlow | sFlow |
|---|---|---|
| Protocol | UDP | UDP |
| Communication Port | IPFIX: defaults to 4739
Older versions of NetFlow do not have a default port number, though 2055 is commonly used. | 6343 |
| Sampling | Optional. Can sample 1 in X packets, or all of them | Required. |
| Required Network Bandwidth | Minimal. Difficult to calculate accurately, but aggregates multiple sampled packets into flows and reports up to 30 flows in each datagram. | Requires more bandwidth than NetFlow since it does not aggregate flows and will only send data on 6-7 packets in a single datagram. |
| Overhead on Exporter | May be significant because of the aggregation logic and memory requirements. For software-defined networks, not as much of an issue. This is because compute hosts such as ESX servers generally have much greater CPU and memory than switches/routers. Some larger switches/routers have hardware support for NetFlow which reduces the overhead significantly. | Minimal. |
| Overhead on Collector | The collector gets the data already aggregated, making it easier to process. | All of the protocol analysis and aggregation is left up to the Collector to implement. |
| Data Exported | Basic details on the flow. Mainly 5 Tuple flow identifiers and counters and aggregation on fields like number of bytes, packets and TCP Flags. Extensible. | The first 128 bytes of each sampled packet. Contains the entire packet header and some data as well. |
| Common devices supporting the protocol | Switches, Routers, Firewalls, VMware vDS switches, Cisco ACI, Open vSwitch | Switches, Routers, Firewalls, F5 BIG-IP, OpenSwitch, Open vSwitch |
Utilizing NetFlow and sFlow in your Data Center Environment
Visibility into the network can help with many use cases. It can help you to understand application dependencies, plan microsegmentation of the network, or to detect security breaches. While modern networks can be complex, there are ways to simplify the visibility of those networks to allow for better understanding of your IT infrastructure.
These methods are already supported by many common platforms. Chances are, you can start using these protocols to gain visibility into your network right now, without needing to make any significant changes to your infrastructure.
Want to learn more about network visibility? Let’s schedule a call.


