
TL;DR: IBM Tivoli alternatives span dependency mapping and network monitoring tools. Best for: Faddom (agentless mapping), Device42 (CMDB discovery), LogicMonitor (hybrid observability), and Site24x7 (cloud-based monitoring).
What Is IBM Tivoli?
IBM Tivoli refers to a suite of software products designed to manage various aspects of an organization’s IT infrastructure, including systems, networks, applications, and services. The Tivoli brand (acquired by IBM in 1996) is no longer actively used, as IBM has moved its portfolio products into a revised and rebranded hierarchy, with a focus on cloud and smart infrastructure.
Some notable examples of this rebranding include the renaming of Tivoli Storage Manager to IBM Spectrum Protect and IBM Tivoli Workload Scheduler to IBM Workload Scheduler. However, some Tivoli products are still offered under the original Tivoli name.
IBM Tivoli solutions, or their rebranded equivalents, offer a range of features including system monitoring, automation of IT tasks, security management, service management, and data and storage management. These functionalities help organizations track performance, improve efficiency, manage security, simplify IT services, and protect data.
Benefits of these solutions include comprehensive IT management, increased efficiency through automation, real-time monitoring to reduce downtime, improved security and compliance, scalability, and potential cost reduction.
This is part of an extensive series of guides about DevOps.
IBM Tivoli Alternatives At a Glance
The table below summarizes the key differences between these IBM Tivoli alternatives and competitors. We explore each tool in more detail in the sections that follow.
|
Category |
Solution |
Best For |
Key Strengths |
Things to Consider |
|
Application Dependency Mapping and Discovery |
Faddom |
Agentless dependency mapping for hybrid and multi-cloud environments |
Agentless passive discovery, real-time continuous mapping, read-only secure design |
Initial learning curve; reporting and dashboards could be more polished; occasional duplicate host entries |
|
Application Dependency Mapping and Discovery |
Device42 |
Agentless CMDB-driven dependency mapping for hybrid IT |
Automated service discovery, Application Groups and Business Services, Impact Charts and Lists |
Setup can be time-consuming; upgrades are largely manual; bulk operations can be slow |
|
Application Dependency Mapping and Discovery |
BMC Helix Discovery |
Enterprise service modeling feeding AIOps and observability |
Blueprint-based service modeling, data reconciliation, security and compliance detection |
Query language has a learning curve; cloud and client-side discovery still maturing; licensing viewed as expensive |
|
IT Infrastructure and Network Monitoring |
ManageEngine OpManager |
Network and infrastructure monitoring with fault management |
Broad device support, Layer 2 and 3D visualization, distributed multi-site monitoring |
Setup and tuning can be time-consuming; advanced features gated to higher editions; support responsiveness varies |
|
IT Infrastructure and Network Monitoring |
LogicMonitor |
SaaS hybrid observability with AIOps-driven correlation |
Broad hybrid, cloud, and container coverage, Edwin AI alert correlation, automated service topology mapping |
Setup complexity; cost can rise at scale; advanced customization needs scripting skills |
|
IT Infrastructure and Network Monitoring |
Paessler PRTG |
All-in-one network, server, and application monitoring |
Broad sensor-based monitoring, real-time maps and dashboards, web, desktop, and mobile interfaces |
Sensor-based pricing scales with size; configuration effort for complex setups; interface can feel dated at scale |
|
IT Infrastructure and Network Monitoring |
Site24x7 |
Cloud-based network monitoring within a broader observability platform |
Wide device support, automated discovery and topology mapping, flow-based traffic analysis |
Pricing model can be complex; steep learning curve for advanced settings; alert tuning needed to avoid noise |
IBM Tivoli Solutions and Their New Names
Here are the primary solutions included in the IBM Tivoli suite, most of which now carry new names.
IBM Tivoli Monitoring
New name: None (this solution is still known as IBM Tivoli Monitoring)
IBM Tivoli Monitoring is an agent‑server‑client system that enables enterprises to track the availability and performance of systems and network applications across heterogeneous environments. It collects real-time metrics, raises alerts based on predefined or custom thresholds, and offers both real‑time workspaces and historical reporting—supporting trend analysis and troubleshooting.
Core components include:
- Tivoli Enterprise Monitoring Server (hub or remote servers): Collects alert and performance data from agents and maintains the Enterprise Information Base (EIB).
- Tivoli Enterprise Portal (TEP): A user interface (either browser- or desktop-based) for dashboard views, alerts, and analysis.
- Tivoli Data Warehouse: Stores historical data collected by agents for reporting and trend insights .
- Agents: Installed on various OSs (AIX, Linux, Windows, IBM i, etc.), these gather performance data and send it to the monitoring servers .
- Integration capabilities with other IBM tools such as Netcool/OMNIbus for event management and Jazz for Service Management .
IBM Tivoli Identity Manager (IBM Security Identity Manager)
New name: IBM Security Identity Manager (ISIM)
This solution handles identity lifecycle management by automating the creation, modification, and removal of user accounts across diverse systems and applications based on roles or requests .
Key capabilities include:
- Self-provisioning: Users can request access which can be automatically approved or routed based on policy.
- Offline account management and password vaulting for secure credential handling.
- The product traces its origins to IBM’s 2002 acquisition of Access360’s enRole solution; with version 6 around the end of 2012, it was rebranded as IBM Security Identity Manager.
- Post‑2021, identity management capabilities have increasingly been folded into IBM’s Verify Governance platform
IBM Tivoli Netcool (Netcool Operations Insight)
New name: IBM Netcool Operations Insight
This solution is a service-level management (SLM) solution that centralizes real-time event and alert consolidation from across complex IT domains .
Its architecture includes:
- ObjectServer: A high-performance, in-memory database at its core.
- Probes: Collect and forward events from monitored sources.
- Gateways: Enable failover, event replication, and forwarding to external systems such as helpdesks, CRMs, or databases.
- Desktop tools and a Web GUI for configuring, viewing, and managing event streams.
- Administration tools, including MIB parsers and rule configurators .
There’s a specialized monitoring agent within Tivoli Monitoring designed for overseeing Netcool/OMNIbus’s health, performance, automation triggers, and event processing
IBM Tivoli Storage Manager (IBM Storage Protect)
New name: IBM Security Identity Manager (ISIM)
This solution provides enterprise-grade automated, policy-driven data protection, backup, archiving, migration, and restore services across physical, virtual, and cloud environments .
Key components include:
- Server: Handles backup, archiving, space management, and orchestrates services across clients.
- Administrative interfaces: Command-line tools and web-based Operations Center for defining policies, managing servers, and scheduling tasks .
- Database and recovery logs: Track client metadata, policies, schedules, and server status.
- Storage pools: Abstract and group storage media (disk, tape, SAN, etc.) for efficient data management .
- Clients: Include backup/archive clients, HSM agents (for hierarchical storage management), and specialized application clients for databases, ERP, mail systems, etc. Many optional modules support LAN-free backups, NDMP for NAS devices, and API integration .
- Monitoring and reporting: Via integration with Tivoli Monitoring, enabling real-time and historical insight into Storage Manager performance, status, and trends; typically leveraging Tivoli Enterprise Portal and data warehouse for dashboards and reports .
Key IBM Tivoli Limitations
While IBM Tivoli offers comprehensive systems management tools, users should be aware of several notable limitations across its various components. These limitations were reported in IBM documentation:
- Automatic component startup: Tivoli Monitoring components are configured to auto-start by default during installation. There is no built-in option to disable this behavior. Disabling auto-start requires manual edits to operating system scripts. On Linux systems, the installer adds auto-start commands under all run levels, making global changes necessary to prevent automatic launch.
- Incomplete documentation steps: Installation guides for Tivoli System Automation for Multiplatforms omit critical commands. For example, two steps are missing when installing services on a node: stopping the node before deregistration and starting it before registration. Skipping these steps can cause unexpected behavior during service setup.
- Domain removal inconsistency: When removing a cluster domain from one node, the domain may remain active on the second node. Attempting to reuse the same domain name results in errors unless the domain is explicitly removed from all nodes using specific commands.
- Stuck resources: Resources can remain in a “stuck online” state if stop command timeouts are misconfigured. Administrators must manually time the shutdown process and update timeout values accordingly using chrsrc commands. Bringing the resource group offline and back online is required to apply changes.
- Portal server shutdown issues: The Tivoli Enterprise Portal Server automatically starts the Eclipse help server, but when the portal server is stopped, the help server remains running. This prevents proper cluster failover by keeping the portal resource in a “stuck” state. To fix this, an explicit command to stop the help server must be added to the shutdown script.
- Shared disk management on AIX: In some AIX test environments, shared disks were not released or remounted correctly after failures. This issue was resolved by installing the latest version of the storageRM component.
- RSCT process startup: In certain setups, lines in the system’s inittab file can block RSCT (Reliable Scalable Cluster Technology) processes from starting after reboot. These lines must be commented out if they precede RSCT-related entries to ensure correct service startup.
Notable IBM Tivoli Alternatives and Competitors
Because the Tivoli portfolio spans infrastructure visibility, monitoring, and IT operations, the alternatives below are grouped into two categories: platforms that focus on application dependency mapping and discovery, and platforms that focus on IT infrastructure and network monitoring.
Application Dependency Mapping and Discovery
1. Faddom

Faddom is an agentless application dependency mapping platform that automatically discovers servers, applications, and the communication flows between them across on-premises, cloud, and hybrid environments. It builds its first maps within about an hour of deployment, without installing agents, using server credentials, opening firewalls, or sending data outside the customer’s environment. The platform applies AI-driven correlation to turn raw network traffic into real-time maps and automatically groups servers into business applications. Because discovery is continuous, the picture stays current as the environment changes, and the appliance can also run offline. Teams use Faddom for asset discovery and documentation, change management and impact analysis, data center and cloud migration, resource and cost optimization, IT audit and compliance, and security use cases such as spotting unexpected traffic or expiring certificates.

Key features include:
- Agentless, passive discovery: Maps applications, servers, and traffic flows without agents, credentials, or firewall changes. Faddom works from a copy of network traffic so it does not affect performance, and it produces its first maps within roughly 60 minutes of deployment, which suits large or sensitive environments.
- Real-time dependency mapping: Visualizes how servers and applications communicate, including upstream and downstream flows, and automatically groups servers into business applications. The maps update continuously, so teams can see changes as they happen and plan work accordingly.
- Hybrid and multi-cloud coverage: Connects to on-premises, virtualized, and cloud data sources and maps hybrid business applications across them from a single view. This gives teams one place to see how workloads relate across different platforms.
- Read-only, secure design: Deploys as a lightweight, read-only appliance that needs no open firewalls, server credentials, or internet access, and all collected data stays within the customer’s environment. This keeps the platform suitable for environments with strict security requirements.
- Change tracking and alerting: Continuously logs infrastructure and application-level changes over time and can alert on them, providing context for change management, troubleshooting, and impact analysis across the mapped environment.
- Security-oriented views: Includes an SSL/TLS certificate tracking view and external network discovery, helping teams surface expiring certificates and identify outbound or unexpected traffic that crosses the network boundary.
Limitations (as reported by users on G2):
- Initial learning curve: Some users note that the range of features and the platform’s terminology take a little time to learn, and that Faddom delivers the most value when used regularly rather than configured once and left alone.
- Reporting and layout refinement: A few users would like more polished exportable reports and dashboards, and clearer automatic map layouts when working with very dense or complex environments.
- Granularity in some edge cases: Because discovery is agentless and traffic-based, a small number of users mention occasional duplicate host entries for migrated machines or reduced detail in specific scenarios such as encrypted traffic or certain cloud-native services.
If you want complete visibility into your infrastructure and a reliable way to understand how everything is connected, you can book a demo with our team!
2. Device42

Device42, now part of Freshworks, is an agentless discovery and dependency mapping platform for hybrid IT. Its Application Dependency Mapping module discovers how applications, services, and infrastructure communicate across on-premises and cloud environments and feeds that information into a near real-time CMDB. The platform recognizes communication patterns to group related assets and surface inter-service dependencies, including services, ports, and connections. The resulting maps support incident response, change management, modernization, cloud migration, and audit and compliance. Device42 builds the data from autodiscovery jobs and organizes the results into Business Services, Application Groups, and impact views that can be explored and exported.
Key features include:
- Automated service discovery: Discovers services across on-premises, cloud, and hybrid environments and identifies active services and the ports they use, recognizing which communication patterns matter and which to ignore. It can gather dependency data without configuring span ports.
- Application Groups: Automatically groups assets based on real communication patterns, with Calculation Rules that define what belongs in a group using criteria such as service type, server inclusion, and start or end points. A timeline view lets teams track changes to a group over time.
- Business Services: Provides a visual representation of how components form business services, built manually or from an Application Group. Teams can add metadata such as application type, owners, SLAs, and disaster recovery details, and print or export the charts.
- Impact Charts and Impact Lists: Auto-generated diagrams illustrate service connections and potential ripple effects, while Impact Lists reveal the upstream and downstream services affected by a device and which organizational groups depend on it.
- Hybrid and cloud discovery: Agentlessly discovers IT and cloud assets, including AWS and Azure resources, and feeds application and dependency data into the CMDB so the inventory reflects what is actually on the network.
- Migration and modernization support: Helps teams assess the business consequences before migrating applications, identify legacy dependencies, and approach asset retirement or consolidation with an understanding of the implications.
Limitations (as reported by users on PeerSpot):
- Initial setup effort: Setup and scanning configuration can be time-consuming in larger environments, particularly when different credentials are needed to configure various discovery jobs.
- Manual upgrades: Product upgrades are largely manual and can require significant effort, such as building and standing up a new virtual appliance.
- Dependency mapping performance and dashboards: Some users would like faster dependency mapping and dashboard widgets that surface more complete and accurate information.
- Bulk operations: Bulk deletion of assets is reported as time-consuming, and the workflow could be made more efficient.
- Licensing clarity: A few users find the license model confusing to interpret.
3. BMC Helix Discovery

BMC Helix Discovery is an agentless discovery and dependency-mapping solution, available as SaaS or on-premises, that automatically scans and maps IT assets, services, and their relationships across cloud and on-premises environments. It keeps the data current through continuous discovery without manual updates and feeds topology into the broader BMC Helix platform for observability and AIOps. The product includes service-modeling blueprints, data reconciliation to unify topology from multiple sources, and security and compliance features such as blind spot detection and certificate management. It is designed to handle complex infrastructure, including data centers, multiple clouds, and containers, and to support migration planning and capacity optimization.
Key features include:
- Agentless continuous discovery: Automatically discovers assets and maps relationships across cloud and on-premises environments, keeping the data current without manual updates so the topology reflects ongoing infrastructure changes.
- Blueprint-automated service modeling: Uses a library of service-modeling blueprints to dynamically map complex infrastructure to the applications and services it supports, giving teams visibility into the components behind specific business services.
- Data reconciliation: Unifies topology data from diverse sources and verifies its accuracy and consistency, producing a single comprehensive view that other processes can rely on.
- Observability and service awareness: Ingests its topology data and third-party data into the BMC Helix platform, connecting service models, topology, and telemetry to support root cause analysis and the visualization of related impacts.
- Security and compliance: Provides blind spot detection to expose undocumented assets and dependencies, SSL/TLS certificate discovery and management, and automated, detailed asset inventories to streamline audits and support regulatory compliance.
- Multi-cloud and enterprise asset management: Discovers and manages resources across multiple cloud providers, containers, and data centers, helping teams catalog assets and plan migration and capacity work with minimal configuration overhead.
Limitations (as reported by users on PeerSpot):
- Query language learning curve: The proprietary query language used to extract and customize data is reported by some users as challenging to learn.
- Cloud and client-side discovery gaps: The product is strongest in data center discovery, and some users want more mature scanning of newer cloud platforms and of client-side assets such as desktops, printers, and IoT devices.
- Stability: A number of users report stability issues in certain versions of the product.
- Customization and out-of-the-box configuration: Some users would like more customization options and note that certain database configuration is not provided out of the box.
- Licensing and pricing: The license model is viewed as relatively expensive and could be more flexible.
IT Infrastructure and Network Monitoring
4. ManageEngine OpManager

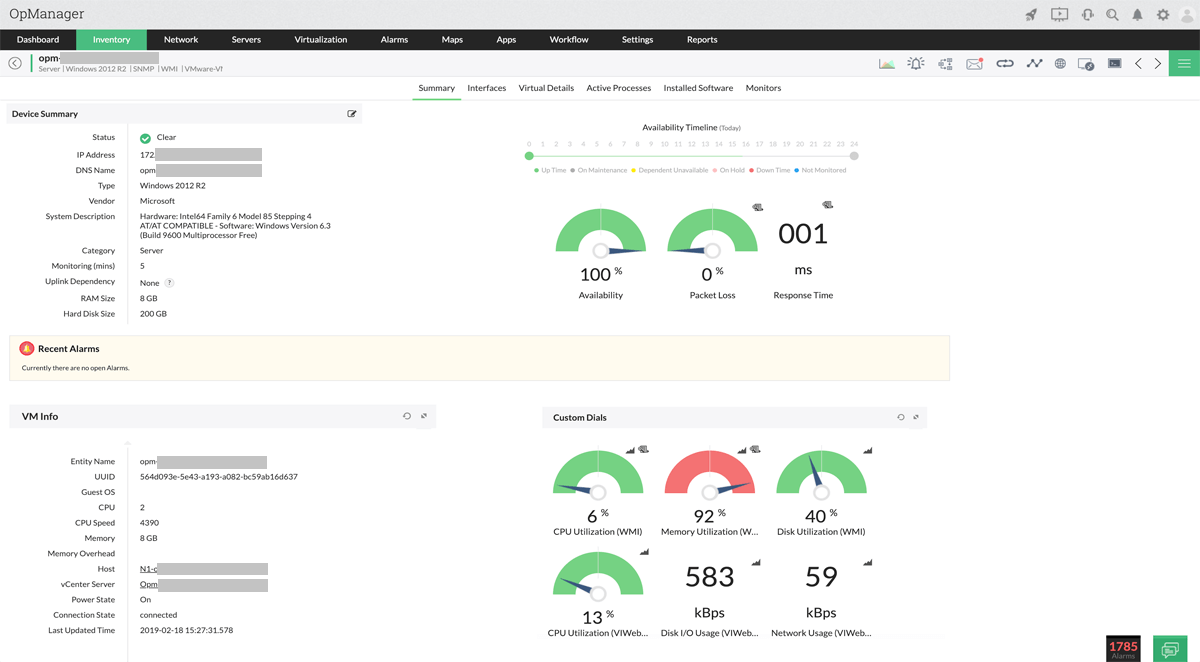
ManageEngine OpManager is a network and infrastructure monitoring platform that tracks the health, availability, and performance of routers, switches, firewalls, load balancers, wireless LAN controllers, servers, VMs, printers, and storage devices. It discovers IP-based devices and monitors them in real time, correlating raw events into prioritized, color-coded alarms and helping teams drill down to the root cause of an issue. Beyond core network monitoring, it covers physical and virtual servers, wireless networks, WAN links, Cisco ACI, and storage, and it offers visualization such as Layer 2 maps and 3D data center views. An Enterprise Edition uses a probe-central architecture to monitor devices distributed across multiple sites from one console.

Source: ManageEngine
Key features include:
- Network monitoring: Provides in-depth, real-time visibility into the health, availability, and performance of any IP-based device, monitoring network services and visualizing system performance from a central console.
- Physical and virtual server monitoring: Monitors servers around the clock to keep them running at optimum performance, including Hyper-V, VMware, Citrix, Xen, and Nutanix HCI environments.
- Wireless and WAN monitoring: Tracks access points, wireless routers, WiFi strength, and wireless traffic, and uses Cisco IPSLA to monitor WAN link availability and troubleshoot WAN outages and performance issues.
- Network visualization: Offers Layer 2 maps, virtual topology maps, business views, and 3D floor and rack views of data centers, helping teams navigate the environment and locate problems.
- Fault management and alerting: Correlates raw network events, filters out unwanted ones, and presents severity-based, color-coded alarms, with email and SMS notifications so issues can be addressed before users are affected.
- Distributed and storage monitoring: A probe-central Enterprise Edition monitors devices across multiple remote sites from a central server, and storage monitoring covers fiber channel switches, storage arrays, and tape libraries with capacity and trend monitors.
Limitations (as reported by users on G2):
- Setup and tuning effort: Initial setup and fine-tuning can be time-consuming in large or complex environments, and configuring thresholds and alert policies requires planning to avoid excessive or noisy alerts.
- Edition and add-on gating: Some advanced monitoring and integrations are available only in higher editions or as paid add-ons, which can increase overall licensing cost.
- Interface consistency: Some users find parts of the interface less intuitive than others and note limits in dashboard and visualization customization.
- Support responsiveness: A number of users report that support could be more responsive, particularly during urgent situations.
- Flow analysis depth: The NetFlow and traffic analysis is seen by some users as less robust than that of competing tools.
5. LogicMonitor

LogicMonitor’s LM Envision is a SaaS-based hybrid observability platform that combines monitoring with agentic AIOps across data centers, clouds, applications, and services. It provides infrastructure monitoring for networks, servers, VMs, SD-WAN, databases, storage, and configuration, alongside cloud and container monitoring, log management, and digital experience monitoring. The platform uses its Edwin AI capabilities to correlate and enrich alerts and offers automated service mapping, dynamic thresholds, anomaly detection, and forecasting. It ships with thousands of out-of-the-box integrations and is positioned to consolidate multiple monitoring tools into a single unified view of hybrid environments.

Source: LogicMonitor
Key features include:
- Hybrid infrastructure monitoring: Monitors networks, servers, VMs, SD-WAN, databases, storage, and configuration across on-premises and cloud infrastructure from one platform, giving teams a single view of the stack.
- Cloud, container, and log coverage: Covers AWS, Google Cloud, Azure, Oracle Cloud, containers, and AI infrastructure, and includes log management and analytics alongside metrics for broader context.
- Event Intelligence with Edwin AI: Correlates, enriches, and contextualizes alerts using Edwin AI to cut alert noise and support faster, better-informed decisions during incidents.
- Service insights and topology: Automatically maps services and their dependencies and provides a resource explorer to search, filter, and explore resources and relationships across the hybrid IT landscape.
- Root cause analysis and anomaly detection: Automatically identifies the underlying cause of performance issues and flags unusual behavior before it affects users, reducing time spent chasing problems.
- Dynamic thresholds, forecasting, and dashboards: Sets intelligent thresholds based on historical patterns, forecasts capacity to help prevent outages, and provides customizable real-time dashboards, with more than 3,000 integrations and APIs for extension.
Limitations (as reported by users on G2):
- Setup and configuration complexity: The initial setup and configuration can feel complex and labor-intensive, especially when first onboarding an environment.
- Cost at scale: Monitoring broad environments can become expensive, and cloud-metric costs in particular need to be watched and configured carefully.
- Scripting for advanced customization: Building custom DataSources or LogicModules can require training or scripting skills such as Groovy, PowerShell, or Python.
- Dashboard and report customization: Some users find visual customization of dashboards and reports limited and note that a few expected data sources are not available out of the box.
- Module freshness: Built-in modules do not always track the latest versions of monitored systems, leading some teams to write their own integrations.
6. Paessler PRTG

Paessler PRTG is an all-in-one IT infrastructure monitoring tool that tracks the systems, devices, traffic, and applications across a network. It uses preconfigured sensors for protocols such as SNMP, along with custom sensors and SQL queries, to monitor networks, databases, applications, cloud services, servers, and LANs. PRTG includes real-time maps and dashboards, customizable alerts and notifications, distributed monitoring, and reporting, and it offers web, desktop, and mobile interfaces. The software is available as an on-premises product (PRTG Network Monitor and PRTG Enterprise Monitor) and as a hosted SaaS option, with licensing based on the number of sensors in use.

Source: Paessler

Key features include:
- Network and LAN monitoring: Monitors all systems, devices, traffic, and applications in the infrastructure, including workstations, routers, switches, servers, and printers across the local network.
- Database and application monitoring: Monitors specific datasets using individually configured sensors and SQL queries, and gathers detailed statistics about each application running in the network.
- Cloud and server monitoring: Centrally monitors and manages cloud computing services from anywhere, and monitors all types of servers in real time for availability, accessibility, capacity, and overall reliability.
- Maps, dashboards, and interfaces: Provides real-time maps with live status information and a map designer for dashboards, and offers a web interface, a desktop app for bulk edits, and iOS and Android apps for monitoring on the go.
- Alerts and notifications: Sends alerts when problems or unusual metrics occur, with custom thresholds and built-in notification methods such as email, push, and HTTP requests.
- Extensibility and reach: Supports an HTTP API and custom sensors for extending functionality, along with SNMP monitoring, NetFlow monitoring, network mapping, and a syslog server for broader coverage.
Limitations (as reported by users on G2):
- Sensor-based cost at scale: Pricing is tied to the number of sensors, which can become expensive and constrain scaling in large environments.
- Configuration effort for complex setups: The initial configuration of complex infrastructures can feel overwhelming, and advanced customization sometimes requires deeper technical knowledge.
- Interface and scale performance: The web interface can feel dated and slow down with large dashboards or high sensor counts, and the stored-data footprint grows over time.
- Limited AI capabilities: Some users note fewer AI-driven features compared with newer competing tools.
7. Site24x7

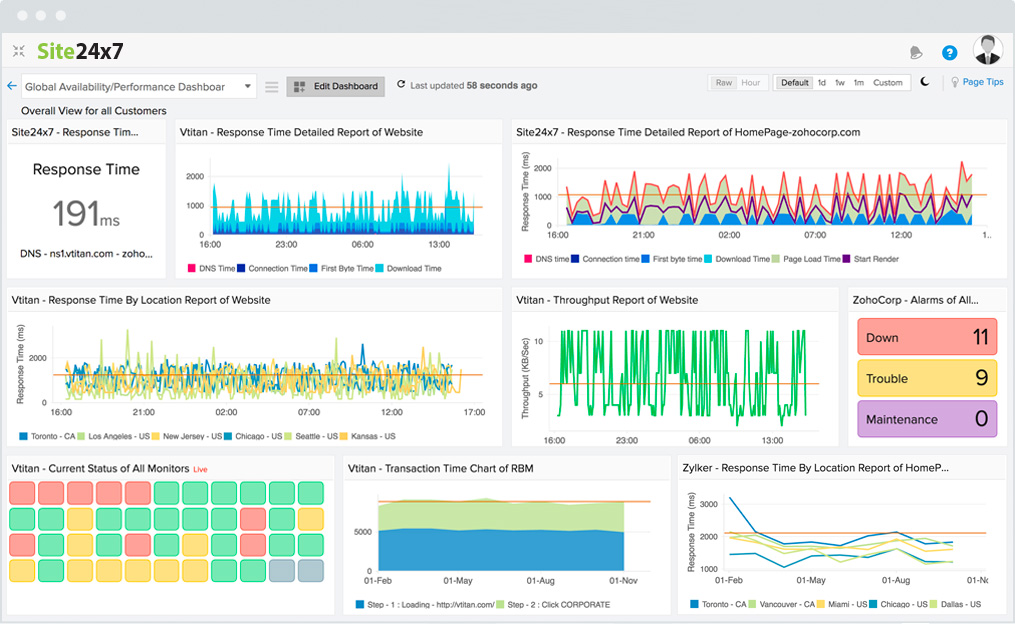
Site24x7 is a cloud-based monitoring platform whose network monitoring continuously tracks network health, performance, and traffic from a centralized, AI-assisted console. It monitors routers, switches, firewalls, load balancers, and wireless controllers across vendors, automatically discovers devices within IP ranges or CIDR blocks, and visualizes the network with topology and Layer 2 maps. The platform tracks interface-level and flow data, processes SNMP traps, and analyzes traffic using NetFlow, sFlow, and J-Flow. Network monitoring sits within a broader observability platform that also covers servers, applications, and cloud resources, and the whole service is delivered from the cloud.

Source: Site24x7
Key features include:
- Comprehensive device support: Monitors routers, switches, firewalls, load balancers, wireless controllers, and more across vendors and environments, with support for over 450 device types and accompanying templates.
- Automated discovery and mapping: Automatically detects devices within IP ranges or CIDR blocks and visualizes the network with topology and Layer 2 maps for easier navigation.
- Performance and interface metrics: Tracks bandwidth, traffic patterns, latency, packet errors, and interface utilization in real time to surface congestion and abnormal behavior early.
- Traffic analysis with flow technologies: Supports NetFlow, sFlow, J-Flow, and similar flow formats to understand bandwidth usage and traffic patterns, and processes SNMP traps with alerting.
- Custom dashboards and unified observability: Builds custom views ranging from high-level network overviews to detailed performance charts, and presents network metrics alongside servers, applications, and cloud resources in one console.
- Cloud-native, scalable delivery: Delivered as a cloud-hosted service with centralized dashboards, scaling from small setups to enterprise environments, with related capabilities for network configuration management and IP and switch management.
Limitations (as reported by users on G2)
- Pricing complexity: The pricing model spans many monitor types and thresholds, which some users find complicated and difficult to estimate.
- Learning curve and UI density: The breadth of features means advanced settings can be hard to locate, and deep configuration pages feel less streamlined.
- Alert tuning: The alerting system can become noisy or overwhelming without careful configuration.
- Support consistency: A subset of users report slower responses or difficulty reaching the appropriate support tier initially.
Conclusion
Although the Tivoli brand has been retired, the underlying technologies remain integral to IBM’s IT management portfolio. The rebranded solutions continue to provide enterprises with capabilities for infrastructure monitoring, workload automation, identity governance, and data protection. These tools address the ongoing need for centralized control, operational efficiency, and compliance across complex hybrid environments, ensuring that organizations can adapt their IT operations to evolving business and security demands.
See Additional Guides on Key DevOps Topics
Together with our content partners, we have authored in-depth guides on several other topics that can also be useful as you explore the world of DevOps.
Multi Cloud
Authored by N2WS
- [Guide] Multi-Cloud Strategy in 2025: Pros, Cons & 7 Success Factors
- [Guide] Multi-Cloud Management: Considerations & 10 Solutions to Know [2026]
- [Tool] AWS Cost Saving Calculator
- [Product] N2WS | Cloud Backup and Restore
Kubernetes Cost Optimization
Authored by Finout
- [Guide] Kubernetes Cost Optimization: 4 Cost Factors & 6 Cost Cutting Tips
- [Guide] Best Kubernetes Cost Management Solutions: Top 4 in 2026
- [Webinar] Mastering Kubernetes Spend-Efficiency
- [Product] Finout | Enterprise-Grade FinOps Platform
Ivanti
Authored by Faddom