
IT mapping tools are specialized software solutions designed to automatically discover, visualize, and document the components and topology of an organization’s IT environment. These tools map infrastructure elements such as servers, network devices, cloud resources, and applications, enabling IT teams to gain a comprehensive real-time view of their technology ecosystem.
The primary purpose is to simplify complex infrastructures by transforming raw configuration data into meaningful, interactive diagrams that show relationships and dependencies. By providing visual representations of IT assets and their interconnections, IT mapping tools help organizations identify system dependencies, improve troubleshooting, and simplify audits.
They are essential for maintaining up-to-date documentation in dynamic environments where frequent changes occur. These tools inventory devices and enable IT staff to understand how different technology elements interact, support compliance, and plan changes or expansions with minimal risk.
Key Features of IT Mapping Tools
Automated Discovery
Automated discovery enables the tool to systematically scan the network and detect all devices, applications, and cloud resources connected to the infrastructure with minimal manual intervention. Through standard protocols such as SNMP, WMI, and APIs, these tools inventory resources, collect configuration data, and classify assets without the need for repetitive entry or updating by IT staff.
The advantage of automated discovery is the ability to maintain accurate, detailed, and current asset records in real time. Instead of relying on spreadsheets or static diagrams that quickly become outdated, organizations can ensure up-to-date documentation as devices are added, moved, or decommissioned.
Dynamic Updating
Dynamic updating refers to an IT mapping tool’s ability to continually track and reflect changes in the IT environment as they happen. Every time a new device is added, a server is upgraded, or a software update is applied, dynamic updating ensures that these changes are captured in the IT map automatically. This reduces the administrative burden on IT teams, eliminates manual errors, and ensures the accuracy of infrastructure documentation at all times.
Maintaining an updated view is crucial for organizations facing rapid scaling or digital transformation initiatives. With dynamic updating, IT staff can react swiftly to incidents, security threats, or misconfigurations because they always have access to the latest topology and asset information.
Dependency Mapping
Dependency mapping visualizes the relationships and dependencies between infrastructure components, such as how applications rely on specific servers, databases, or network segments. This visibility is critical for understanding the interconnected nature of enterprise IT and helps pinpoint the potential impact of system failures, upgrades, or migrations.
Dependency mapping allows administrators to trace the flow of data, isolate problem sources, and plan changes with a clear understanding of upstream and downstream effects. By leveraging dependency mapping, organizations can minimize downtime and avoid cascading failures during maintenance or incident response. It becomes easier to plan for business continuity, manage configuration changes, and meet compliance audit requirements.
Support for Hybrid and Multi-Cloud Environments
With the shift toward hybrid and multi-cloud strategies, IT mapping tools now offer support for environments that span on-premises infrastructure, public clouds, and private clouds. These tools can discover assets and map dependencies across disparate environments, providing unified visibility regardless of where workloads reside. This is achieved through integration with cloud providers’ APIs and support for protocols used in virtualized and physical infrastructure.
Unified mapping across hybrid and multi-cloud environments simplifies operations for IT teams responsible for managing distributed, dynamic resources. It enables organizations to monitor cloud migrations, manage compliance in regulated industries, and control costs by understanding actual cloud utilization.
Reporting, Dashboards and Exporting
Effective IT mapping tools provide robust reporting and dashboard features, allowing IT teams to visualize data, track metrics, and generate actionable insights. Dashboards display key status indicators, such as device health, link performance, and compliance status, in intuitive graphs and charts. Reporting capabilities support scheduled and on-demand generation of asset lists, change logs, dependency diagrams, and compliance reports.
Exporting options are equally important, enabling organizations to share IT maps and reports in standard formats such as PDF, CSV, or image files. This ensures that stakeholders without access to the mapping tool’s interface can still view and utilize critical data for audits, executive presentations, or disaster recovery planning.
Security and Access Control
Security and access control features determine how an IT mapping tool protects sensitive configuration and topology data. These features include granular user permissions, authentication methods such as SSO or LDAP integration, and encrypted storage of collected data. Proper access controls ensure that only authorized personnel can view or modify sensitive mapping information, meeting internal policy and regulatory compliance mandates.
Some IT mapping tools add audit logs to monitor user activity and alert administrators to potential misuse or unauthorized attempts to access critical data. Robust security models are essential for environments with external auditors or strict privacy requirements.
Notable IT Mapping Tools
1. Faddom

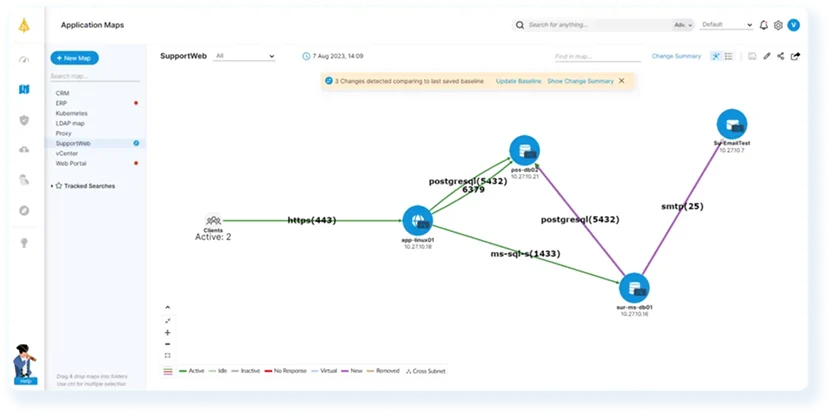
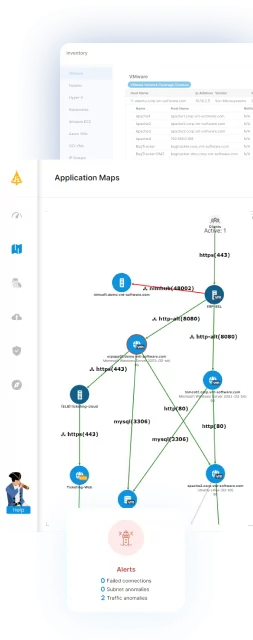
Faddom is an agentless application dependency mapping platform that automatically discovers and visualizes servers, applications, and all traffic flows across hybrid and multicloud environments. It delivers fast, accurate visibility for IT operations, audits, migrations, and security without installing agents or disrupting performance.
By continuously mapping real-time dependencies, Faddom helps organizations eliminate blind spots, accelerate change management, and enhance operational resilience. Whether planning data center moves, modernizing infrastructure, or maintaining compliance, Faddom provides the context teams need to make confident, data-driven decisions.
Key features include:
-
- Agentless and continuous discovery: Map your environment safely in under 60 minutes, with no agents or firewalls.
-
- Real-time visibility: Continuously updated maps reflect every dependency.
-
- Hybrid and multicloud support: Full coverage across on-premises, virtual, and cloud assets.
-
- Change and migration analysis: Understand upstream and downstream impacts before any move.
-
- Security and compliance: Identify unknown servers, risky connections, and shadow IT.
-
- AI-powered anomaly detection: Highlights unusual patterns and potential threats to strengthen network security and resilience.
-
- Easy sharing and integrations: Export maps or sync data with CMDBs, SIEM, and ITSM platforms.
Book a demo to get your live dependency map in under an hour!
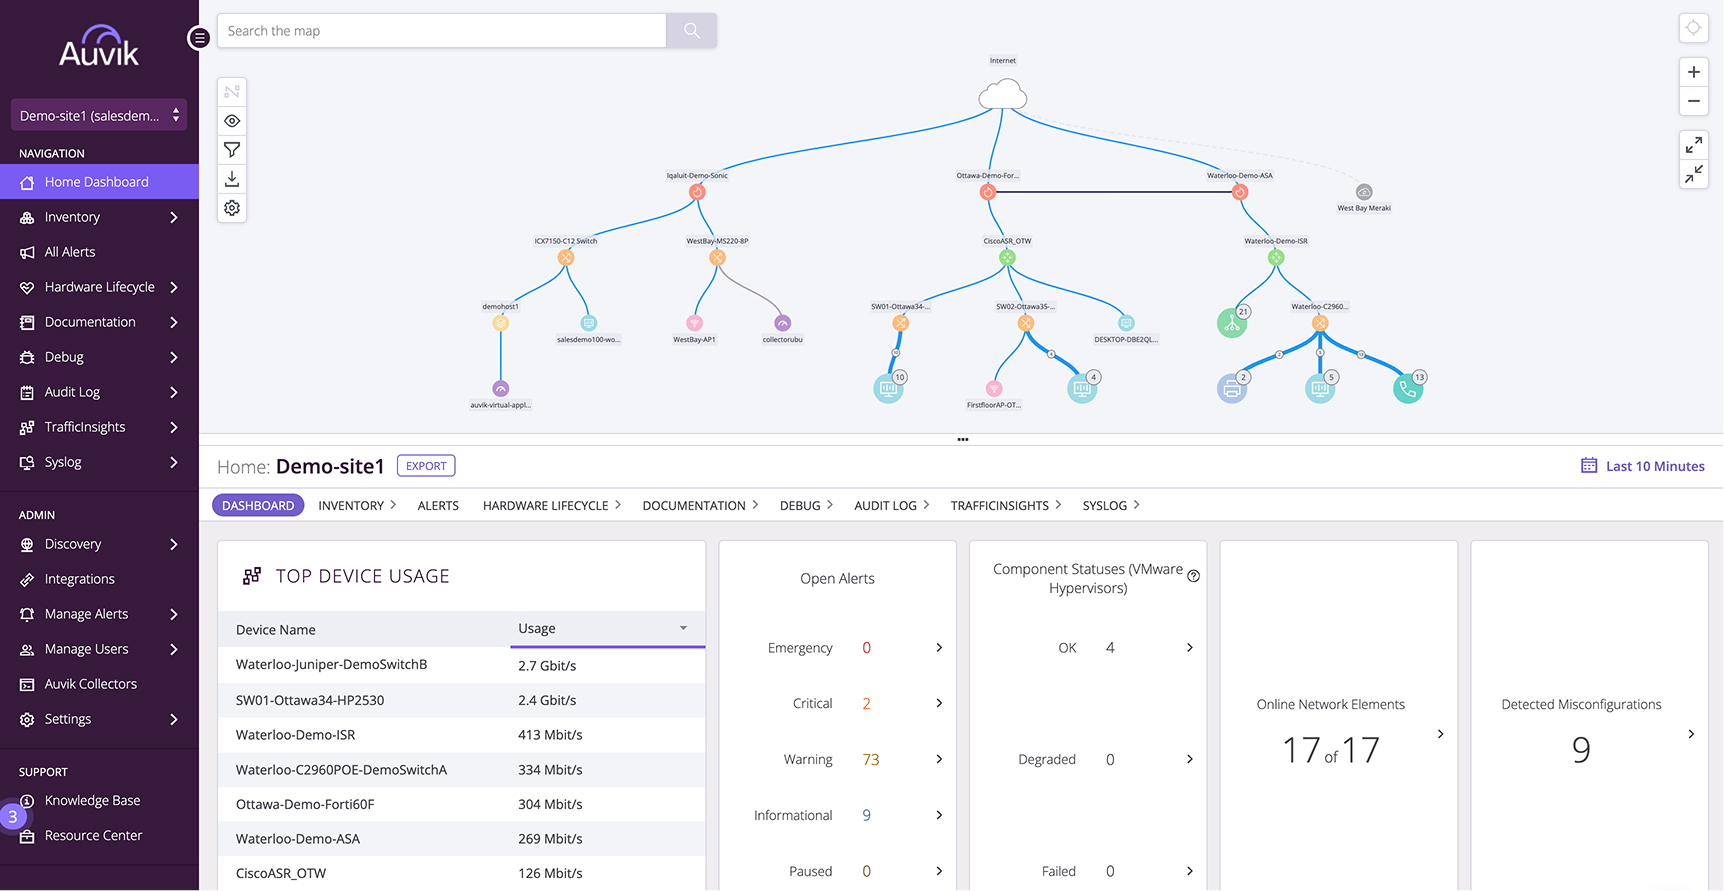
2. Auvik

Auvik is an IT mapping tool that focuses on delivering fast, automated network discovery and multi-layer visualization. Within an hour, Auvik can auto-discover network components using standard protocols like SNMP, CDP, and LLDP, generating topology diagrams across physical (Layer 1), data link (Layer 2), and network (Layer 3) layers.
Key features include:
-
- Automated network discovery: Scans the network using protocols like SNMP, CDP, and LLDP to automatically detect and inventory all connected devices.
-
- Multi-layer topology mapping (Layer 1, 2, and 3): The tool intelligently maps out the physical and logical structure of the network, including Layer 1 (physical connections), Layer 2 (data link), and Layer 3 (IP-level) topologies.
-
- Alert overlay: Active network alerts are visually embedded directly onto the topology map. This allows users to quickly identify which devices are affected, view the nature of the issue, and take immediate action by clicking into the relevant device dashboard.
-
- Filtered visualization: Simplifies environments by hiding unnecessary details. Device stacks are aggregated, and users can filter views to display only relevant parts of the network.
-
- Interactive device dashboards: Every device on the map is linked to a live dashboard that includes configuration data, performance metrics, issue history, and likely root causes. This allows IT staff to diagnose and respond to incidents without switching tools.
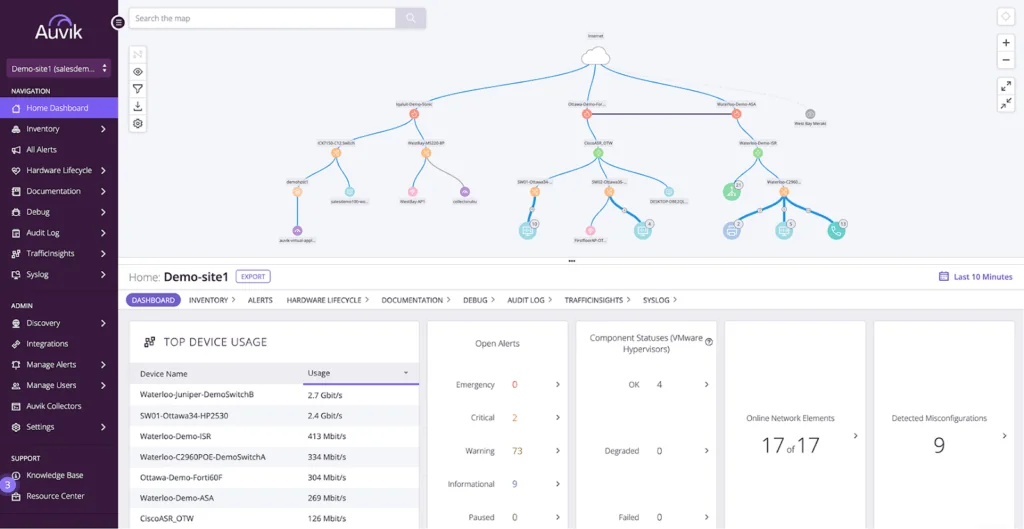
Source: Auvik
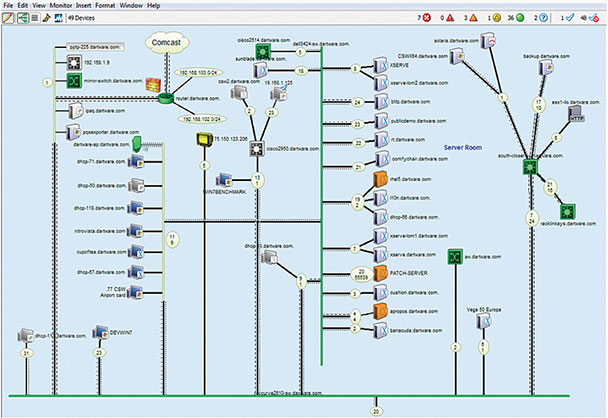
3. Intermapper

Intermapper is a network mapping and monitoring solution that gives IT teams visibility into their distributed environments. It automatically discovers and maps all IP-enabled devices, displaying their statuses with color-coded icons in customizable layouts. By polling network components using protocols like SNMP, Intermapper keeps maps current and alerts teams to issues.
Key features include:
-
- Automatic network mapping: Intermapper auto-discovers every device with an IP address and generates live network maps within minutes. Users can customize map layouts with icons, backgrounds, and hierarchical views (e.g., per building or floor).
-
- Monitoring with color-coded statuses: The software continuously monitors devices, interfaces, and applications using SNMP and other protocols. Status updates are displayed on the map using color-coded indicators.
-
- Customizable alerting: Intermapper provides flexible alerting options including emails, texts, and audible alarms. Alerts can be scheduled, assigned to specific teams, and configured with escalation paths, ensuring the right people respond at the right time.
-
- Cross-platform network management: IT teams can manage the network using Intermapper on Windows, Linux, or macOS. The interface allows users to review reports, acknowledge alerts, and adjust configurations without complexity.
-
- Network capacity planning tools: Historical performance data, strip charts, and trend reports help teams plan for future network growth. With 64-bit support and expanded memory capacity,
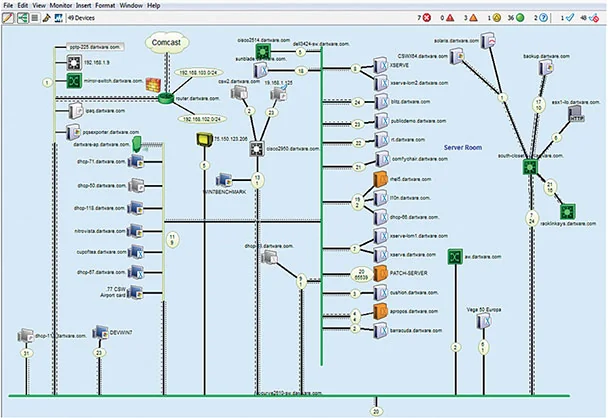
Source: Fortra
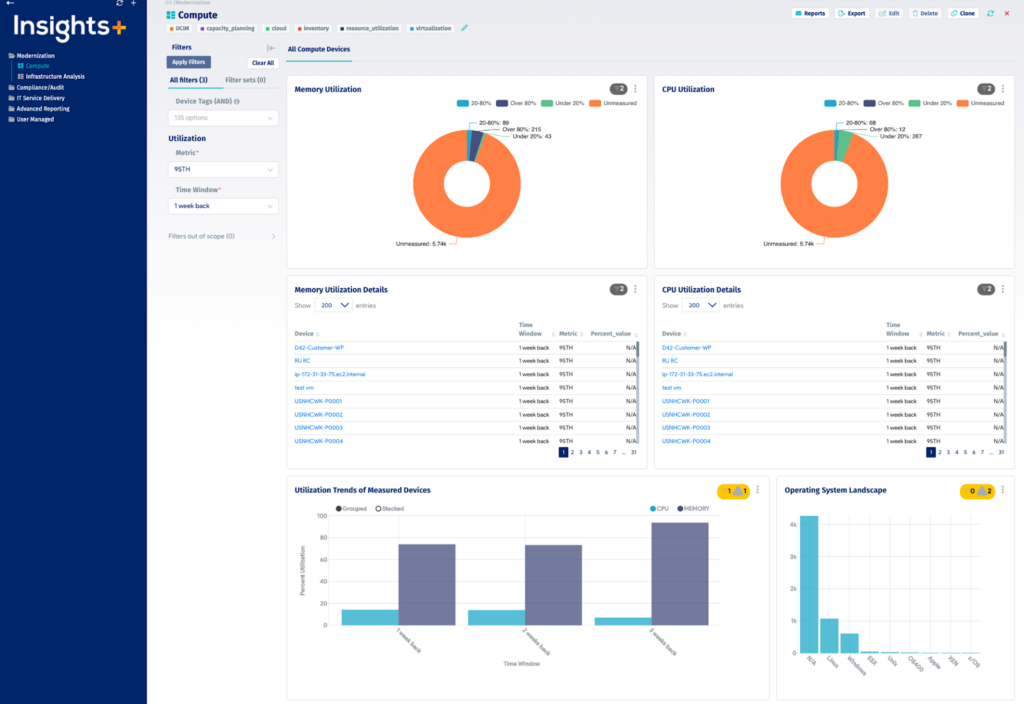
4. Device42

Device42 is an IT mapping and dependency visualization solution to help organizations understand how infrastructure components interact across hybrid and multi-cloud environments. By mapping application, service, and device relationships, Device42 provides a view of interdependencies that supports incident response, change management, and compliance.
Key features include:
-
- Dependency mapping: Maps relationships between applications, services, and infrastructure components, giving teams a real-time view of how systems are connected. This visualization supports root cause analysis, faster incident response, and smoother operations across environments.
-
- Incident response: Helps teams trace outages or performance issues back to their source. This speeds up troubleshooting and minimizes the impact of disruptions on business operations.
-
- Change management support: Clear dependency views reduce the risk of unexpected impacts during infrastructure changes or modernization efforts.
-
- Compliance and audit readiness: Visualized interconnections across services and applications help organizations maintain accurate, up-to-date documentation. This clarity simplifies audits, speeds up compliance reporting, and supports governance frameworks.
-
- Cross-environment visibility: Reveals service and communication links across physical, virtual, hybrid, and multi-cloud infrastructure. This holistic view ensures that hidden dependencies or insecure connections are identified and addressed.

Source: Device42
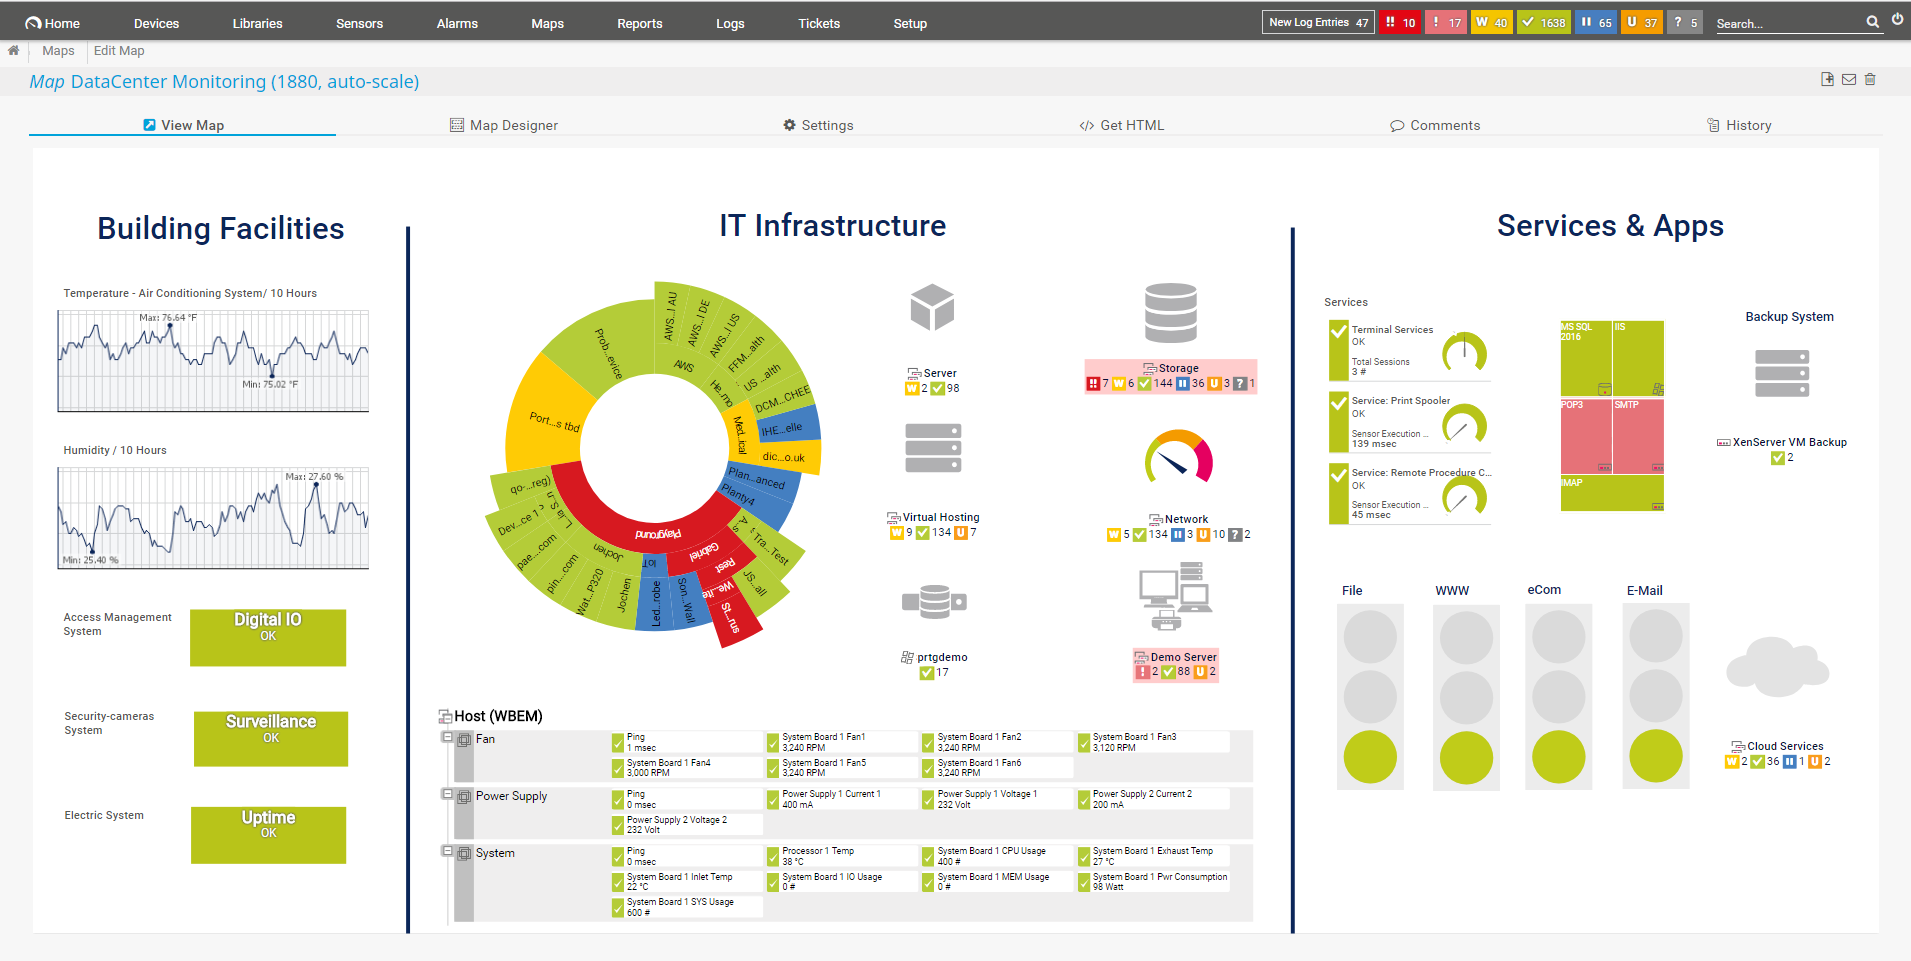
5. PRTG Network Monitor
PRTG Network Monitor is an infrastructure monitoring solution designed to give organizations visibility into their IT environments. It enables continuous monitoring of systems, devices, traffic, and applications through a range of sensors that can be tailored to infrastructure components.
Key features include:
-
- Infrastructure monitoring: PRTG monitors every part of the IT stack, from servers and network devices to cloud services and databases. Custom sensors allow users to track traffic, uptime, usage, and performance across applications, LANs, and more.
-
- Application and database monitoring: IT teams can configure PRTG to collect detailed stats on application performance and database queries. This helps detect bottlenecks, optimize services, and troubleshoot issues down to the query or process level.
-
- Cloud and server monitoring: PRTG supports centralized monitoring of public and private cloud services, alongside real-time tracking of server availability, load, and storage capacity,.
-
- SNMP and protocol support: With built-in support for SNMP, WMI, Flow, and REST APIs, PRTG can integrate with nearly any device or service. This ensures visibility across mixed vendor environments without requiring custom scripts or tools.
-
- Maps and dashboards: Users can build live network maps and status dashboards using the PRTG map designer. These visualizations display current states of devices and services, enabling at-a-glance monitoring from a centralized view.
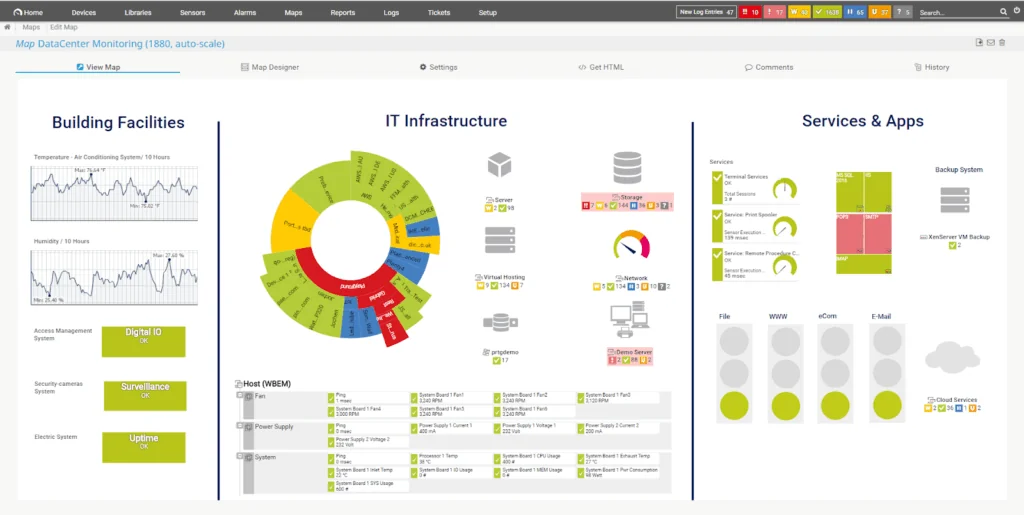
Source: Paessler
Related content: Read our guide to IT mapping services
Conclusion
IT mapping tools are essential for managing modern, distributed infrastructures where assets span on-premises data centers, cloud services, and hybrid environments. By delivering accurate, up-to-date visualizations of systems and their dependencies, they help IT teams improve troubleshooting, support compliance, and plan changes with confidence. The result is better control over infrastructure, reduced downtime, and stronger alignment between IT operations and business needs.


