TL;DR: IT mapping solutions automatically discover infrastructure and visualize how servers, applications and network devices connect. Faddom is best for agentless hybrid dependency mapping, Device42 for CMDB-linked discovery, Auvik for multi-site Layer 1 to 3 topology, and ServiceNow Service Mapping for business services inside an existing CMDB.
What Are IT Mapping Solutions?
IT mapping solutions involve documenting and visualizing components within an IT environment, encompassing hardware, software, networks, and data flows, often using specialized tools and software to create interactive maps, network diagrams, and application dependency maps for better understanding, planning, and management of IT systems. These solutions leverage technologies like Geographic Information Systems (GIS), network scanners, and application dependency mapping tools to provide insights into infrastructure and improve service reliability.
Modern IT environments are highly dynamic, with assets frequently added, removed, or updated across hybrid and multi-cloud configurations. Manual tracking is insufficient and error-prone, making automated IT mapping essential. IT mapping solutions bridge this gap by ensuring up-to-date, real-time documentation and visualization. This enables organizations to maintain control over their environments, simplify operations, and respond rapidly to incidents.
Editors’ note: Updated information for IT mapping solutions to reflect features and capabilities in 2026, and added two new solutions.
Why Do IT Managers Need IT Mapping Solutions?
IT mapping solutions help IT managers maintain control over increasingly complex environments by providing accurate, centralized visibility into assets, connections, and dependencies. With automated discovery and visual mapping, teams can reduce operational blind spots, improve planning, strengthen security oversight, and respond faster when issues occur.
-
Maintaining visibility across complex IT environments: IT mapping solutions automatically discover on-premises, cloud, container, and edge resources, presenting them in a unified visual map that stays current as infrastructure changes.
-
Identifying undocumented assets and shadow IT: Continuous scanning helps detect unmanaged devices, unauthorized cloud resources, and unknown applications so teams can bring them under monitoring, security, and lifecycle controls.
-
Understanding application and infrastructure dependencies: Dependency mapping reveals how applications connect to databases, APIs, storage, load balancers, and network services, helping managers assess change impact and prevent outages.
-
Improving incident response and troubleshooting: Visual infrastructure context helps responders trace failures, identify affected systems, isolate root causes faster, and restore services more efficiently.
Benefits of Using IT Mapping Solutions
IT mapping solutions offer practical advantages for organizations managing complex, fast-changing IT environments. By automating the discovery and visualization of IT assets and their relationships, these tools support better decision-making and improve operational efficiency.
Key benefits include:
- Real-time visibility: Automatically updated maps reflect changes in infrastructure as they happen, reducing blind spots and improving situational awareness.
- Faster incident response: Visual maps help identify root causes quickly by showing dependencies and potential failure points across systems.
- Improved change management: Understanding system interconnections supports impact analysis before making changes, reducing the risk of outages.
- Enhanced security posture: Mapping helps uncover unauthorized devices or misconfigurations, making it easier to enforce security policies and audit the environment.
- Compliance and documentation: Maintains an accurate and auditable record of infrastructure, useful for regulatory compliance and internal governance.
- Support for cloud and hybrid environments: Tracks resources across on-premise, public, and private clouds, ensuring full coverage in modern IT setups.
IT Mapping Solutions Popular with IT Managers: Top Solutions Compared
The table below summarizes the key differences between the solutions covered in this guide, including what each one is suited to and where the trade-offs are. We explore each of them in more detail in the sections that follow.
|
Category |
Solution |
Best For |
Key Capabilities for IT Managers |
Things to Consider |
|
Application and Service Dependency Mapping |
Faddom |
Agentless dependency mapping across hybrid on-prem and cloud |
Agentless real-time dependency mapping across hybrid environments. |
Reporting depth and some topology views are basic |
|
Application and Service Dependency Mapping |
Device42 |
Dependency mapping tied to a CMDB across hybrid estates |
Application dependency mapping with CMDB integration. |
Setup and navigation can be involved for small teams |
|
Application and Service Dependency Mapping |
ServiceNow Service Mapping |
Mapping business services to infrastructure in ServiceNow |
Automatic business service mapping with CMDB integration. |
Accuracy depends on CMDB maturity and tuning effort |
|
Application and Service Dependency Mapping |
BMC Helix Discovery |
Enterprise discovery and service modeling across hybrid IT |
Agentless discovery with service modeling and topology mapping. |
Enterprise pricing, with a starter bundle from $50,000 |
|
Network and Infrastructure Mapping |
Auvik |
Layer 1 to 3 network topology across multi-site networks |
Real-time Layer 1–3 network topology mapping. |
Device-count pricing and alert tuning effort |
|
Network and Infrastructure Mapping |
SolarWinds Network Topology Mapper |
Automated Layer 2 and Layer 3 network diagrams |
Automated Layer 2 and Layer 3 network mapping. |
Mapping only, without performance monitoring built in |
|
Network and Infrastructure Mapping |
Paessler PRTG |
Network maps combined with sensor-based monitoring |
Network topology mapping with infrastructure monitoring. |
Sensor licensing costs grow as coverage expands |
|
Network and Infrastructure Mapping |
ManageEngine OpManager |
Layer 2 topology with 3D rack and floor data center views |
Layer 2 mapping with business and data center views. |
Setup complexity and add-on licensing for some features |
What Capabilities of IT Mapping Solutions are Critical for IT Managers?
Automated Asset Discovery
Automated asset discovery gives IT managers a reliable way to identify and track assets across complex environments. It continuously scans physical, virtual, cloud, and hybrid infrastructure to keep inventory data current as changes occur. This reduces reliance on manual updates, which can quickly become outdated in dynamic IT environments. The discovered asset data becomes the foundation for accurate infrastructure maps, dependency views, and configuration records.
Capabilities to support IT managers:
- Automatically discovers physical devices, virtual machines, cloud resources, applications, and network equipment
- Supports agent-based and agentless discovery methods
- Maintains current asset inventories across on-premises, cloud, and hybrid environments
- Provides accurate data for network maps, dependency maps, and CMDB records
Application Dependency Mapping
Application dependency mapping helps IT managers understand how applications rely on underlying infrastructure and connected services. It identifies relationships between applications, databases, servers, APIs, storage systems, and network components. By visualizing these dependencies, teams can better assess the operational impact of changes or outages. This capability is especially useful for troubleshooting, modernization, and migration planning.
Capabilities to support IT managers:
- Maps communication paths between applications and supporting infrastructure
- Identifies dependencies between servers, databases, APIs, and storage systems
- Helps detect single points of failure
- Supports troubleshooting, change impact analysis, and migration planning
Business Service Mapping
Business service mapping connects technical assets to the business services they support. This allows IT managers to move beyond device-level visibility and understand how infrastructure affects customer-facing applications and internal operations. By linking systems to business outcomes, teams can prioritize work based on service criticality. This improves incident response, risk management, and service-level decision-making.
Capabilities to support IT managers:
- Links infrastructure components to business services and processes
- Shows how technical issues may affect critical services
- Helps prioritize incidents based on business impact
- Supports service-level management, change planning, and risk assessment
Continuous Change Detection
Continuous change detection helps IT managers keep pace with constantly evolving infrastructure. As devices are added, cloud resources are provisioned, applications are updated, and configurations change, mapping tools detect and record those updates. This helps ensure infrastructure maps remain accurate without requiring manual maintenance. It also improves visibility into unauthorized changes, configuration drift, and historical activity.
Capabilities to support IT managers:
- Detects asset additions, removals, and configuration changes
- Updates infrastructure maps in near real time
- Helps identify unauthorized or unexpected modifications
- Maintains historical change records for troubleshooting and compliance
Configuration and Relationship Tracking
Configuration and relationship tracking gives IT managers detailed visibility into asset attributes and how systems are connected. This includes hardware specifications, software versions, ownership details, network links, and dependency relationships. Maintaining this information helps teams understand how changes to one component may affect others. It also supports planning, auditing, lifecycle management, and operational analysis.
Capabilities to support IT managers:
- Tracks hardware, software, ownership, and configuration details
- Maintains relationships between infrastructure components
- Supports root cause analysis and change impact assessment
- Improves capacity planning, compliance audits, and lifecycle management
CMDB and ITSM Integration
CMDB and ITSM integration allows IT mapping data to support broader service management processes. By synchronizing asset and relationship information with service management platforms, IT managers can reduce duplicate data entry and improve record accuracy. This gives service desk and operations teams access to current infrastructure context. As a result, incident, problem, change, and asset management workflows become more informed and efficient.
Capabilities to support IT managers:
- Synchronizes asset and dependency data with CMDB and ITSM platforms
- Reduces duplicate manual data entry
- Improves incident, problem, change, and asset management workflows
- Helps service desk teams identify affected systems and dependencies faster
Migration and Modernization Planning Support
Migration and modernization planning requires a clear understanding of existing systems and their dependencies. IT mapping solutions help IT managers see which applications, servers, databases, and network components must move together. This reduces the risk of overlooking critical connections that could cause outages or performance issues. Accurate dependency data also supports phased planning for cloud adoption, data center consolidation, and infrastructure upgrades.
Capabilities to support IT managers:
- Identifies dependencies that must be preserved during migrations
- Supports cloud adoption, data center consolidation, and modernization projects
- Reduces migration risk by exposing overlooked relationships
- Enables phased migration planning based on accurate infrastructure data
Notable IT Mapping Solutions for IT Managers
How we selected these solutions: We shortlisted IT mapping solutions based on automated asset discovery, application and service dependency mapping, network topology visualization, continuous change detection, and integration with CMDB and ITSM platforms.
Notable IT Mapping Solutions
Dependency and Application-Level Mapping
1. Faddom


Best for: Agentless dependency mapping across hybrid on-prem and cloud
Strengths: Passive real-time mapping with no agents or credentials
Things to consider: Reporting depth and some topology views are basic
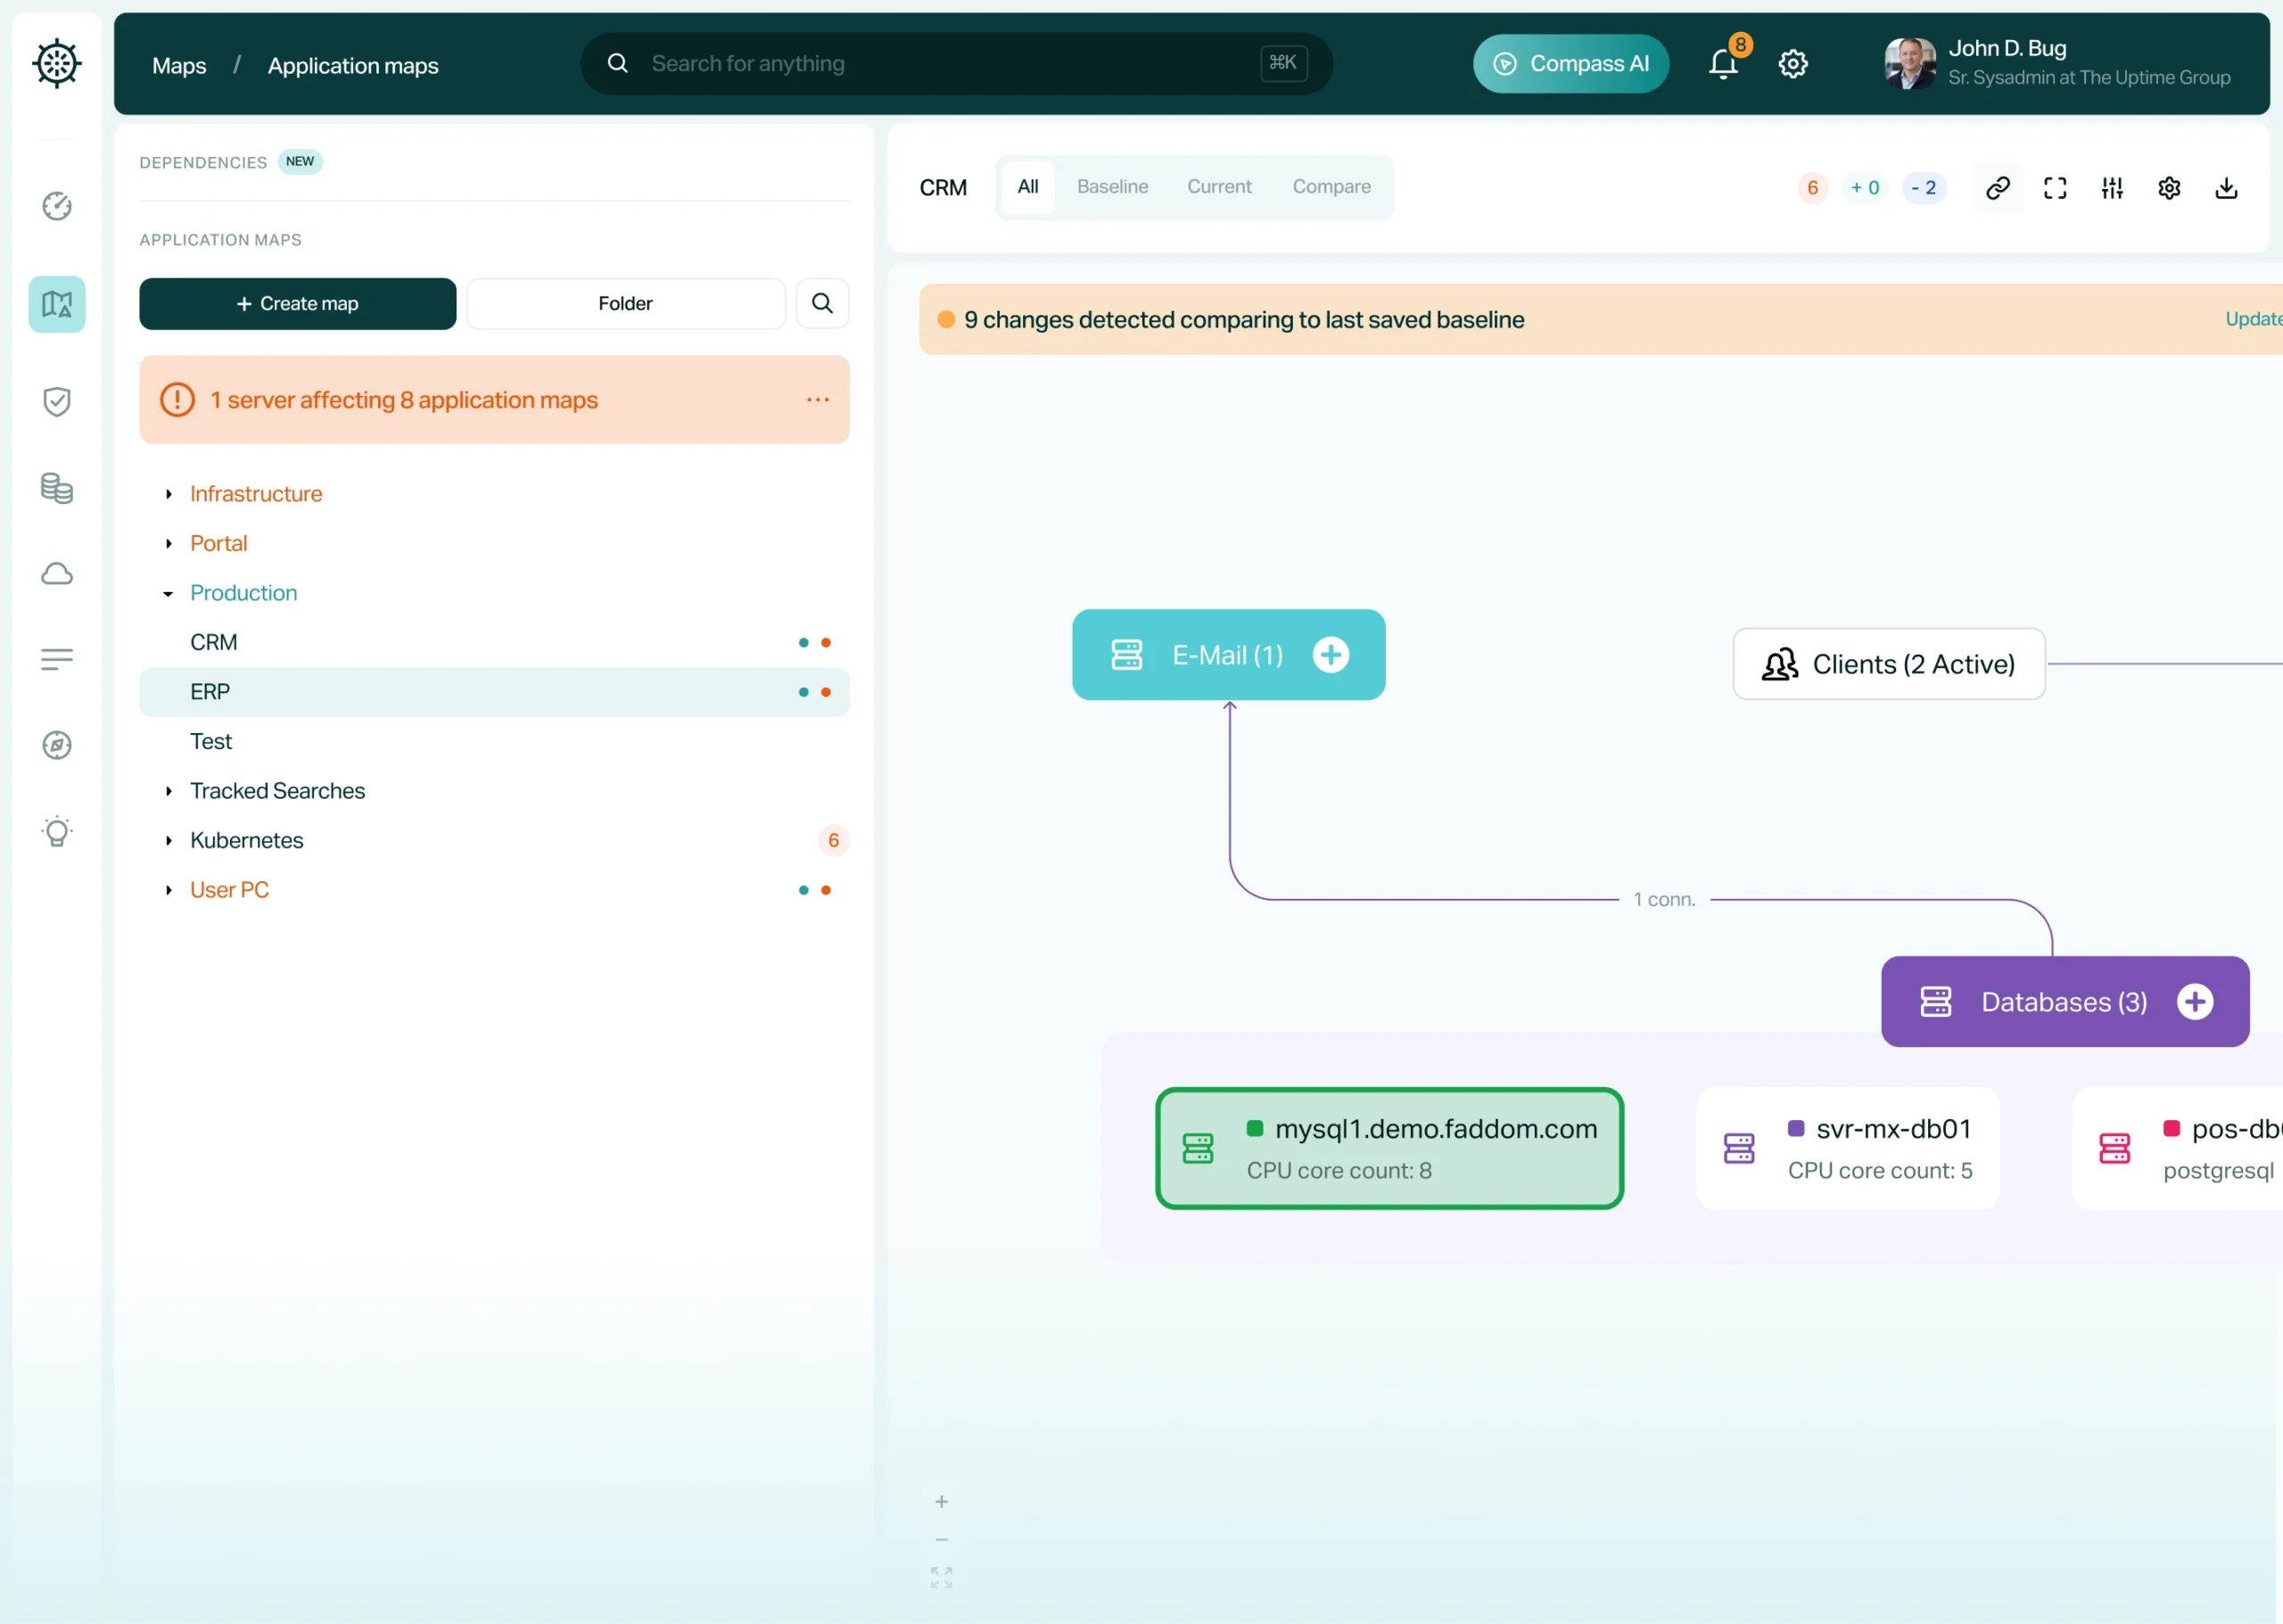
Faddom is an agentless application dependency mapping platform that visualizes on-premises and cloud infrastructure in real time, with servers automatically grouped by the business application they belong to. It uses AI-driven correlation and analysis to turn raw network traffic data into application and dependency maps.
Deployment does not require agents, server credentials, firewall changes or internet access, and all collected data stays inside the environment. The platform is used for discovery and asset documentation, change management, migration planning, IT audit and compliance, cybersecurity, and cost optimization.
Key features include:
- Agentless, passive collection: Maps the environment without installing agents on servers, supplying server credentials, or opening firewalls, and can operate offline. Data remains within the customer environment.
- Automatic grouping by business application: Discovered servers are grouped into business applications, so teams can see which machines and flows make up each service rather than reading a flat device list.
- Hybrid and multi-cloud data sources: Connects on-premises, virtual and cloud environments and discovers hybrid business applications across them from a single deployment.
- Continuous real-time updating: Maps are updated continuously rather than at scan intervals, so the topology reflects the current state of the environment 24/7.
- Change tracking and impact analysis: Shows upstream and downstream relationships before a change is made, and supports wave-based planning for data center and cloud migrations.
- Security and compliance views: Surfaces unknown servers, shadow IT, external traffic and risky connections, and produces documentation used for audits and compliance work.
- Sharing and integrations: Maps can be exported, and data can be synced with CMDB, SIEM and ITSM platforms.
Limitations (as reported by users on G2):
- Onboarding curve: Some reviewers note the terminology and the breadth of features take time to learn, and recommend using vendor onboarding sessions to get value quickly.
- Report and export options: Several users would like richer exportable reports and dashboards, particularly for executive-level summaries.
- Occasional duplicate host entries: A few reviewers report the same server appearing under more than one hostname, for example after a VM is migrated or an IP is reassigned.
2. Device42 ADM

Best for: Dependency mapping tied to a CMDB across hybrid estates
Strengths: Application groups built from real communication patterns
Things to consider: Setup and navigation can be involved for small teams
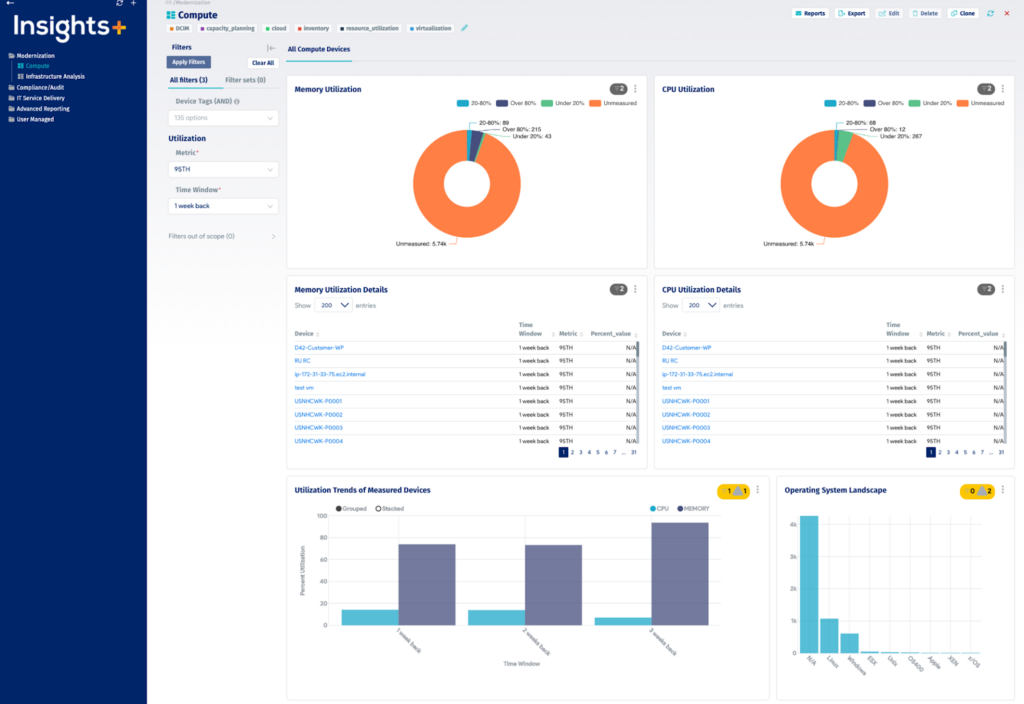
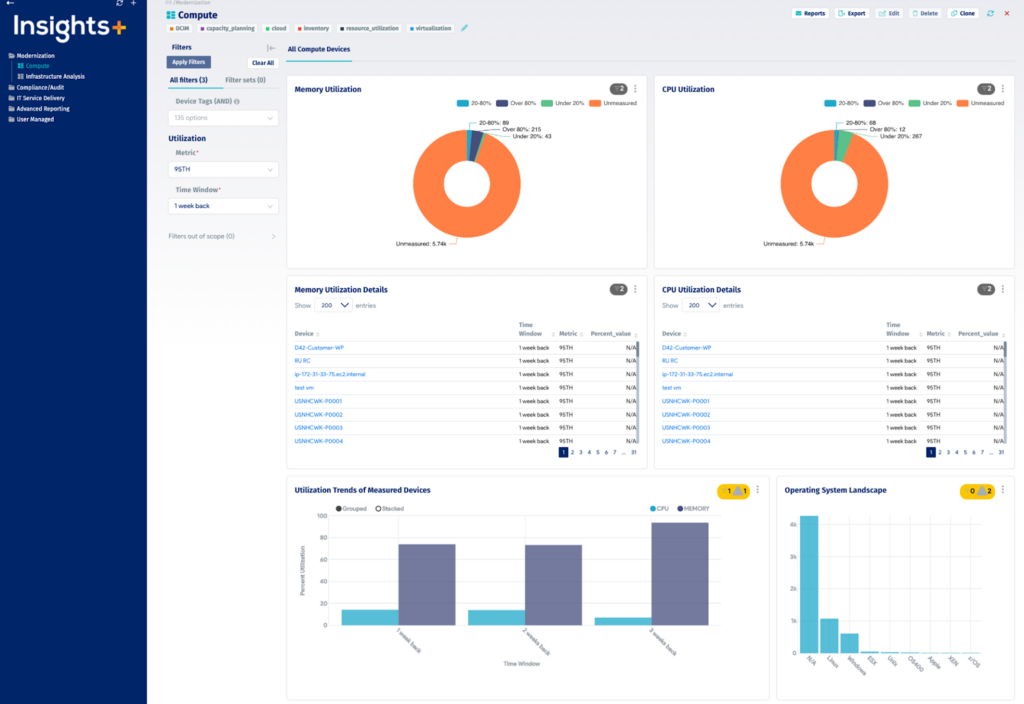
Device42 provides dependency mapping across hybrid and multi-cloud environments as part of a wider discovery and CMDB platform. It maps how applications, services and devices connect, and organizes those relationships into application groups and business service views that can be shared with other teams.
The mapping capability is built on automated service discovery, which identifies running services and the ports they use and returns dependency data without requiring span ports. Impact charts and impact lists then show what a given device connects to and what would be affected if it changed or failed.
Key features include:
- Application Groups: Automatically generate maps by grouping assets based on observed communication patterns. Calculation rules define membership using criteria such as service type, server inclusion, and start or end points.
- Automated service discovery: Identifies active services and the ports in use, produces a full dependency visualization for a specific machine, and returns a list view of services with their remote dependencies.
- Impact charts: Auto-generated diagrams that illustrate service connections and the ripple effects a change or failure would have across connected components.
- Impact lists: List the services influenced by an initiating device and the organizational groups that rely on those devices.
- Business services modeling: Build service views manually or from an application group, define connections between devices, and attach metadata such as application type, owners, SLAs and DR details.
- Change timeline and export: Track how application groups change over time using a timeline view, and print or export business service and application charts.
Limitations (as reported by users on G2):
- Initial complexity: Reviewers describe the platform as taking time to set up and navigate, particularly for smaller teams, and note that discovery planning matters to avoid pulling in unwanted data.
- Performance under load: Some users report slowdowns when handling large data volumes or high numbers of API calls against the appliance.
- Add-on licensing: Several reviewers note that certain capabilities are priced separately as add-ons rather than included in a single product price.
- Topology diagram handling: Reviewers mention that diagrams have to be downloaded device by device rather than in bulk, and that some dependency reports are large.
- Dependency data freshness: At least one reviewer notes that application dependency mapping output is not presented as real-time data.
Source: Device42
3. ServiceNow Service Mapping

Best for: Mapping business services to infrastructure in ServiceNow
Strengths: Several mapping methods with automatic updates on change
Things to consider: Accuracy depends on CMDB maturity and tuning effort
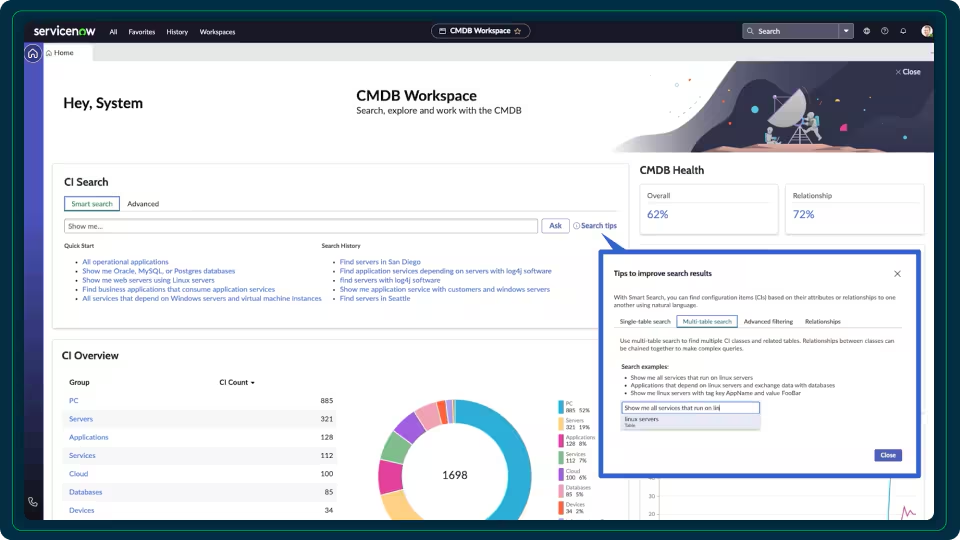
ServiceNow Service Mapping builds views of the relationships between applications, IT components and cloud services, so that infrastructure can be understood in terms of the business services it supports. Maps are used to diagnose problems and prioritize them according to business impact.
The product generates maps using machine learning across tag-based, top-down and traffic-based methods, and it can reuse discovery data and mechanisms an organization already has in place. It is delivered as part of ServiceNow IT Operations Management and writes into the ServiceNow CMDB.
Key features include:
- Multiple map generation methods: Service maps are generated with machine learning using tag-based, top-down and traffic-based approaches, so different application architectures can be mapped without a single fixed technique.
- Automatic updates on change: Maps update automatically whenever a change is detected, rather than requiring a scheduled rebuild.
- Multicloud discovery and mapping: Out-of-the-box discovery and mapping support is provided for a range of common cloud platforms.
- CMDB integration: Integration with the ServiceNow CMDB places service relationships and configuration items in a single system of action.
- Reuse of existing discovery data: Discovery data and mechanisms already deployed can be used to enrich service maps rather than being replaced.
- Business impact prioritization: Because components are linked to the services they support, incidents can be triaged and prioritized by business impact.
Limitations (as reported by users on G2, where Service Mapping is reviewed as part of ServiceNow IT Operations Management):
- Configuration effort: Reviewers describe configuring Service Mapping for complex applications as time-consuming, with tuning and validation needed before maps are trusted.
- Dependence on CMDB data quality: Multiple users note that mapping accuracy is limited by the state of the CMDB, and that duplicates or missing relationships degrade results.
- Map drift in dynamic environments: Users mention the difficulty of keeping service maps accurate where infrastructure changes frequently.
- Licensing cost: Advanced modules including Discovery and Service Mapping are repeatedly described as expensive, particularly for smaller organizations.
- Skills required: Reviewers report that experienced administrators are generally needed for implementation and ongoing maintenance.
Source: ServiceNow
4. BMC Helix Discovery

Best for: Enterprise discovery and service modeling across hybrid IT
Strengths: Blueprint-driven service modeling and data reconciliation
Things to consider: Enterprise pricing, with a starter bundle from $50,000
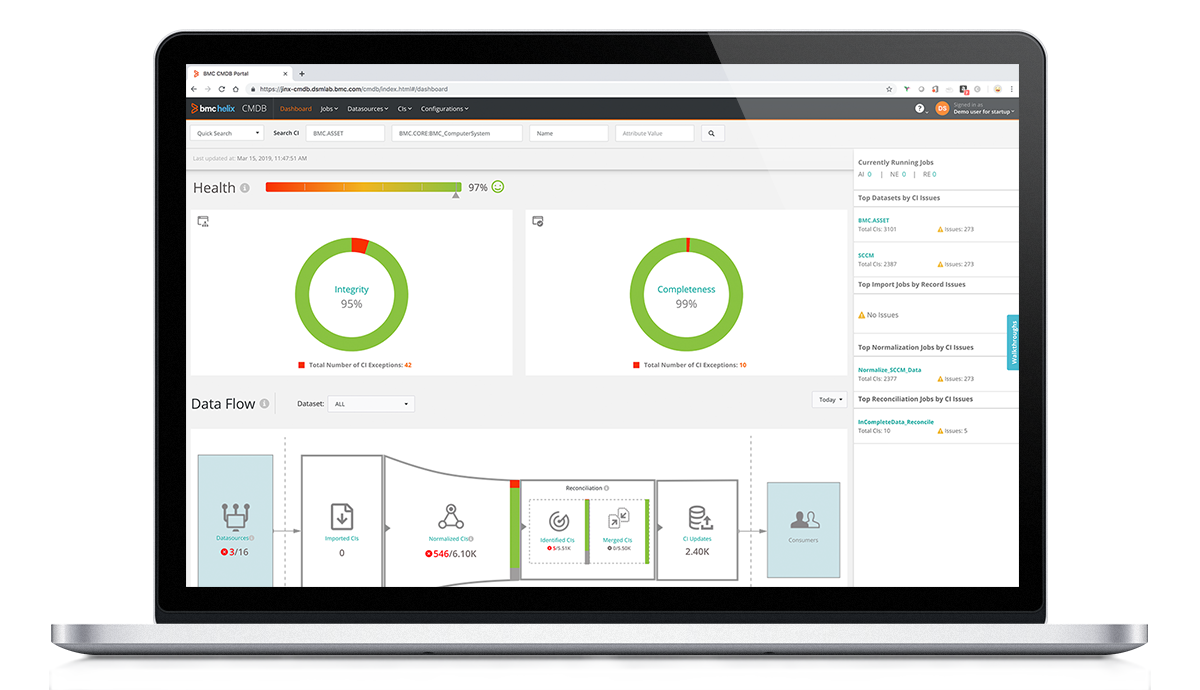
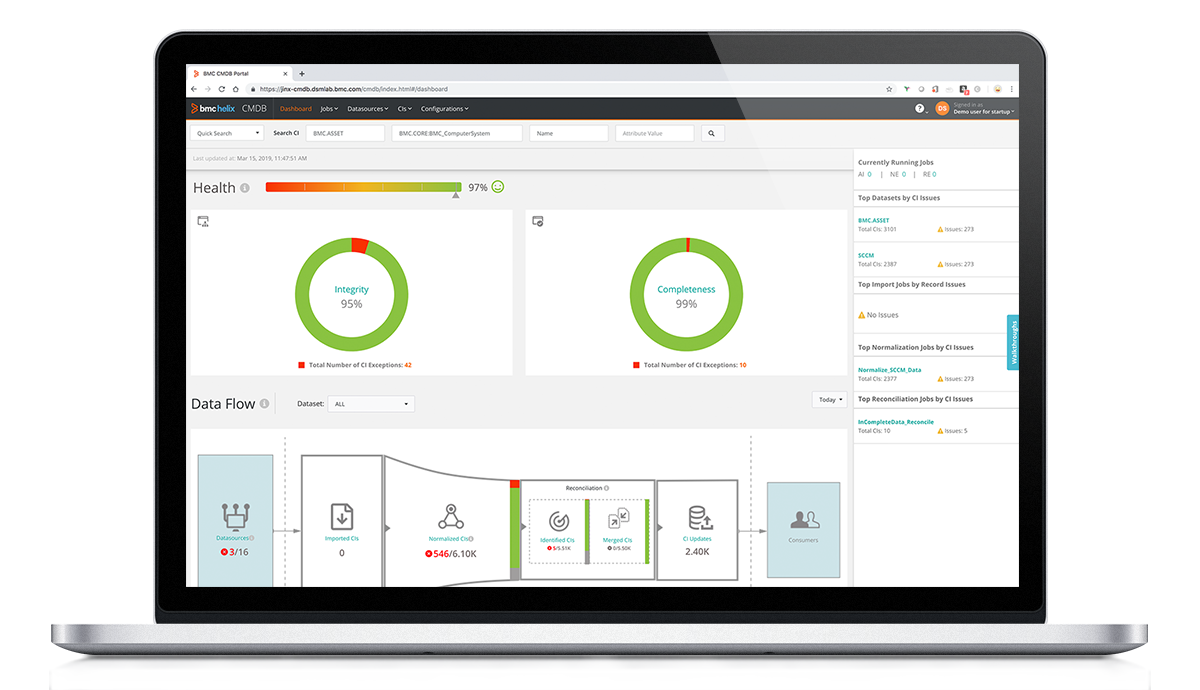
BMC Helix Discovery provides a view of IT assets, services and the relationships between them across cloud and on-premises environments. Discovery runs agentlessly and continuously, and the resulting topology data can be ingested into the wider BMC Helix platform alongside third-party data.
Alongside discovery, the product covers application and service mapping, automated data reconciliation, and asset data used for security and compliance work. It is available as SaaS or on-premises, and remote environments are scanned through registered Discovery outposts.
Key features include:
- Agentless continuous discovery: Automatically discovers assets and maps relationships across cloud and on-premises environments, keeping data current without manual updates.
- Blueprint-automated service modeling: Uses a library of service modeling blueprints to build views of the infrastructure supporting specific business needs.
- Automated data reconciliation: Unifies data from multiple topology sources so that duplicate or conflicting records resolve into a single view.
- Blind spot detection: Exposes hidden or undocumented assets, dependencies and relationships that are missing from existing records.
- Real-time service awareness: Connects service models, topology and telemetry so that root causes can be located and related impacts visualized.
- Compliance inventories: Maintains automated, detailed asset inventories in a baseline dashboard that stay up to date for audits.
- SSL/TLS certificate management: Discovers and manages security certificates across the organization’s infrastructure.
- Deployment options: Available for SaaS or on-premises deployment, with Discovery outposts registered and installed to reach distributed environments.
Limitations (as reported by users on G2):
- Cost and add-on licensing: Reviewers frequently describe the product as expensive relative to competitors, with additional licensing for add-ons.
- Appliance storage ceiling: Several users note that appliance system disks larger than 2TB are not supported, which they consider restrictive for large data volumes.
- Interface learning curve: A number of reviewers say the interface is not intuitive for newer users and that some views could be more interactive.
- Upgrade downtime: One reviewer notes that production access has to be stopped while an upgrade runs.
- Support for newly released software: Users mention that support for newly released software can lag, and that integration with other BMC tools has room to improve.
Source: BMC
Network and Infrastructure Mapping Solutions
5. Auvik

Best for: Layer 1 to 3 network topology across multi-site networks
Strengths: Continuous discovery, alert overlay and map exports
Things to consider: Device-count pricing and alert tuning effort
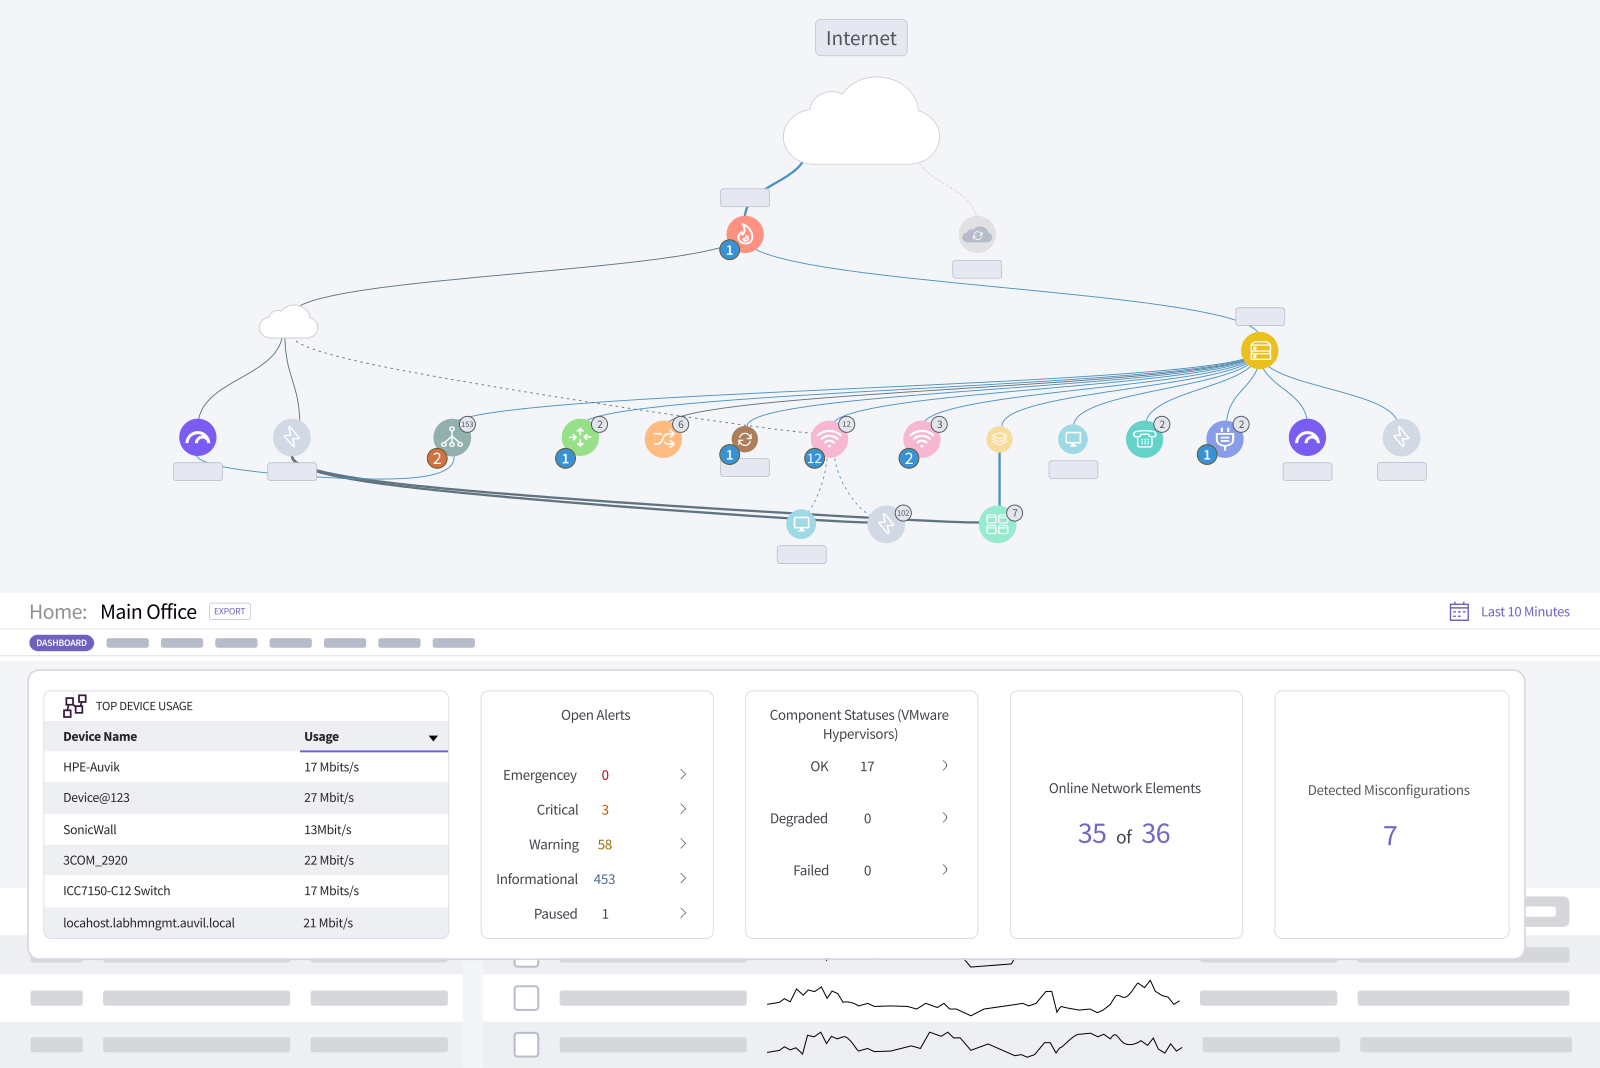
Auvik produces an interactive network topology map that is built automatically and kept current as the environment changes. It maps physical, logical and virtual layers by pulling data from CDP, LLDP, forwarding tables, ARP tables, IP assignments and VLAN associations, covering Layers 1, 2 and 3 in one view.
Users can start from a global view of all sites and drill into a single subnet, device or port. Alerts appear on the map itself, historical states can be replayed, and maps can be filtered, searched and exported for documentation, client reporting or audits.
Key features include:
- Multi-layer topology mapping: Builds physical, logical and virtual views across Layers 1, 2 and 3 using CDP, LLDP, forwarding tables, ARP tables, IP assignments and VLAN associations.
- Continuous discovery and real-time updates: Scans the network continuously and updates the topology when a switch is added, a firewall is reconfigured, trunk port VLANs change or a device moves to a different subnet.
- Alert overlay and in-map troubleshooting: Active alerts are displayed on affected devices with color-coded severity, can be assigned to teams and annotated, and ping and traceroute can be run directly from the map.
- Path tracing with Northstar: Selecting a device shows a mini map of the path it takes to the internet, with each hop inspectable upstream and downstream.
- Historical topology: Keeps a historical record so the map can be rewound to a specific past moment to investigate what changed.
- Custom views and exports: Maps can be filtered by device type, connection type, network segment or role, saved as custom views, and exported to Visio, SVG, PDF or Lucidchart.
- Documentation and reporting: Automatically documents devices, interfaces, IPs, vendors, models and physical and logical connectivity, and generates topology reports for NIST, PCI, HIPAA, SOC 2 and ISO reviews.
- Role-based access control: Filters and restricts map data by user role or team so each group sees only the relevant devices and sites.
Limitations (as reported by users on G2):
- Device identification accuracy: Reviewers report occasional misidentification and correlation issues, including retired devices still appearing in inventory after an IP is reassigned.
- Alert tuning: Multiple users describe alerting as noisy out of the box, requiring time to adjust thresholds and suppress unwanted device checks.
- Pricing at scale: Device-count pricing is noted as climbing quickly as sites and hardware are added, with limited flexibility between core and edge devices.
- Map presentation gaps: Reviewers mention there is no top-level diagram for organizations with multiple sites, and that exported maps cannot be expanded or collapsed by recipients.
- Navigation density: Some users find the menu structure layered and the interface less intuitive when locating specific details.

Source: Auvik

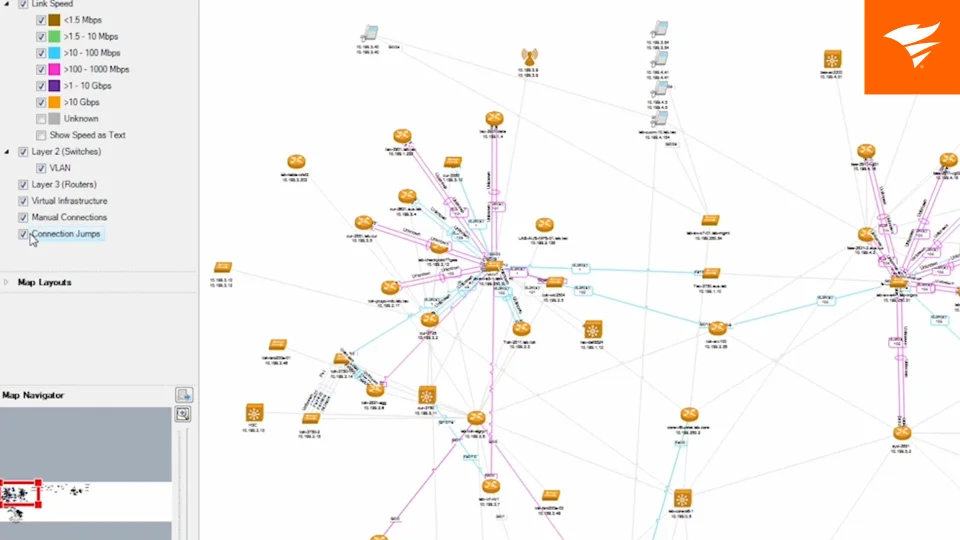
6. SolarWinds Topology Mapper
Best for: Automated Layer 2 and Layer 3 network diagrams
Strengths: Multiple maps from one scan, exported to Visio, PDF, PNG
Things to consider: Mapping only, without performance monitoring built in
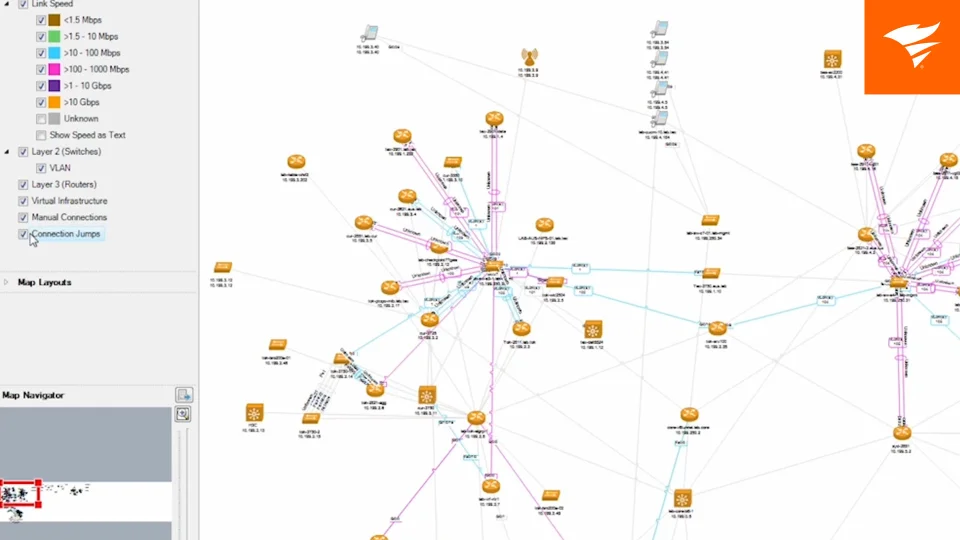
SolarWinds Network Topology Mapper (NTM) is a dedicated network mapping tool that discovers devices across a network and generates logical topology diagrams from their connections. Discovery uses multiple methods, and the result is an integrated map combining OSI Layer 2 and Layer 3 data with device detail.
A single scan can be reused to produce several different maps and segmentation diagrams without rescanning. Scheduled scanning keeps records current as devices are added or changed, and maps and inventory reports can be exported for documentation and compliance purposes.
Key features include:
- Multi-method autodiscovery: Discovers devices using ICMP, SNMP, WMI, CDP, VMware and Microsoft Hyper-V, and detects when devices change or new devices appear.
- Integrated Layer 2 and Layer 3 maps: Multi-level discovery produces a single diagram combining OSI Layer 2 and Layer 3 topology with detailed device information.
- Multiple maps from one scan: Builds several network maps and segmentation diagrams from the same scan data, without repeating the discovery process.
- Scheduled rescanning: Scheduled network scans detect new devices, topology changes and unknown systems so the record stays accurate over time.
- Export and documentation: Exports maps to Microsoft Visio, PDF and PNG. Visio exports populate SmartShapes with discovery data, and updated exports can be scheduled to Orion Network Atlas.
- Compliance support: Maps are used to address documentation requirements for PCI, SOX, HIPAA and FIPS 140-2, and the software itself is FIPS 140-2 compliant.
- Network inventory management: Inventories hardware assets and automates the creation of device reports.
- Manual map editing: Node details on map objects can be edited and devices connected manually where discovery does not capture a link.
Limitations (based on publicly available sources):
- Licensing cost: Reviewers on PeerSpot describe the product as expensive and note that licensing costs are on the high side.
- Mapping scope: The product is positioned for logical topology mapping and diagramming. Performance measurement and alerting are handled by separate SolarWinds products such as Network Performance Monitor.
- Windows-only, admin-restricted: Vendor documentation states the application is installed on a Windows server and that only Windows administrators or users with administrative privileges can use it.
- Layout behavior on large maps: Vendor release notes have listed known issues including orthogonal map layout working unreliably with large maps.
- Discovery gaps: Release notes have also documented issues such as missing Layer 2 connections between switches and connections being detected that do not actually exist.
Source: SolarWinds
7. Paessler PRTG

Best for: Network maps combined with sensor-based monitoring
Strengths: Drag-and-drop map editor plus automated L2/L3 add-on
Things to consider: Sensor licensing costs grow as coverage expands
Paessler PRTG combines network mapping with infrastructure monitoring, so maps show both what is connected and how each component is performing. After automatic discovery detects switches, routers, firewalls, servers, storage systems, virtual servers and applications, devices can be placed into structured maps.
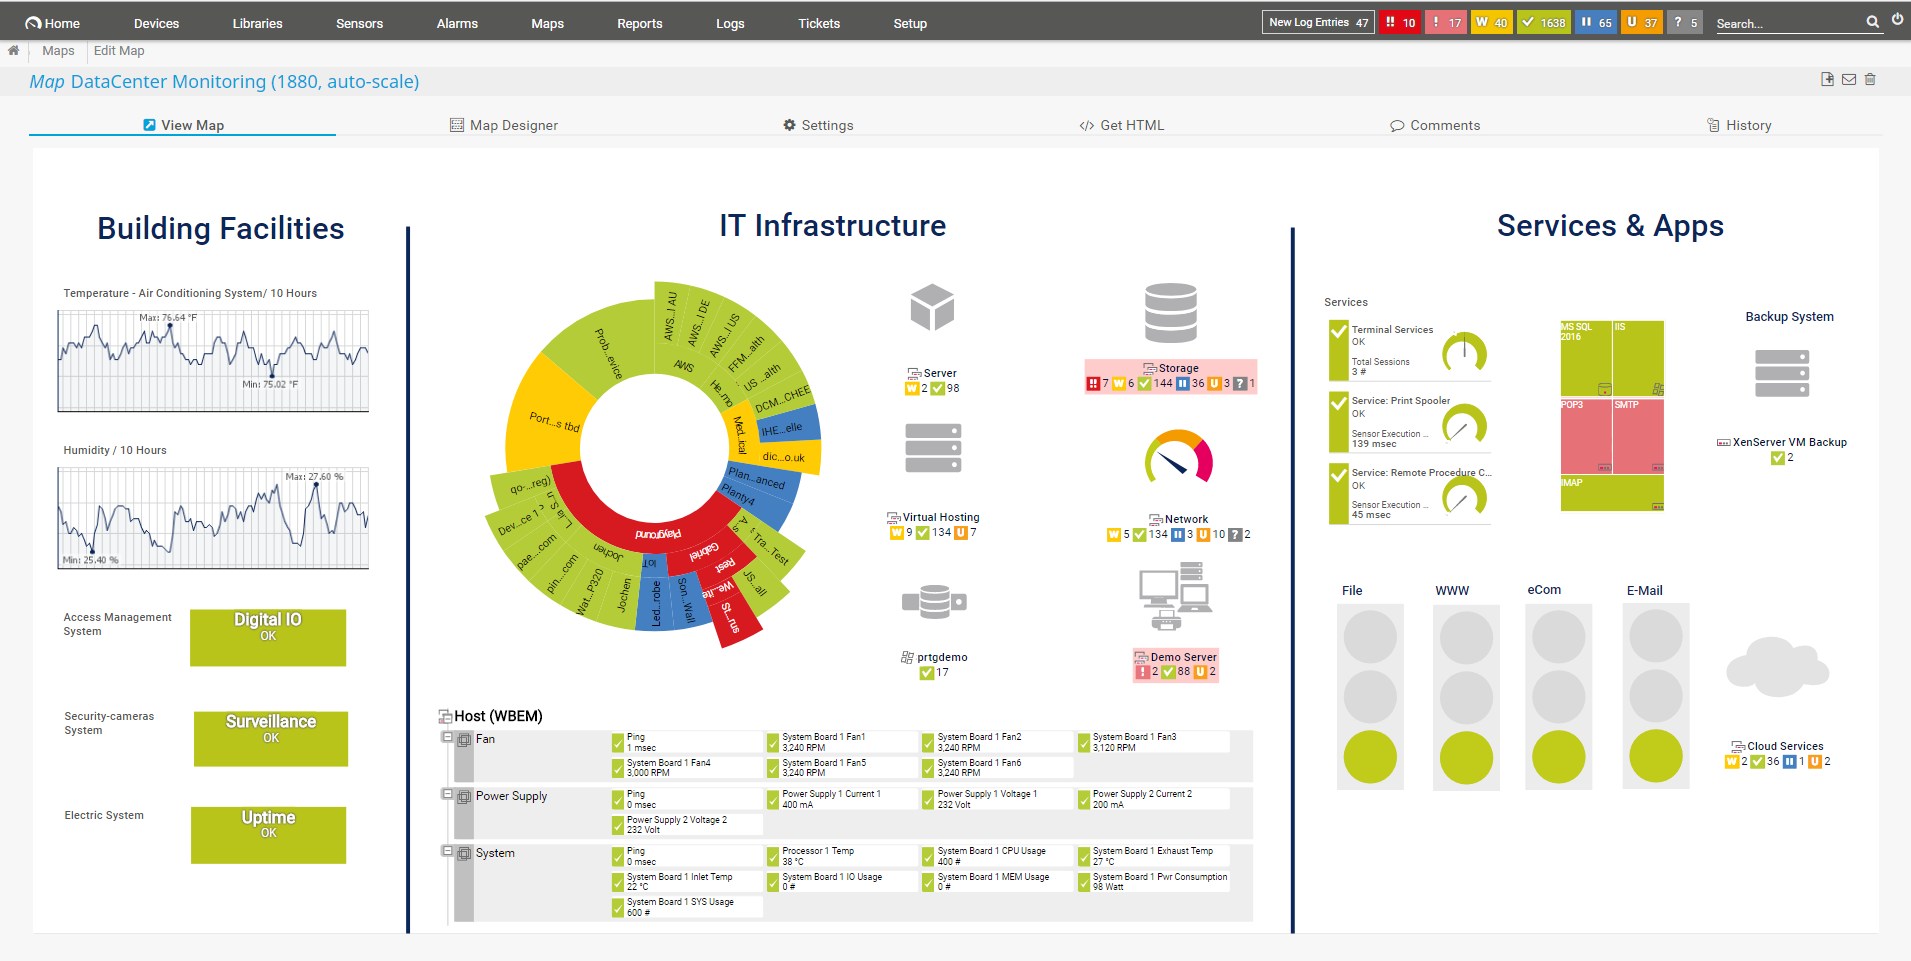
Mapping is done through a built-in drag-and-drop editor, with an optional companion product, Paessler PRTG UVexplorer, adding automated Layer 2 and Layer 3 topology discovery. Maps and dashboards are interactive, color-coded, and shareable through unique URLs.
Key features include:
- Drag-and-drop map editor: Builds maps and dashboards from a library of device and status icons, symbols and images, with discovered devices placed into structured layouts.
- Automated Layer 2 and Layer 3 topology with UVexplorer: A companion Paessler product discovers and maps topology down to port level using SNMP, WMI and SSH on scheduled discoveries, and surfaces those maps inside PRTG.
- Dependency context: Selecting a device on the topology map shows what sits upstream and what sits downstream of it, so the scope of an alert can be established without manual tracing.
- Configuration change history: Scheduled discoveries and point-in-time snapshots record how topology and device configurations change, with a built-in diff viewer for comparing two configuration versions.
- Sunburst view: Displays the entire network and its current status in near real time, with color coding and clickable map items for faster drill-down.
- Custom multi-layer maps: Custom HTML can be used to build maps with multiple layers to drill through, and background images such as floor plans can be added to show device locations.
- Shareable dashboards: Each dashboard has a unique URL that can be published internally, shared externally, displayed on network operations center screens, or embedded in another web page via iFrame.
- Sensor-based monitoring: Sensors measure individual values such as switch port traffic, server CPU load or free disk space, with roughly 5 to 10 sensors typically used per device.
Limitations (as reported by users on G2):
- Sensor licensing costs: Reviewers note that costs rise as sensor counts grow, and that a single device can consume several sensors, making budgeting harder as coverage expands.
- Interface age and responsiveness: Users describe the web interface as dated and note that it can slow down on larger dashboards. The desktop client is described as less useful.
- Custom sensors and reporting effort: Reviewers report needing documentation and trial-and-error scripting to build reliable custom sensors, REST checks and management-ready reports.
- Behavior at scale: Some users say the product works well until environments approach larger real-world scale, at which point more tuning is needed.
Source: Paessler
8. ManageEngine OpManager
Best for: Layer 2 topology with 3D rack and floor data center views
Strengths: Several map types, grouping and scheduled rediscovery
Things to consider: Setup complexity and add-on licensing for some features
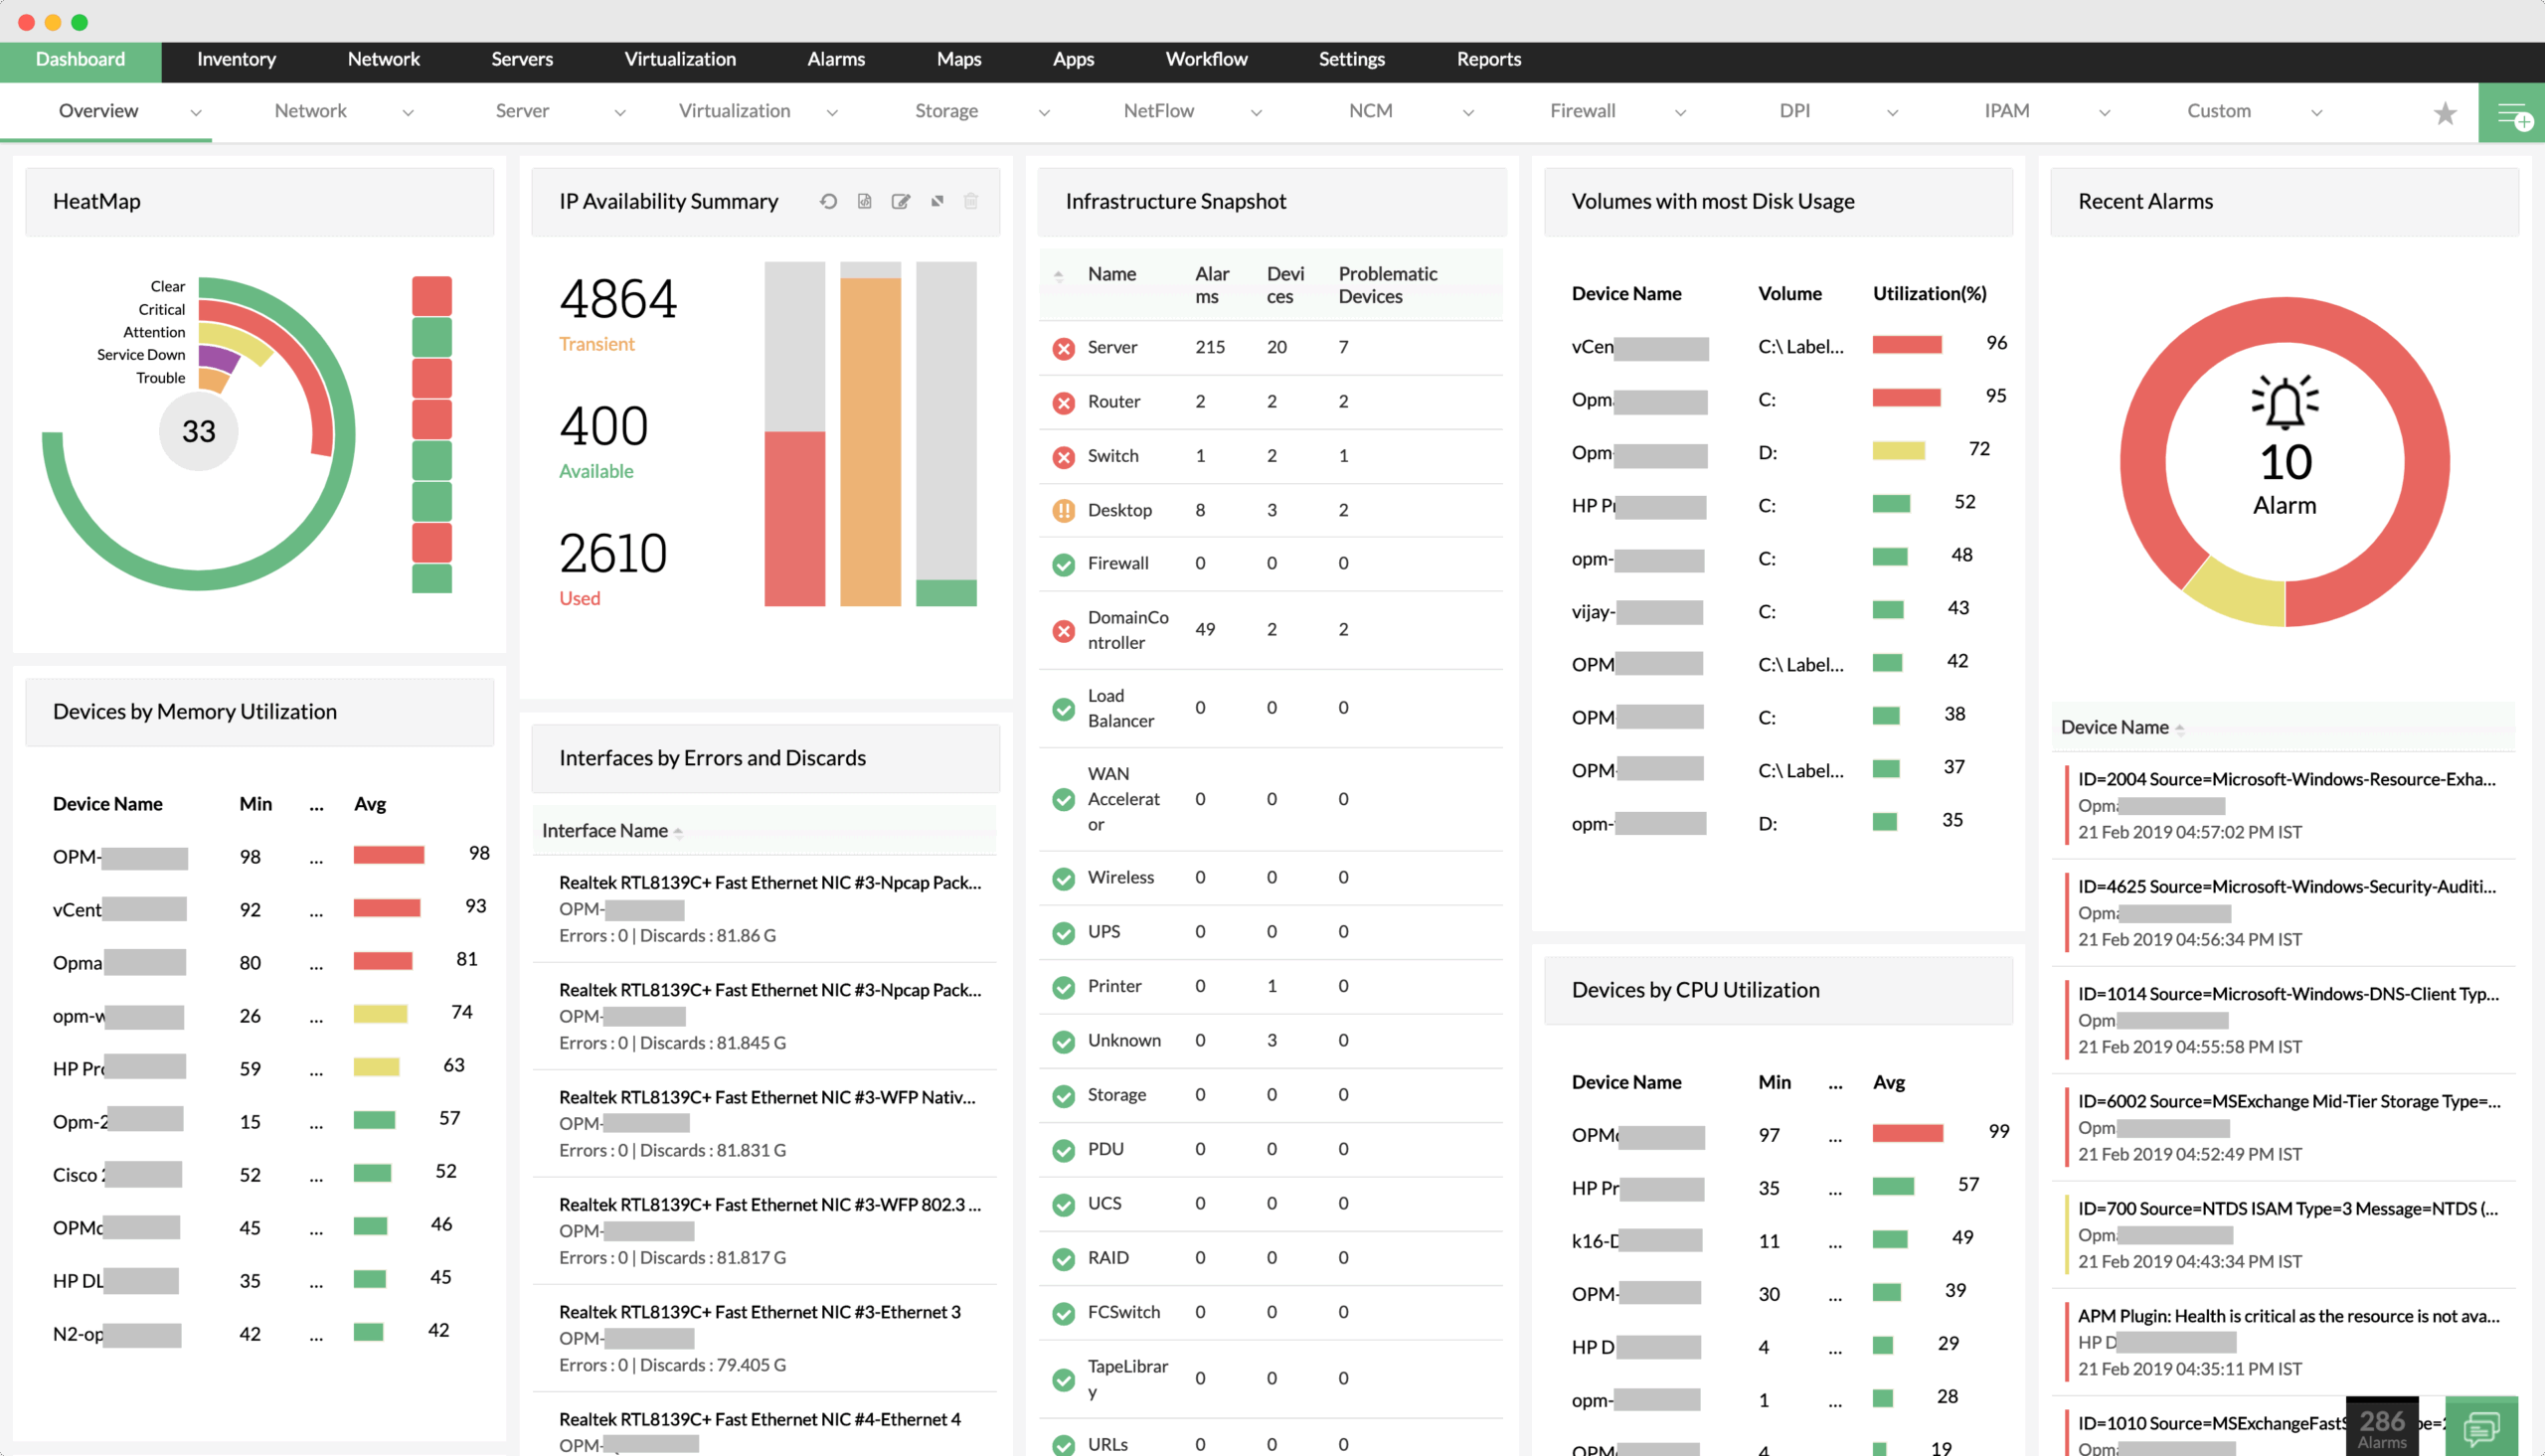
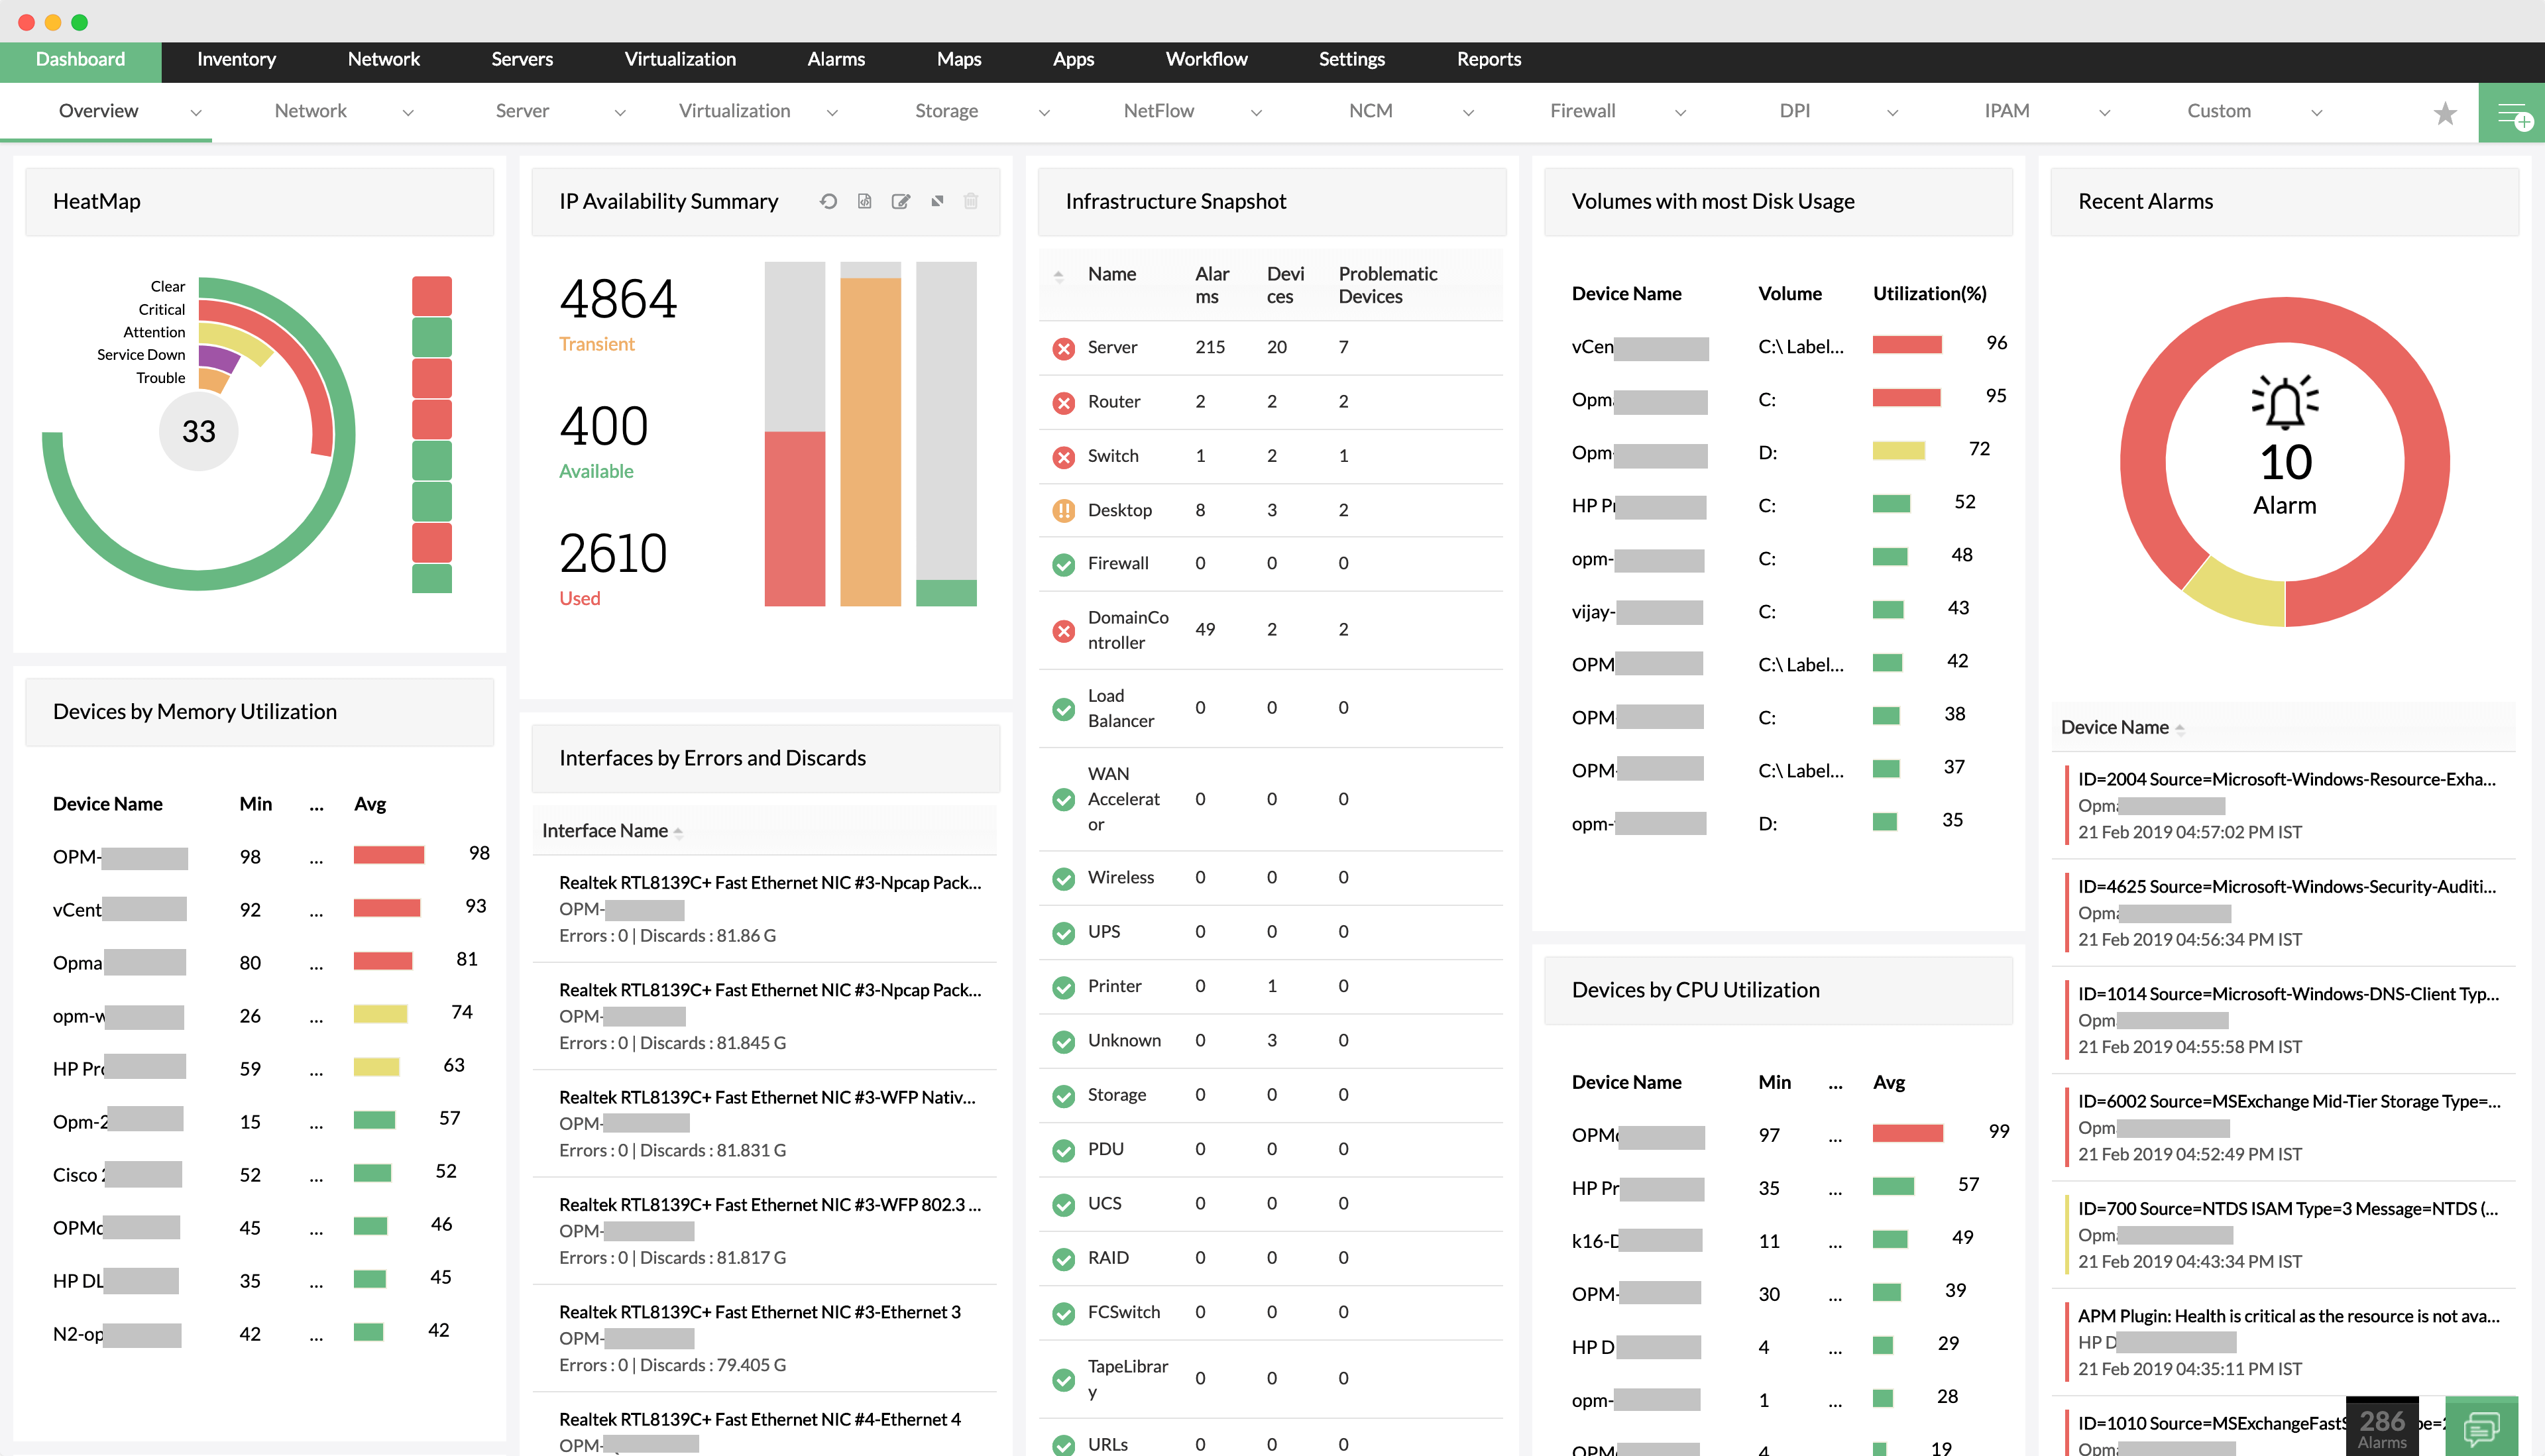
ManageEngine OpManager provides automatic network topology mapping alongside network, server and storage monitoring. Layer 2 discovery draws nodes, interconnected layers and port-to-port connectivity, covering servers, desktops, virtual machines, firewalls and other devices on the network.
The product offers four visualization options: Business Views, Layer 2 maps, 3D floor views and 3D rack views. Devices can be grouped for bulk changes, topological views can be combined into dashboards, and reports can be scheduled and exported.
Key features include:
- Layer 2 discovery and mapping: Discovers Layer 2 devices and draws nodes, interconnected layers, interfaces and port-to-port connectivity using CDP, LLDP, IPROUTE, FDB and ARP, with scheduling to reflect device additions and removals.
- Business Views: Represent devices graphically according to the business service or operation they support, with user-defined links between devices, the option to save a Layer 2 map as a Business View, and geographic maps for data center locations.
- Virtual infrastructure mapping: Maps VMware, Hyper-V, Xen and Nutanix environments, with selective views including host to VM, host to network, host to datastore, VM to network and VM to datastore.
- 3D floor and rack views: Shows servers and switches on each floor of a data center or server room, and racks in their exact physical arrangement, using color codes. Clicking a device opens its snapshot page for fault diagnosis.
- Device dependencies: Setting device dependencies automatically maps dependent Layer 2 devices, and choosing a seed device reduces false alerts caused by those dependencies.
- Grouping and bulk changes: Groups devices and interfaces by department, floor, location, interface type, criticality or business-defined groups, and applies configuration changes across multiple devices at once.
- Dashboards: Multiple topological views can be added as widgets in a single window, with color-coded alarms and single-click refresh.
- Scheduled reporting: Reports cover discovered devices, interfaces, group performance, availability and activity, can be generated for devices in Business Views, and are delivered daily, weekly or monthly in PDF or XLS, including custom and Top N reports.
Limitations (as reported by users on G2):
- Setup and configuration complexity: Reviewers describe initial setup and configuration as involved, particularly for new users and larger environments.
- Add-on licensing: Some advanced capabilities require additional licensing beyond the base product.
- Reporting and customization: Users note that reporting and customization options could be more user-friendly.
- Scalability and interface responsiveness: Reviewers mention that scalability and interface responsiveness have room for improvement in larger deployments.
- Alert tuning: Without customization, some users report the platform generating excessive alerts, and note that not all MIBs are available for creating specialized alerts.
Source: ManageEngine
Considerations for Choosing IT Mapping Solutions for IT Managers
Selecting an IT mapping solution requires more than comparing visualization features. IT managers should evaluate how well a platform discovers assets, maintains accurate relationship data, integrates with existing management tools, and scales with the organization’s infrastructure. The following considerations can help narrow the options:
- Discovery capabilities: Verify that the solution supports automated discovery across on-premises, cloud, hybrid, virtual, and containerized environments.
- Mapping accuracy: Look for tools that continuously update topology and dependency maps to reflect infrastructure changes without requiring manual intervention.
- Application dependency mapping: Ensure the platform can automatically identify relationships between applications, services, databases, and infrastructure components.
- Scalability: Choose a solution that can handle growing numbers of assets and distributed environments without significant performance degradation.
- Integration with existing tools: Confirm compatibility with CMDB, ITSM, monitoring, observability, and security platforms to avoid isolated data.
- Visualization and reporting: Evaluate whether the solution provides clear, customizable maps and dashboards that support troubleshooting and operational planning.
- Change detection: Prioritize platforms that detect infrastructure and configuration changes in near real time and maintain historical change records.
- Ease of deployment: Consider implementation complexity, ongoing maintenance requirements, and whether the solution supports agent-based or agentless discovery.
- Security and access controls: Look for role-based access, encryption, audit logging, and compliance features appropriate for your organization’s security requirements.
- Vendor support and roadmap: Assess documentation, technical support quality, update frequency, and the vendor’s commitment to supporting new technologies and cloud platforms.
- Licensing and total cost of ownership: Compare pricing models, infrastructure requirements, and operational costs to ensure the solution remains cost-effective as the environment grows.
Related content: Read our guide to network mapping tools
Conclusion
IT mapping solutions provide organizations with the visibility needed to manage increasingly complex infrastructures. By automating discovery and visualizing dependencies, they reduce blind spots, improve response times, and support more reliable change management. Beyond day-to-day operations, these solutions help align IT systems with business objectives by enabling informed decision-making, strengthening compliance efforts, and improving overall resilience.