
TL;DR: Network mapping tools discover, visualize and document the devices, connections and traffic flows across an infrastructure. For free options, Nmap is best for fast discovery and port scanning, LibreNMS for automated topology plus monitoring, Wireshark for deep packet analysis, and draw.io for free manual network diagrams.
What Are Network Mapping Tools?
Network mapping tools create visual representations of a network’s architecture, showing connections between devices, systems, and nodes. These tools help administrators quickly understand how network components interact, improving troubleshooting and optimization efforts.
By providing an organized view, mapping tools can highlight inefficiencies, misconfigurations, or potential security risks. They are crucial in both IT operations and cybersecurity for identifying vulnerabilities or bottlenecks within network infrastructure. Different tools offer varying levels of detail and automation.
Key benefits of network mapping include:
- Improved Network Visibility: Provides a clear view of connected devices, network topology, and communication paths, helping administrators understand how the infrastructure is organized.
- Faster Troubleshooting: Helps identify failed devices, broken connections, and network bottlenecks, reducing the time needed to diagnose and resolve issues.
- Enhanced Network Security: Reveals unauthorized devices, unexpected connections, and potential security gaps that could expose the network to attacks.
- Better Network Performance: Helps administrators identify congested links, inefficient routing, and overloaded devices that may affect network speed and reliability.
- Simplified Network Documentation: Maintains an organized record of ne
Network Mapping Tools at a Glance
The table below summarizes the key differences between the tools covered in this guide; we explore each in more detail in the sections that follow.
|
Category |
Solution |
Best For |
Key Strengths |
Things to Consider |
|
Network Discovery and Mapping |
Nmap |
Discovery, port scanning and security auditing |
Flexible scan techniques, OS/version detection, NSE scripting |
Steep learning curve; reporting limited to XML |
|
Network Discovery and Mapping |
Netdisco |
Locating devices by IP/MAC and L2 topology |
SNMP/CLI inventory, switch port mapping, port control |
Requires PostgreSQL; config via YAML |
|
Network Discovery and Mapping |
LibreNMS |
Auto-discovery plus ongoing monitoring |
CDP/LLDP/ARP discovery, network and dependency maps, alerting |
Can be CPU-heavy on large networks |
|
Network Monitoring and Traffic Analysis |
Cacti |
RRDTool-based graphing and polling |
SNMP polling, templates, distributed collection |
Updates and plugin setup can be complex |
|
Network Monitoring and Traffic Analysis |
Wireshark |
Deep packet inspection |
Hundreds of protocols, live/offline capture, filters |
Steep learning curve; laggy on huge captures |
|
Network Monitoring and Traffic Analysis |
OpenNMS Horizon |
Fault, performance and flow monitoring |
Discovery, flow collection, topology maps, scalability |
Much config via XML files |
|
Security, Recon and Diagramming |
Bettercap |
Recon and MITM testing |
WiFi/BLE/HID/IPv4-6 recon, spoofers, sniffer, REST API |
Steep learning curve; use only on authorized networks |
|
Security, Recon and Diagramming |
Lucidchart |
Collaborative network diagrams |
Templates, shape libraries, real-time collaboration |
Free plan caps documents/objects; paid for full features |
|
Security, Recon and Diagramming |
Aircrack-ng |
WiFi security assessment |
Capture, injection, WEP/WPA cracking, scriptable |
Needs compatible adapter; command-line only |
|
Security, Recon and Diagramming |
draw.io |
Free manual network diagrams |
Free, private storage, large shape library, integrations |
No live discovery; interface feels dated |
This is part of a series of articles about IT Mapping
Network Mapping Market and Trends
According to recent market research, the network mapping software market is expected to grow steadily over the coming years. Industry forecasts estimate an annual growth rate of about 7.9% between 2026 and 2033. This growth is largely driven by the increasing complexity of modern IT infrastructures and the growing need for tools that can visualize and manage networks effectively.
Organizations rely more on digital services, cloud systems, and connected devices. As a result, IT teams require software that can clearly map network components, monitor connections, and help resolve issues quickly. Rising cybersecurity concerns and the broader digital transformation across industries are also increasing demand for these tools.
Several emerging technologies and infrastructure developments are reshaping network mapping capabilities:
- AI-powered network discovery and analysis: AI and machine learning can help identify network devices, classify assets, recognize unusual connectivity patterns, and correlate network events. AI-assisted analysis can also help administrators investigate root causes and prioritize issues based on their potential impact.
- Continuous and automated topology mapping: Modern network mapping tools increasingly use automated discovery and change detection to update network diagrams as infrastructure changes. This is particularly valuable in dynamic environments where cloud resources, virtual machines, and network configurations frequently change.
- Hybrid and multicloud network mapping: As organizations distribute workloads across on-premises infrastructure, AWS, Azure, Google Cloud, and other environments, mapping tools must visualize connections across different platforms. This includes virtual networks, cloud gateways, VPNs, firewalls, and intercloud connectivity.
- Kubernetes and container network visibility: Containerized applications introduce short-lived workloads, dynamically assigned IP addresses, and complex service-to-service communication. Advanced mapping tools are increasingly incorporating Kubernetes-aware discovery to visualize clusters, nodes, services, and application dependencies.
- Network digital twins and predictive analysis: Network digital twins use models of network topology, configuration, and behavior to simulate changes and evaluate potential failures. Combined with automated path analysis, these capabilities can help teams evaluate network modifications before deploying them in production.
How Network Mapping Tools Work
Let’s review the typical operating process of network mapping solutions:
- Scanning the network to identify connected devices, including routers, switches, servers, and workstations. These tools use protocols such as SNMP (Simple Network Management Protocol) to collect device information, including IP addresses, interface details, and operational status. ICMP (Internet Control Message Protocol) helps determine whether devices are reachable.
- ARP (Address Resolution Protocol) scans identify devices on local network segments by matching IP addresses with MAC addresses. By combining information from these protocols, network mapping tools create an inventory of discovered devices and their characteristics.
- Determining how devices connect to each other. LLDP (Link Layer Discovery Protocol) allows devices from different vendors to exchange information about their identities, interfaces, and neighboring connections. CDP (Cisco Discovery Protocol) performs a similar function for supported Cisco devices.
- Analyzing switch MAC address tables to determine which devices are reachable through specific switch ports. This information helps identify device locations and infer connections when neighbor discovery protocols are unavailable. By combining LLDP, CDP, and switch table data, the tools build topology maps that show physical network connections and help trace communication paths.
- Analyzing traffic flows to show how data moves between devices and network segments. Technologies such as NetFlow, sFlow, and IPFIX collect information about traffic sources, destinations, protocols, and data volumes. This information helps administrators identify heavily used connections, bandwidth bottlenecks, and unusual communication patterns.
- Change detection allows network mapping tools to identify modifications to network infrastructure over time. By comparing current discovery results with previously collected data, they can detect newly connected devices, removed equipment, interface changes, and altered network connections. Advanced tools automatically update topology maps and generate alerts when unexpected changes occur.
Types of Network Maps
Physical Network Maps
Physical network maps show the actual layout of network infrastructure, including routers, switches, servers, firewalls, and the cables connecting them. They represent how devices are physically connected, often showing details such as switch ports, rack locations, and connection types. These maps help administrators understand the hardware structure of a network and identify where specific devices are located.
Physical network maps are particularly useful for troubleshooting hardware failures, managing cabling, and planning infrastructure upgrades. For example, when a switch fails, administrators can use a physical map to identify affected devices and trace their connections. These maps also simplify maintenance by providing a clear reference for equipment installations, replacements, and network expansions.
Logical Network Maps
Logical network maps illustrate how devices communicate across a network, regardless of their physical locations. They show elements such as IP subnets, VLANs, routing paths, and network segments. Unlike physical maps, which focus on hardware connections, logical maps explain how network traffic moves between systems and how different parts of the network are organized.
Administrators use logical network maps to troubleshoot connectivity issues, analyze routing configurations, and understand network segmentation. For example, a logical map can help identify why devices in different VLANs cannot communicate or where traffic passes through a firewall. These maps are also useful for reviewing network security boundaries and planning changes to IP addressing or routing configurations.
Application Dependency Maps
Application dependency maps show how applications, servers, databases, and network services interact to support business operations. They identify communication paths between application components, including API connections, database queries, and service-to-service traffic. Unlike physical and logical network maps, application dependency maps focus on the relationships between software systems and the infrastructure they depend on.
These maps help IT teams understand how infrastructure failures or configuration changes may affect applications. For example, if a database server becomes unavailable, an application dependency map can identify which applications rely on it. They are also useful for troubleshooting application performance, planning cloud migrations, and assessing the impact of infrastructure changes before deployment.
Key Features of Network Mapping Tools
Network mapping tools vary in complexity, but most share a core set of capabilities. These features help teams visualize network structure, monitor connectivity, and maintain accurate documentation. Below are the key functions commonly found in these tools.
- Automatic network discovery: Scans the network to detect devices, connections, and subnets. Uses protocols such as SNMP, ICMP, or LLDP to gather data without manual input.
- Topology visualization: Generates visual maps that show how devices are connected. Views may include physical, logical, or hybrid topologies.
- Real-time monitoring: Displays current device status, link health, and connectivity changes. Helps teams detect outages or performance issues quickly.
- Device and interface details: Provides information about routers, switches, servers, firewalls, and endpoints. May include IP addresses, MAC addresses, firmware versions, and port usage.
- Dependency mapping: Identifies relationships between systems and services. Useful for understanding the impact of device failures or configuration changes.
- Alerting and notifications: Sends alerts when devices go offline or when performance thresholds are exceeded. Supports faster incident response.
- Customizable map views: Allows filtering by device type, location, VLAN, or subnet. Helps large organizations focus on specific network segments.
- Export and reporting capabilities: Generates reports or exports diagrams for documentation and audits. Supports formats such as PDF, PNG, or Visio files.
- Integration with other tools: Connects with monitoring platforms, configuration management systems, or security tools. Enables centralized visibility and automation.
These features help organizations maintain visibility into network structure and performance, reducing downtime and simplifying troubleshooting.
Free vs. Paid Network Mapping Tools
Free tools are often open source or community-supported. They are suitable for small to mid-sized networks or teams with limited budgets.
Key aspects of free network mapping tools:
- Low or no cost: No licensing fees. Some tools offer optional paid support or premium add-ons.
- Basic discovery and mapping: Provide core features such as device discovery and topology visualization. Advanced automation may be limited.
- Manual configuration requirements: Often require more setup and tuning. Documentation may be less structured.
- Community support: Support typically comes from forums or user communities. Response times vary.
- Limited scalability: May struggle with very large or highly dynamic environments.
Paid network mapping tools target enterprises with complex infrastructure:
- Advanced automation: Offer automated discovery, real-time updates, and dependency mapping with minimal manual input.
- Scalability and performance: Designed to handle large, distributed networks with thousands of devices.
- Vendor support and SLAs: Include formal technical support, updates, and service level agreements.
- Integrated ecosystem: Often integrate with monitoring, security, and configuration management platforms from the same vendor.
- Enhanced security and compliance features: Provide audit trails, role-based access control, and reporting aligned with compliance requirements.
Paid tools are better suited for enterprises that require reliability, compliance support, and dedicated vendor assistance.
In practice, organizations often start with free tools and transition to proprietary solutions as network complexity and operational demands increase.
Top 3 Cost-Effective Network Mapping Tools (In Brief)
We know, this article promised free tools and the very next section lists the top 10 free forever tools you can use to map your network. However, we wanted to give you a taste of 3 solutions that are not free, but are cost effective and provide powerful functionality.
Network Discovery and Mapping
1. Faddom

Best for: Agentless application dependency and network mapping in hybrid IT
Key strengths: Traffic-based maps with no agents, credentials, or installs
Things to consider: Priced by server count; free plan covers up to 50 servers
Features summary: Faddom is an agentless, self-service platform that maps application dependencies and visualizes on-premises and cloud infrastructure. It supports VMware, KVM, Nutanix, Hyper-V, and physical servers, as well as AWS, Azure, Google Cloud, Oracle Cloud, and Kubernetes. It also maps physical routers and switches over SNMP, with daily or weekly scheduled scans.
2. Domotz
Best for: MSPs and IT teams monitoring networks across multiple sites
Key strengths: Flat per-device pricing with topology maps and remote access
Things to consider: Needs a collector at each site; costs grow with device count
Features summary: Domotz provides automatic device discovery, network topology mapping, real-time alerts, and uptime reporting. It supports SNMP-based device monitoring, network diagnostics, and custom alerting. Built-in remote access lets technicians connect to devices over RDP, SSH, Telnet, and HTTP/HTTPS without visiting the site.
3. ManageEngine OpManager
Best for: Teams that want network mapping inside a full monitoring suite
Key strengths: Auto discovery, topology maps, and device-based license tiers
Things to consider: Traffic analysis and config management are paid add-ons
Features summary: OpManager is a network management platform that covers network and server monitoring, bandwidth analysis, configuration management, and fault management. It discovers network devices automatically and builds topology maps, with options for Layer 2 discovery, virtual environment maps, and Google Maps and Zoho Maps integration.
Top 10 Free Network Mapping Tools
How we selected these tools: We shortlisted free network mapping tools based on network discovery, topology visualization, traffic analysis, and documentation capabilities.
Network Discovery and Mapping
1. LibreNMS
LibreNMS is a free, open source network monitoring system with broad device support. It automatically discovers an entire network using CDP, FDP, LLDP, OSPF, BGP, SNMP and ARP, and provides a mobile-friendly web interface. It supports multiple authentication methods including MySQL, HTTP, LDAP, Radius and Active Directory, and integrates with tools such as collectd, SmokePing, RANCID and Oxidized.
Alongside discovery, LibreNMS generates network maps and dependency maps so administrators can see how devices connect and which devices depend on others. It offers a flexible alerting system, a full API, distributed polling for horizontal scaling, and native iPhone and Android apps for core functionality.
Best for: Automated discovery combined with ongoing network monitoring.
Strengths: Multi-protocol auto-discovery, network and dependency maps, and flexible alerting.
Things to consider: Can consume significant CPU on larger networks.
Key features include:
- Automatic discovery: Discovers the network using CDP, FDP, LLDP, OSPF, BGP, SNMP and ARP, reducing manual device setup.
- Network and dependency maps: Generates automatic network maps from neighbor-discovery or MAC data and dynamic dependency maps based on configured device dependencies.
- Customizable alerting: Provides a flexible alerting system that notifies via email, IRC, Slack and other channels.
- Distributed polling and API: Supports horizontal scaling through distributed polling and offers a full API to manage, graph and retrieve data.
- Mobile access: Offers native iPhone and Android apps and a mobile-friendly web UI for monitoring on the go.
Limitations (as reported by users on G2):
- Resource usage: Users report it can consume a lot of resources, particularly CPU, so resources should be sized to the number of monitored devices.
- Reporting and desktop access: Some users note the lack of a desktop application for live reporting, requiring reliance on the browser.
- High availability: Reviewers mention that high availability options such as disaster recovery are not readily available.
2. Nmap

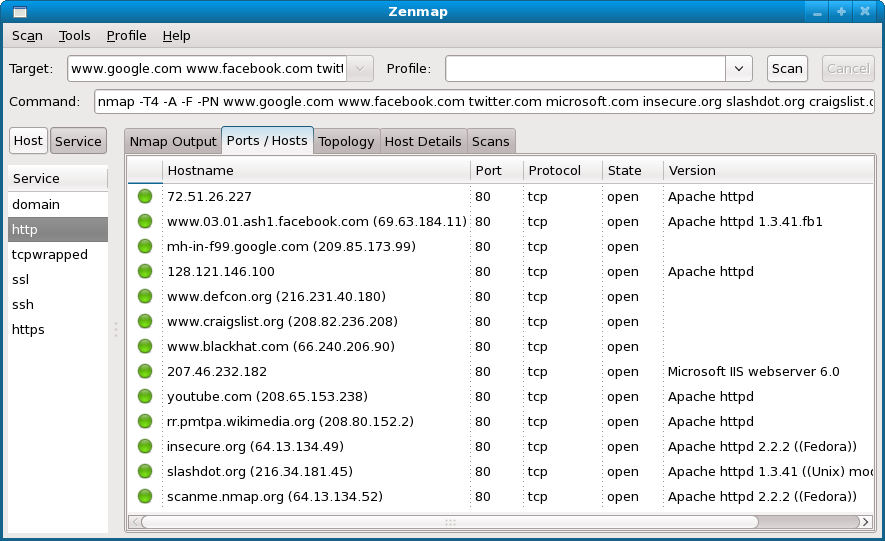
Nmap (“Network Mapper”) is a free and open source utility for network discovery and security auditing. It uses raw IP packets to determine which hosts are available on a network, what services and application versions those hosts offer, what operating systems they run, and what packet filters or firewalls are in use. It was designed to scan large networks but works against single hosts as well.
Beyond the command-line executable, the suite includes the Zenmap GUI and results viewer, the Ncat data transfer and debugging tool, the Ndiff scan comparison utility, and the Nping packet generation and response analysis tool. Nmap runs on Linux, Windows, macOS and other platforms.
Best for: Network discovery, port scanning and security auditing across any size network.
Strengths: Flexible scan techniques, OS and version detection, and an extensible scripting engine.
Things to consider: A steep learning curve and limited native reporting formats.
Key features include:
- Host discovery and port scanning: Identifies available hosts and open ports using multiple TCP and UDP scanning mechanisms, including ping sweeps, to map out which systems are reachable.
- OS and version detection: Determines operating systems and versions and recognizes services through a probe and regular-expression signature system that covers thousands of services.
- Nmap Scripting Engine (NSE): Runs scripts written in Lua to automate tasks such as more advanced version detection, vulnerability detection and backdoor detection, executed in parallel.
- Firewall and filter mapping: Supports techniques for mapping networks filled with IP filters, firewalls and routers, helping trace how traffic is handled.
- Supporting utilities: Bundles Zenmap for a graphical interface, Ncat for data transfer and debugging, Ndiff for comparing scans, and Nping for packet generation and analysis.
Limitations (as reported by users on Capterra):
- Learning curve: Users note that getting started can be challenging for those without a networking background, as the tool requires familiarity with networking concepts.
- Reporting formats: Reviewers report that native reporting is limited, with output generated as XML and a wish for more formats such as a printable network map.
- Interface readability: Some users find the graphical interface difficult to read compared with other free alternatives.
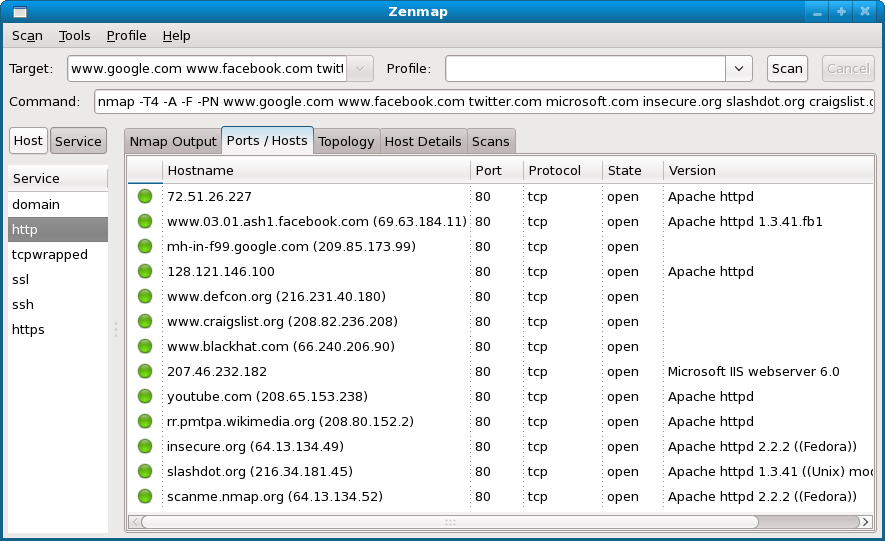
Source: Nmap
3. Netdisco
Netdisco is a web-based network management tool for small to very large networks. It collects IP and MAC address data into a PostgreSQL database using SNMP, CLI, or device APIs. It is written in Perl and Python and includes a lightweight web server for the interface, a backend daemon to gather data, and a command line interface for troubleshooting, with a YAML configuration file.
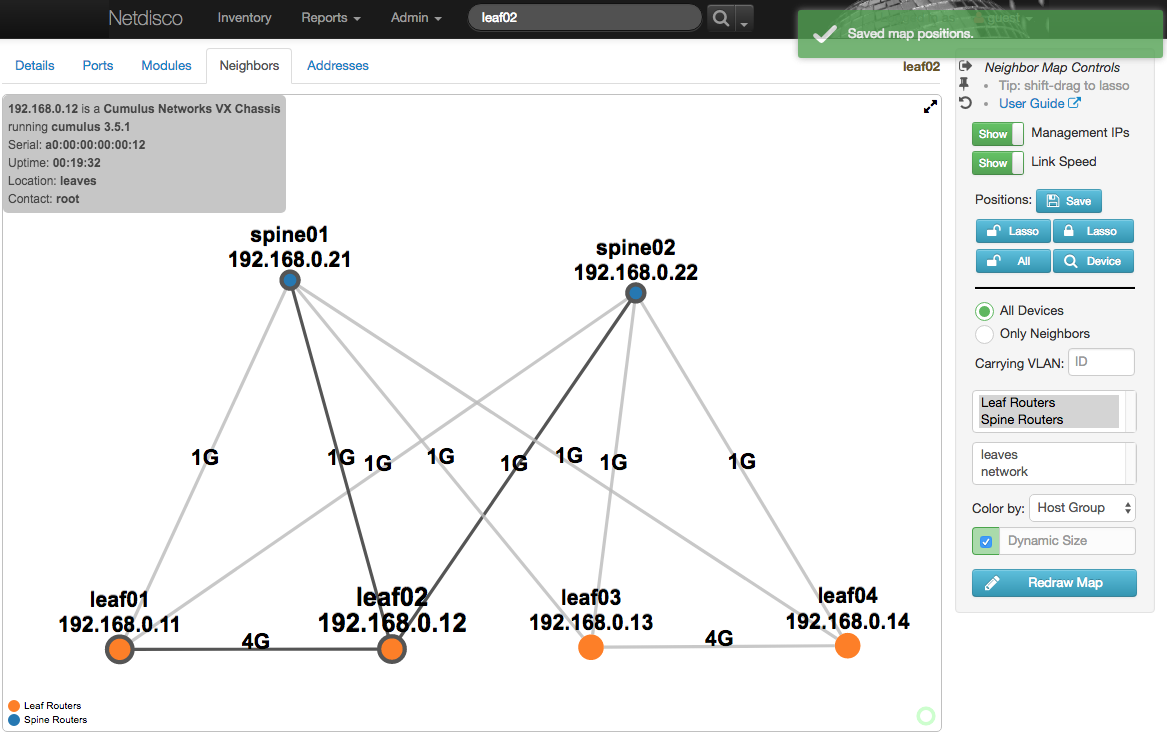
The tool locates machines on the network by MAC or IP and shows the switch port they connect to, inventories hardware by model, vendor and software, and keeps historic records of system IPs and locations. It performs automatic Layer 2 topology discovery and can display network maps, with newer releases rendering the netmap on a canvas for smoother panning.
Best for: Locating devices by IP or MAC and mapping Layer 2 switch topology.
Strengths: SNMP and CLI inventory, switch port mapping, and port control.
Things to consider: Requires a PostgreSQL database and YAML-based configuration.
Key features include:
- Device location by IP or MAC: Finds a machine on the network by MAC, IP or SSID and shows the switch port where it lives.
- Port and VLAN control: Turns off a switch port or changes the VLAN or PoE status of a port directly from the interface.
- Hardware inventory: Inventories network devices by model, vendor, software and operating system, with historic data on system IPs and locations.
- Topology discovery and visualization: Performs automatic L2 topology discovery using SNMP polls, with support for CDP, and displays network maps.
- API access: Allows searching and retrieving collected data via an API for integration with other systems.
Limitations (based on publicly available sources):
- Database dependency: Netdisco relies on a PostgreSQL database, adding a component to install and maintain alongside the application.
- Neighbor data requirements: Topology maps depend on complete neighbor information over SNMP, and incomplete data can result in devices not being drawn with their connections.
- Configuration knowledge: Setup and troubleshooting use a YAML configuration file and command line tools, which assume comfort with those formats.
Key features of Netdisco:
- Device and node discovery: Collects network device information using SNMP, CLI access, or device APIs.
- Network device location: Allows administrators to find devices on the network using IP or MAC addresses and identify the switch port they are connected to.
- Switch port management: Enables actions such as disabling ports or changing VLAN and PoE settings through the web interface.
- Hardware inventory tracking: Maintains records of network equipment including model, vendor, operating system, and software versions.
- Reporting and data access: Provides web-based reports and an API for searching and extracting network records.
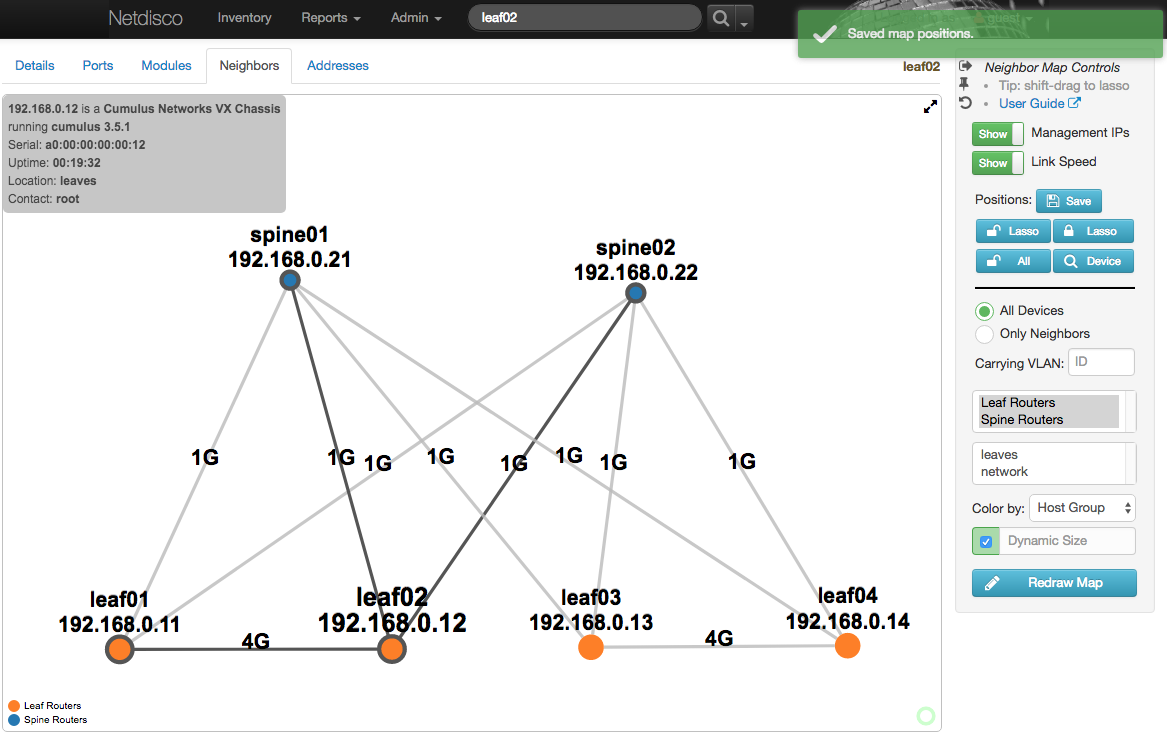
Source: Netdisco
Network Monitoring and Traffic Analysis
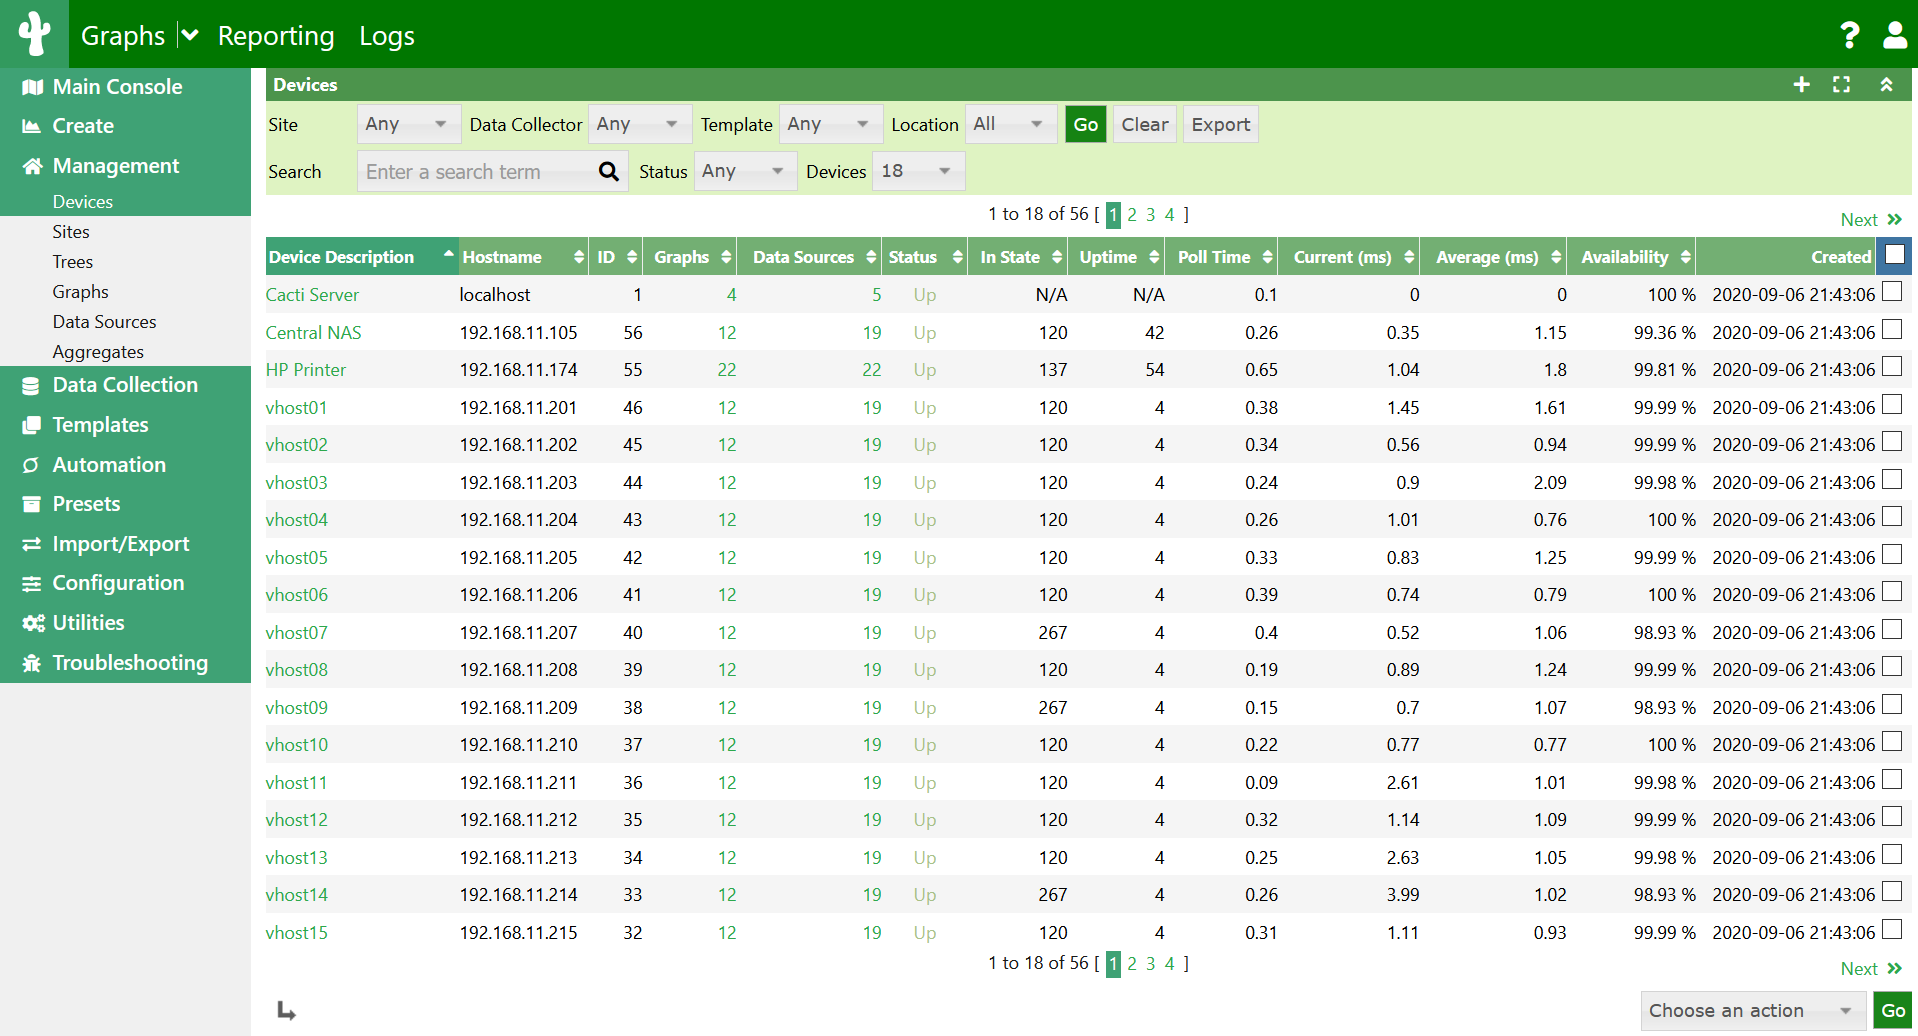
4. Cacti

Cacti is a complete network graphing solution built around RRDTool’s data storage and graphing functionality, providing an operational monitoring and fault management framework. It includes a distributed and fault-tolerant data collection framework, template-based automation for devices, graphs and trees, multiple data acquisition methods, and role-based user, group and domain management, all within a web interface that scales from LAN-sized installations to networks with tens of thousands of devices.
Data is collected via SNMP OIDs or scripts, and collection can be distributed across sites using Remote Data Collectors that cache data during network interruptions. Automation and discovery features scan for SNMP-enabled devices and add them automatically, and the framework can be extended through plugins.
Best for: RRDTool-based performance graphing and polling across many devices.
Strengths: SNMP polling, template-based automation, and distributed data collection.
Things to consider: Updates and plugin configuration can be complex.
Key features include:
- Device and graph templates: Uses device templates that associate graph templates and data queries to device types, reproducing graphs across similar devices to reduce setup.
- Data collection methods: Collects data via SNMP OIDs or scripts, with built-in SNMP support and multi-process, multi-thread polling down to the device level.
- Discovery and automation: Schedules network scans to discover SNMP-enabled devices and add them automatically, with rules to add graphs and build graph trees.
- Distributed collection: Distributes data collection across sites using Remote Data Collectors that support offline caching during network interruptions.
- Plugin framework: Extends functionality through plugins, including threshold-based fault management, syslog handling and device tracking.
Limitations (as reported by users on Capterra):
- Update complexity: Users report that performing updates can be complex and that configuring the plugin architecture is involved.
- Interface navigation: Reviewers note the user interface can be tricky when managing many devices or focusing on past events.
- Maintenance of scripts: Some users mention that scripts and plugins can become obsolete over time, requiring manual effort to keep them working.
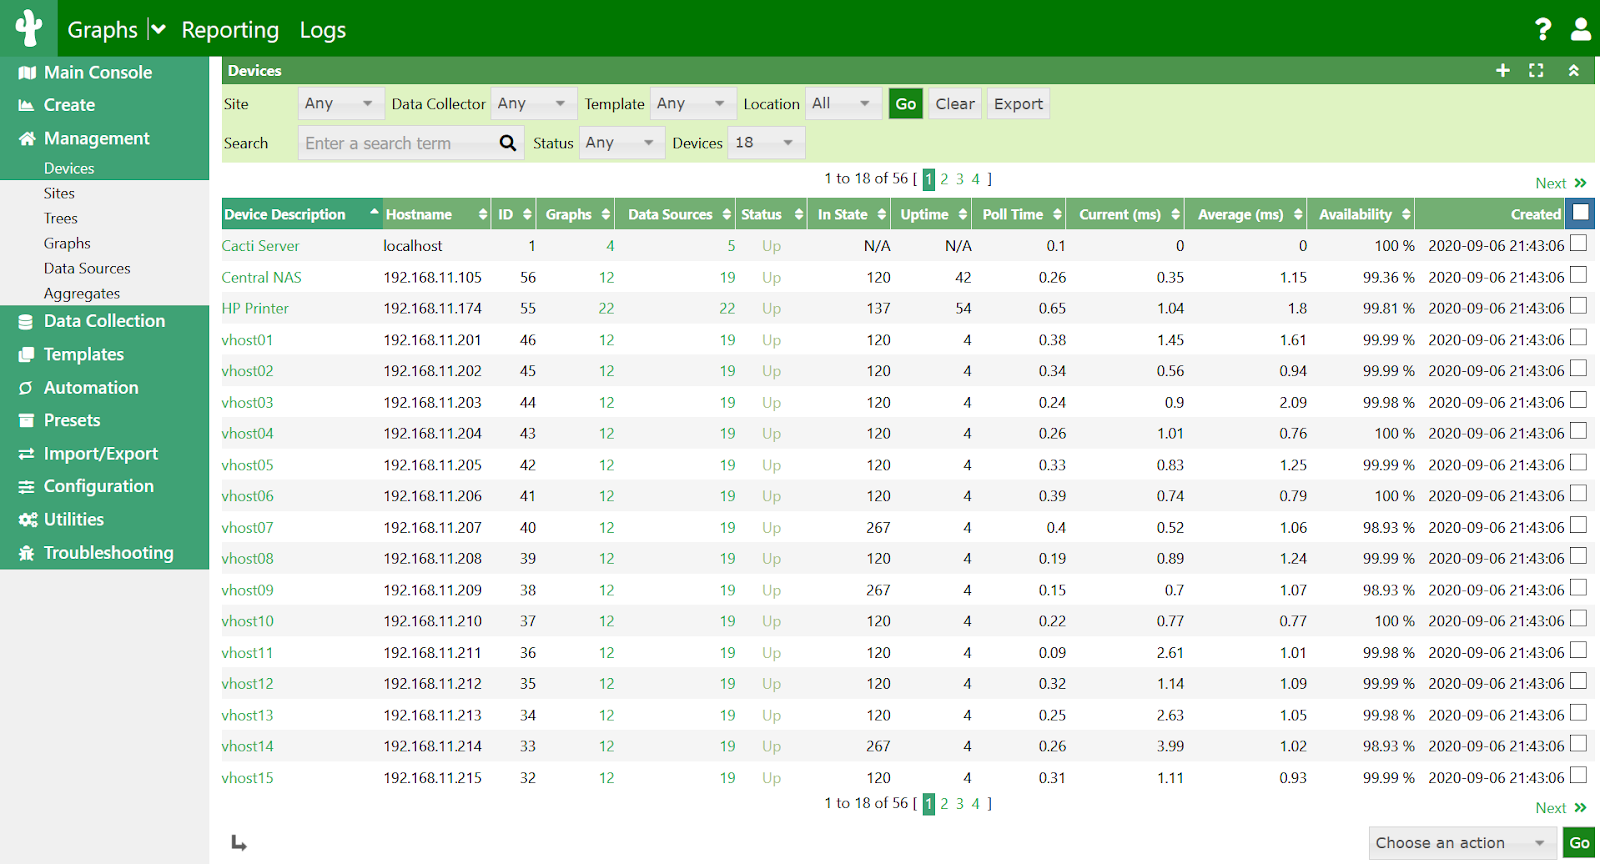
Source: Cacti
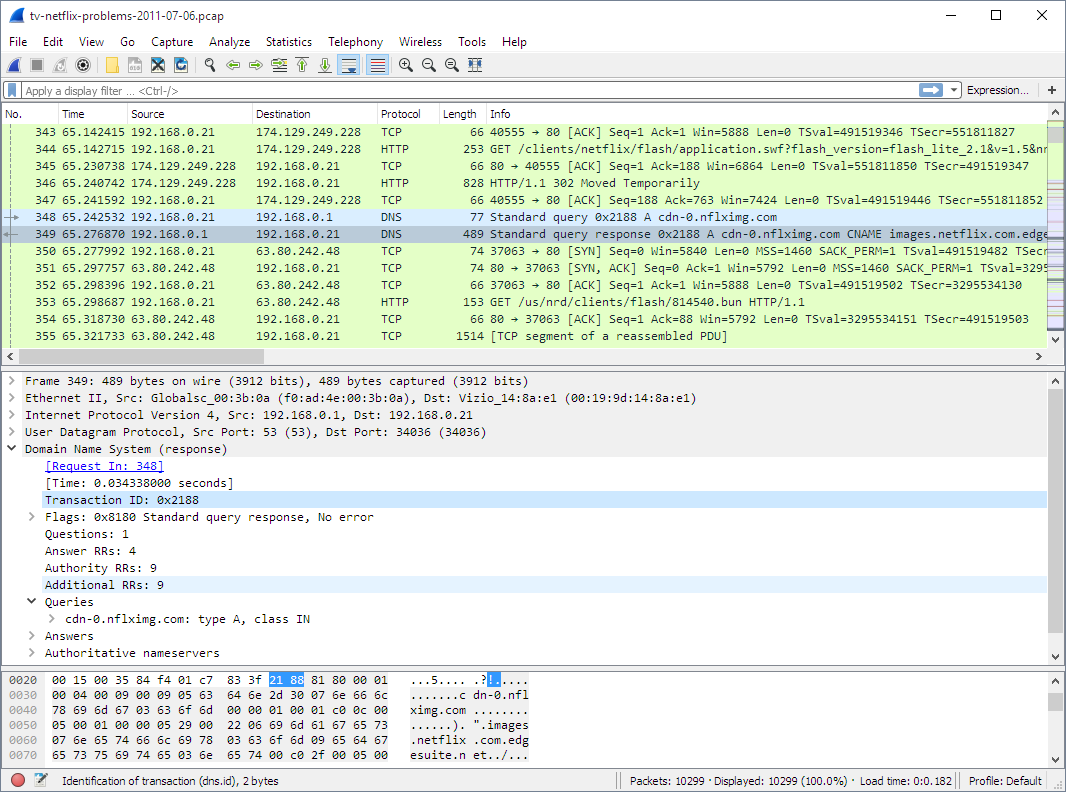
5. Wireshark

Wireshark is an open source network protocol analyzer that captures and interactively browses the traffic running on a computer network, providing deep inspection of hundreds of protocols. It runs on Windows, macOS, Linux and UNIX systems and supports both live capture and offline analysis of saved capture files.
The tool includes advanced display filters to focus on specific traffic patterns, support for numerous capture file formats such as tcpdump (libpcap) and Pcap NG, decryption support for many protocols, and customizable coloring rules for the packet list. It is distributed under the GNU GPL and is maintained by the Wireshark Foundation.
Best for: Deep packet inspection and protocol-level troubleshooting.
Strengths: Broad protocol support, live and offline capture, and powerful display filters.
Things to consider: A steep learning curve and slowdowns on very large captures.
Key features include:
- Protocol inspection: Provides deep inspection of hundreds of protocols, decoding traffic such as DNS, HTTP, HTTPS, TCP and UDP into a readable packet breakdown.
- Live and offline analysis: Captures live network data or loads previously saved capture files for retrospective investigation.
- Display filters: Offers display filters, Follow TCP Stream, conversation analysis and protocol hierarchy to isolate specific traffic within large captures.
- Capture file support: Reads and writes numerous capture file formats, including tcpdump (libpcap) and Pcap NG, for sharing data between tools.
- Decryption and coloring: Supports decryption for protocols including IPsec, Kerberos, SSL/TLS, WEP and WPA/WPA2, with customizable coloring rules for quick analysis.
Limitations (as reported by users on G2):
- Learning curve: Users find the volume of information displayed overwhelming for newcomers, requiring networking knowledge to interpret packet data.
- Interface and visualization: Reviewers describe the interface as dated and note that reports cannot be exported in graphical formats, only XML or raw text.
- Performance on large captures: Some users report lag or unresponsiveness when working with very large, multi-gigabyte capture files.
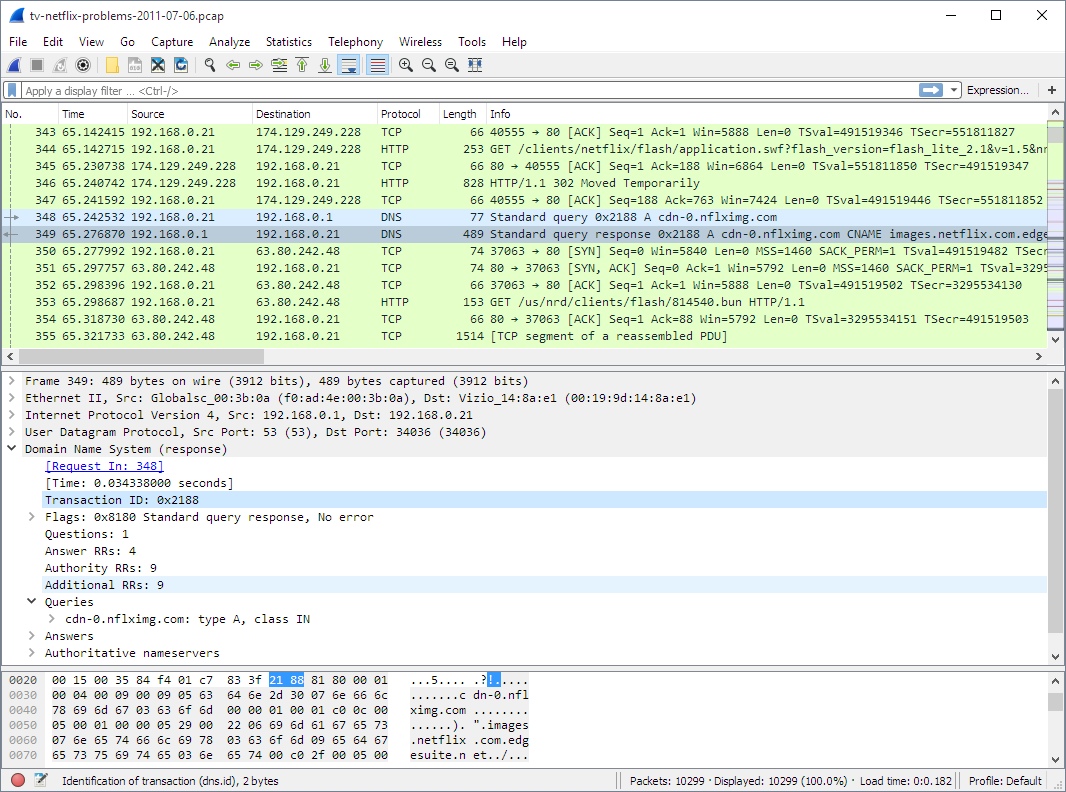
Source: Wireshark
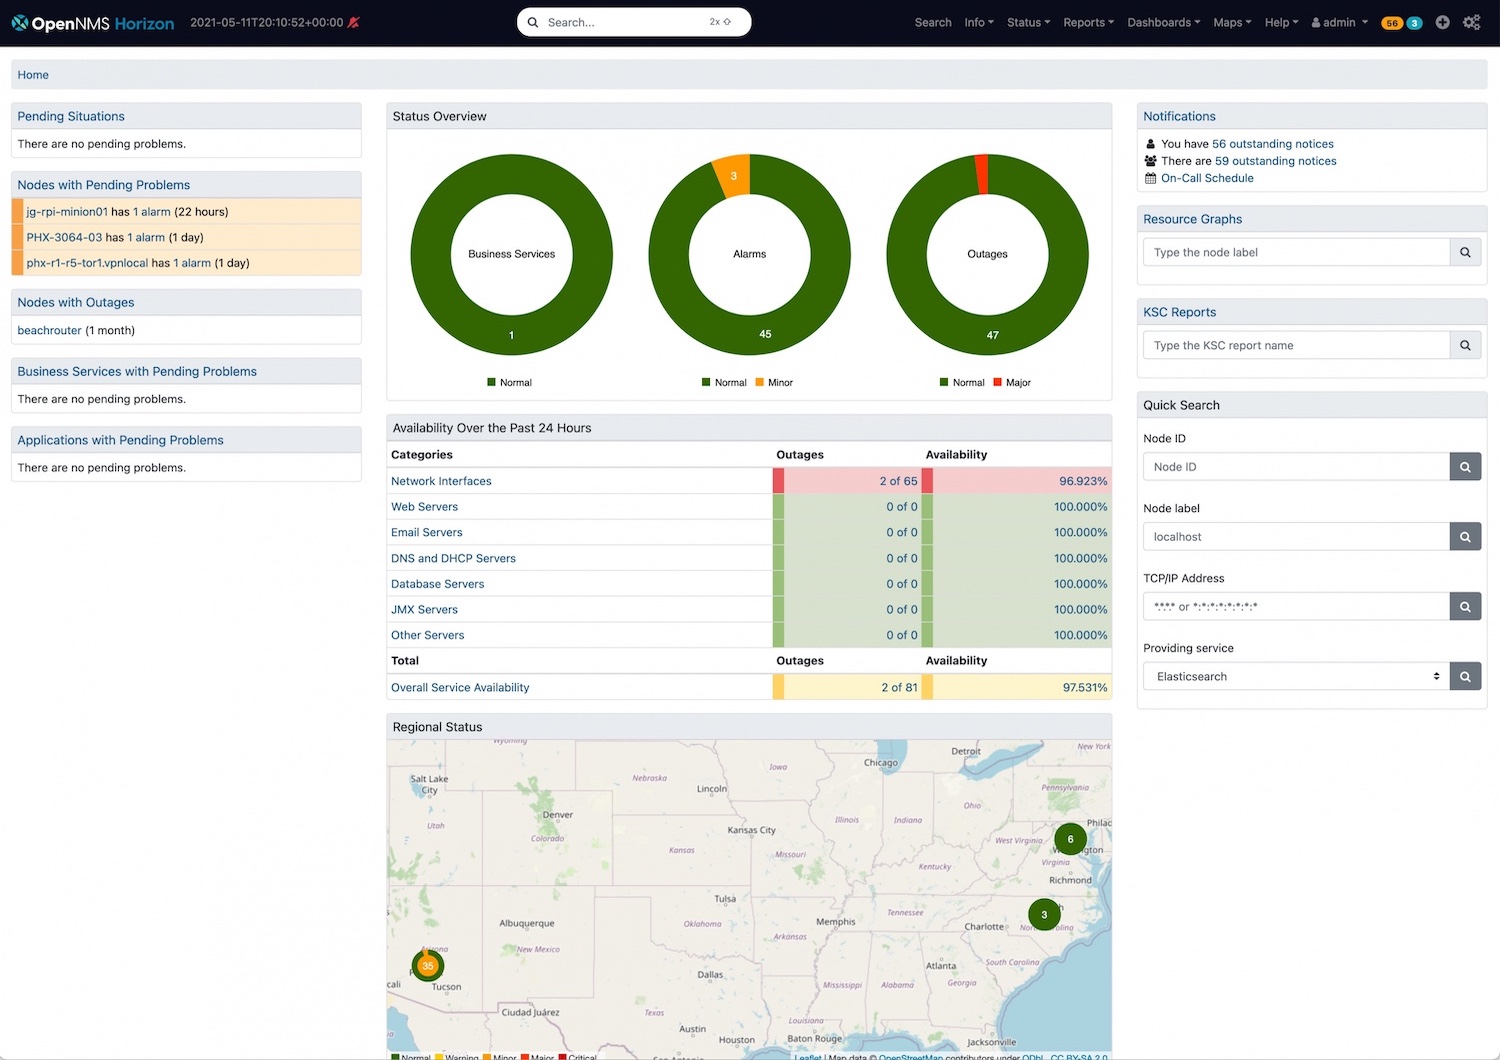
6. OpenNMS Horizon

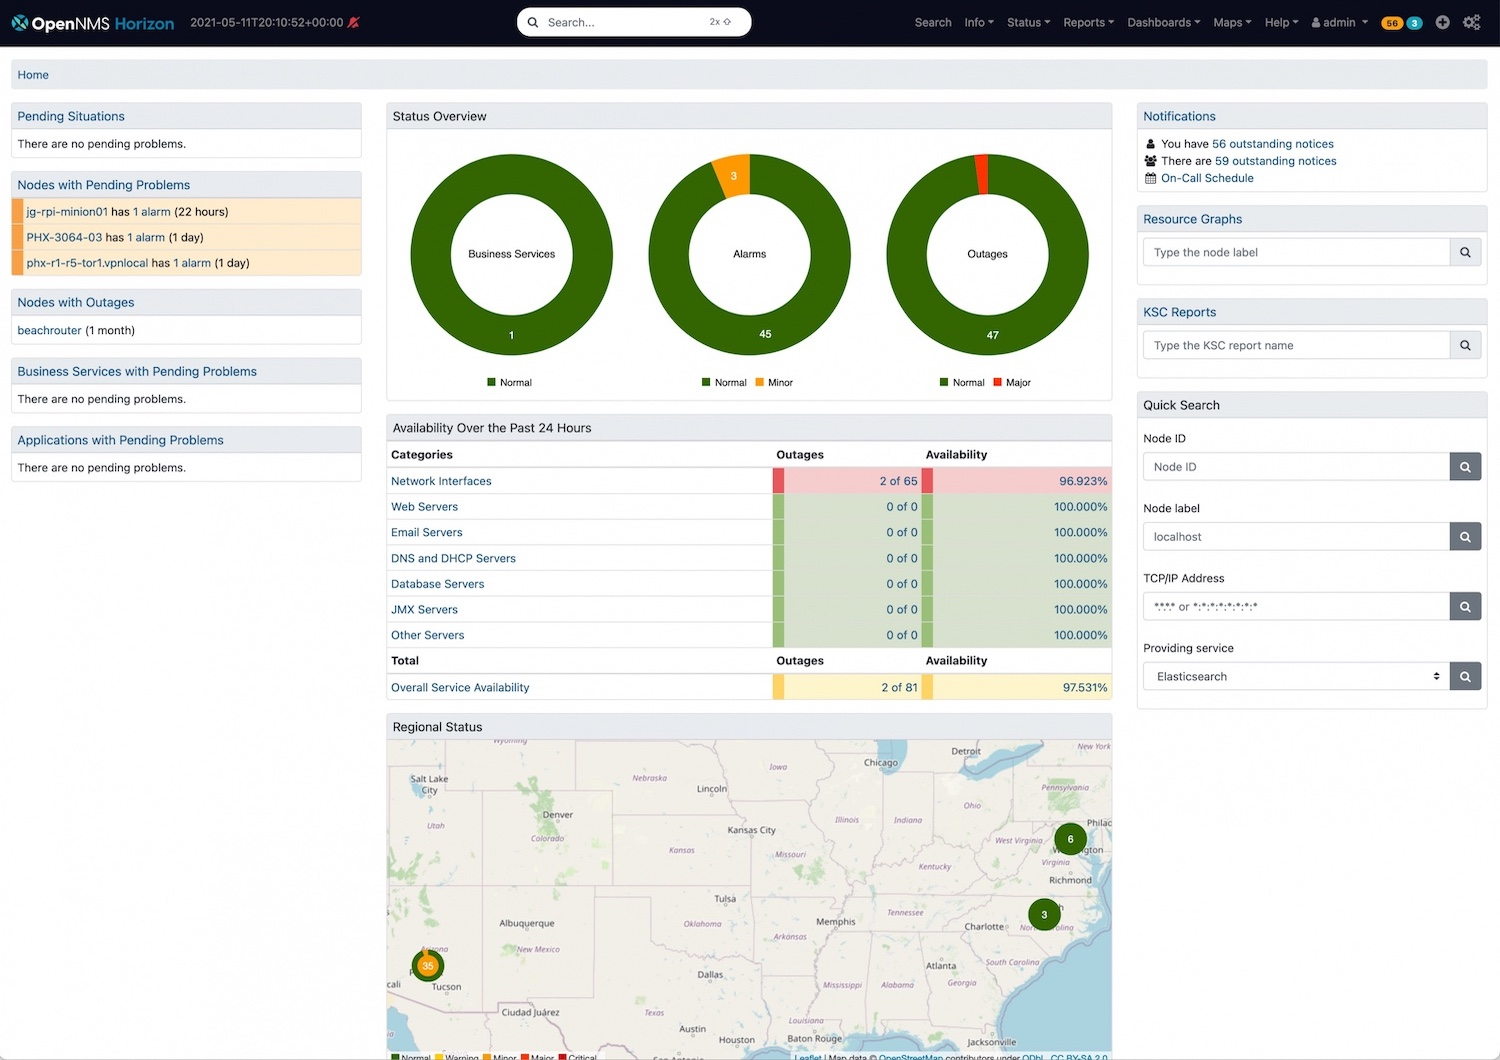
OpenNMS Horizon is a free, community-driven open source distribution that helps visualize and monitor devices across local and remote networks. It offers fault, performance and traffic monitoring and alarm generation in one place, and is highly customizable and scalable, integrating with core business applications and workflows.
Horizon works with many industry-standard data collection protocols including SNMP, JSON, WMI equivalents, HTTP and JDBC, and supports flow protocols such as NetFlow, IPFIX and sFlow for traffic management. It provides inventory management, remote data collection, alarm correlation, business service monitoring, and the ability to define layered topologies and integrate topology maps into service problem management workflows.
Best for: Fault, performance and flow monitoring on local and distributed networks.
Strengths: Broad data collection, flow processing, and topology mapping at scale.
Things to consider: Much configuration is done through XML files.
Key features include:
- Comprehensive monitoring: Provides fault, performance and traffic monitoring with alarm generation in a single platform.
- Extensive data collection: Works with many industry-standard collection protocols, including SNMP, JSON, HTTP and JDBC, without requiring third-party plugins.
- Flow and traffic management: Supports NetFlow, IPFIX and sFlow for flow collection, with deep-dive analysis and enterprise reporting.
- Topology and visualization: Defines layered topologies and integrates topology maps into service problem management, with customizable dashboards exportable as PDF.
- Scalability and remote monitoring: Monitors large numbers of devices across distributed and tiered systems, with remote monitoring through its Minion component.
Limitations (as reported by users on Capterra):
- File-based configuration: Users report that many features are configured by editing XML files rather than through the web interface.
- Learning curve: Reviewers note there is a learning curve and that more configuration parameters would be welcome in the web UI.
- Upgrades and scaling: Some users mention that upgrades require hand configuration of files and that horizontal scaling and multi-tenancy could be stronger.
Source: OpenNMS
Security, Recon and Diagramming Tools
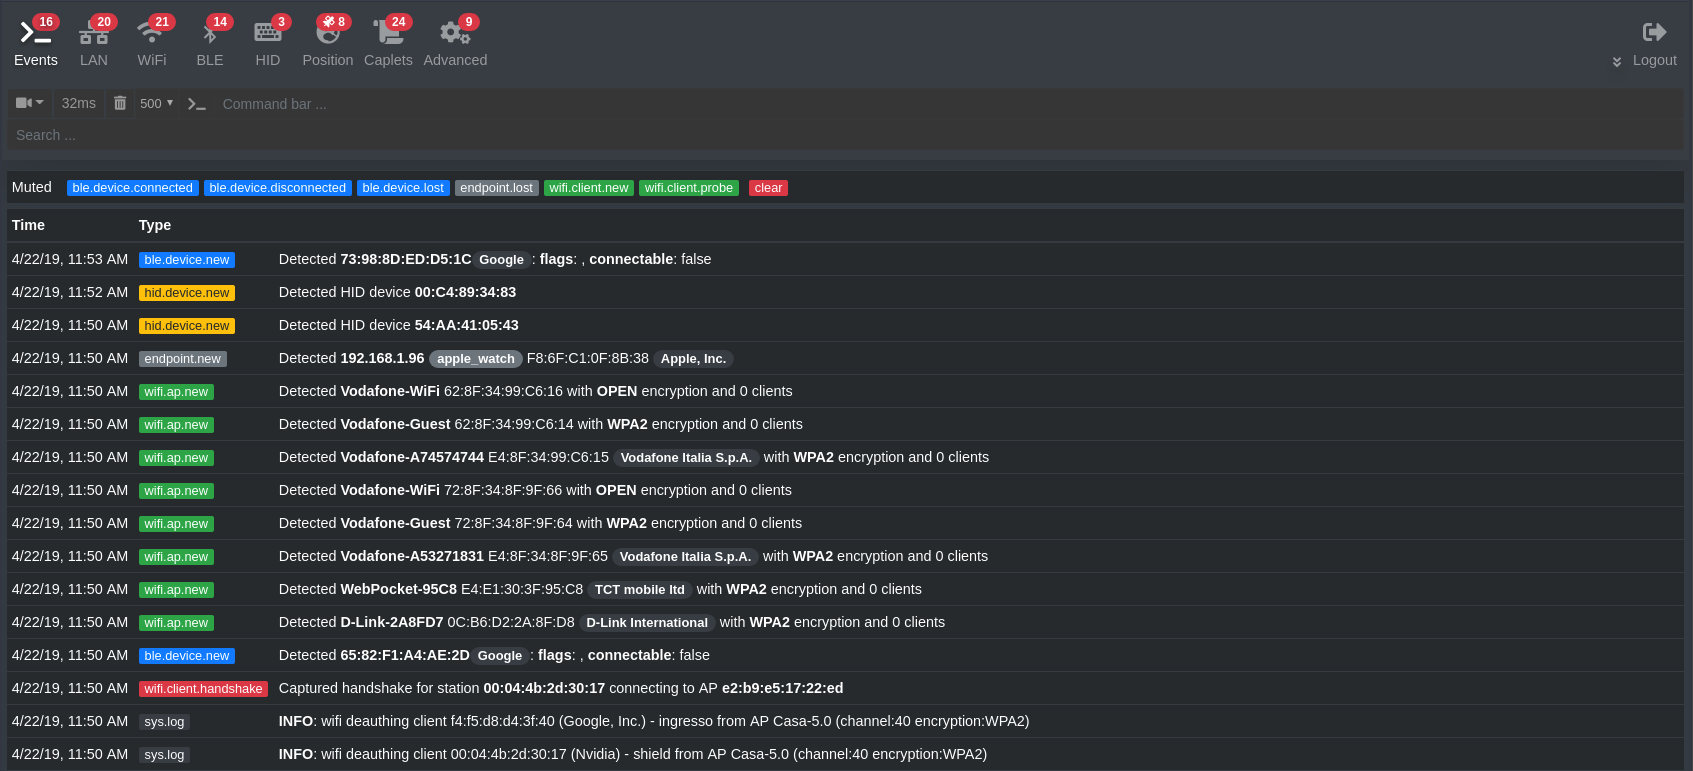
7. Bettercap

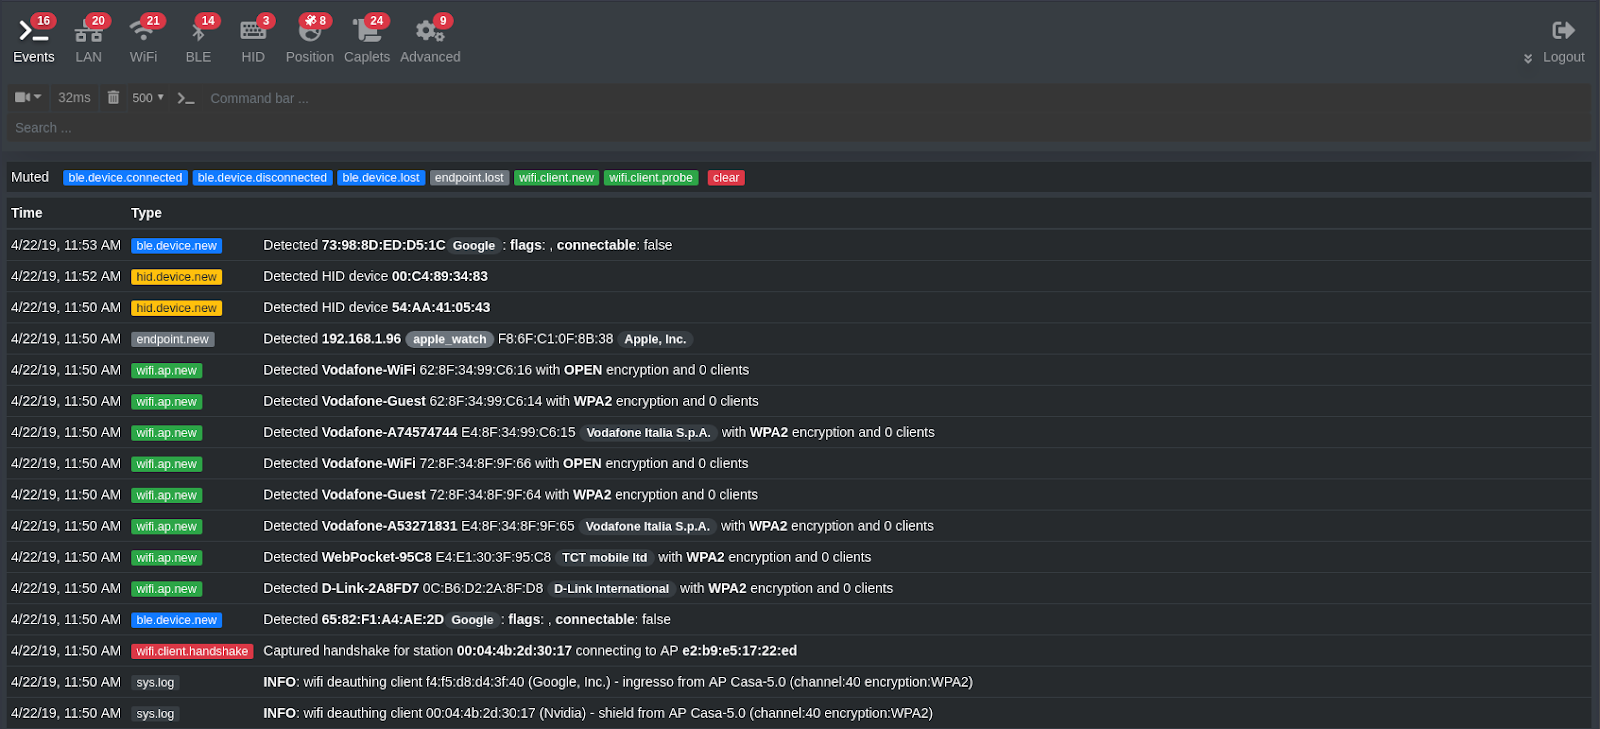
Bettercap is an extensible framework written in Go that offers an all-in-one solution for reconnaissance and attacks against WiFi networks, Bluetooth Low Energy devices, wireless HID devices, CAN-bus, and IPv4 and IPv6 networks. It runs on Linux, macOS, Windows, Android and Docker, and is distributed as a single binary with minimal dependencies.
The framework performs passive and active IP network host probing and reconnaissance, and includes ARP, DNS, DHCPv6 and NDP spoofers for MITM testing on IPv4 and IPv6 networks. It provides a network sniffer, a fast port scanner, scriptable proxies at packet, TCP and HTTP/HTTPS levels, a REST API with websocket event notifications, and a web user interface.
Best for: Network reconnaissance and man-in-the-middle testing across multiple protocols.
Strengths: WiFi, BLE, HID and IP recon, spoofers, and a scriptable REST API.
Things to consider: A steep learning curve, and it should only be used on authorized networks.
Key features include:
- Network reconnaissance: Performs passive and active probing and recon of IPv4 and IPv6 hosts to map out devices on a network.
- WiFi and wireless recon: Scans WiFi networks and captures WPA/WPA2 handshakes, scans Bluetooth Low Energy devices, and handles 2.4GHz wireless HID devices.
- MITM spoofers: Includes ARP, DNS, DHCPv6 and NDP spoofers for man-in-the-middle testing on IPv4 and IPv6 networks.
- Sniffer and port scanner: Provides a network sniffer that can also act as a protocol fuzzer, plus a fast port scanner.
- Scripting and API: Offers scriptable proxies at packet, TCP and HTTP/HTTPS levels, a REST API with websocket events, and a web interface.
Limitations (based on publicly available sources):
- Learning curve: The breadth of modules and command structure makes the framework challenging for those new to network security.
- Authorized use only: Its spoofing and MITM capabilities are intended for networks the user has permission to test, which constrains where it can be used.
- Legacy version changes: Versions prior to 2.x are deprecated, so older setups and documentation require migration to the current Go implementation.
Source: Bettercap
8. Lucidchart

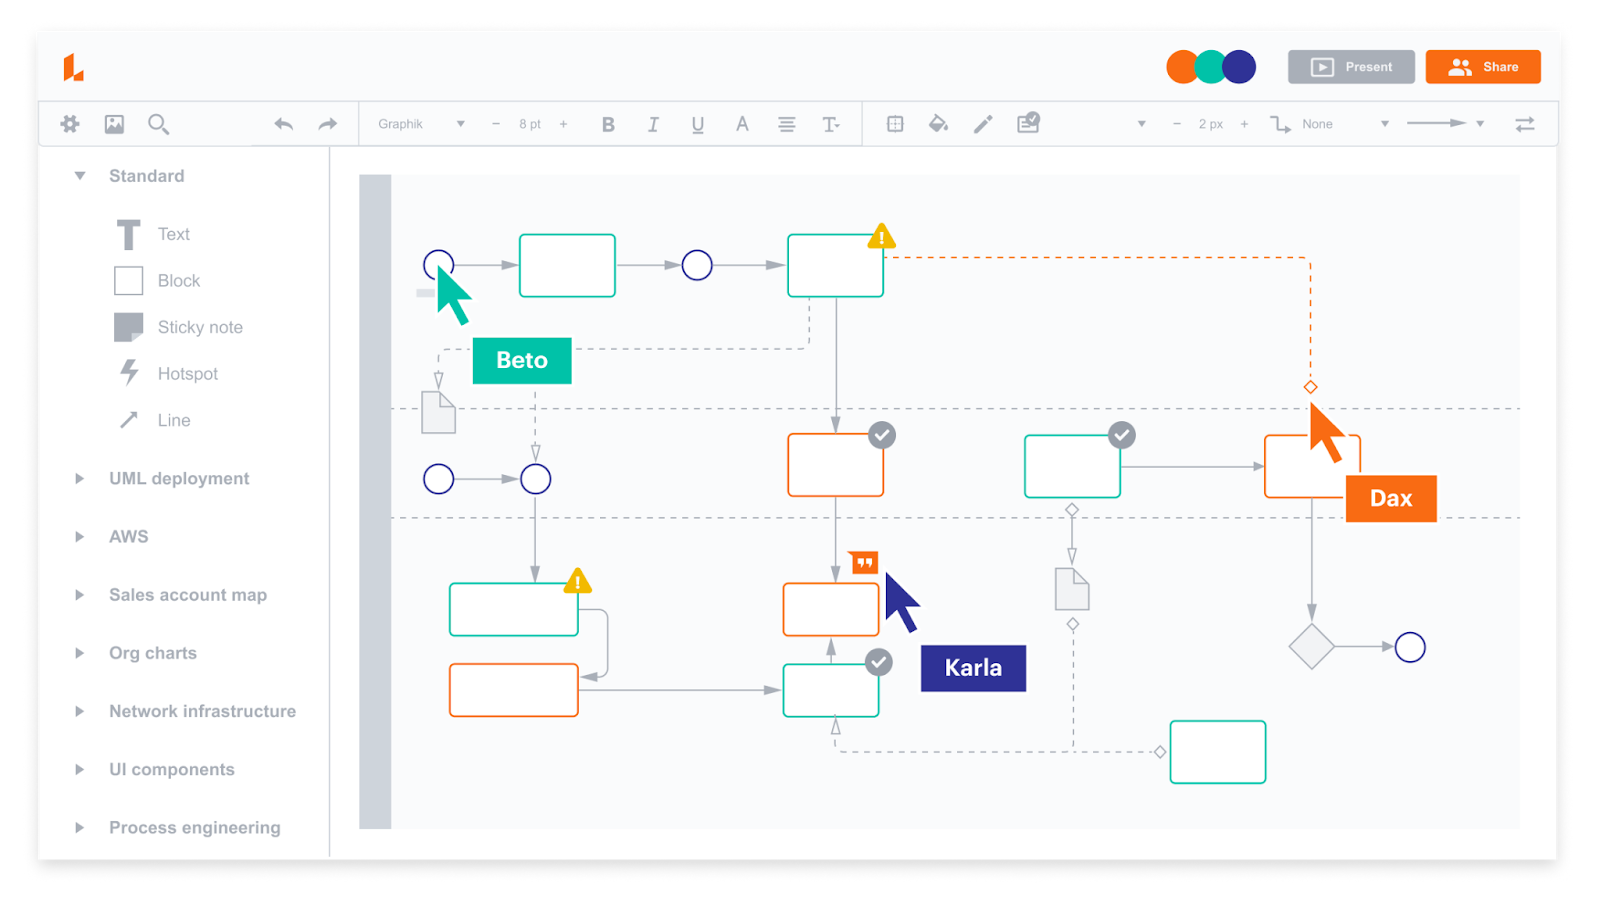
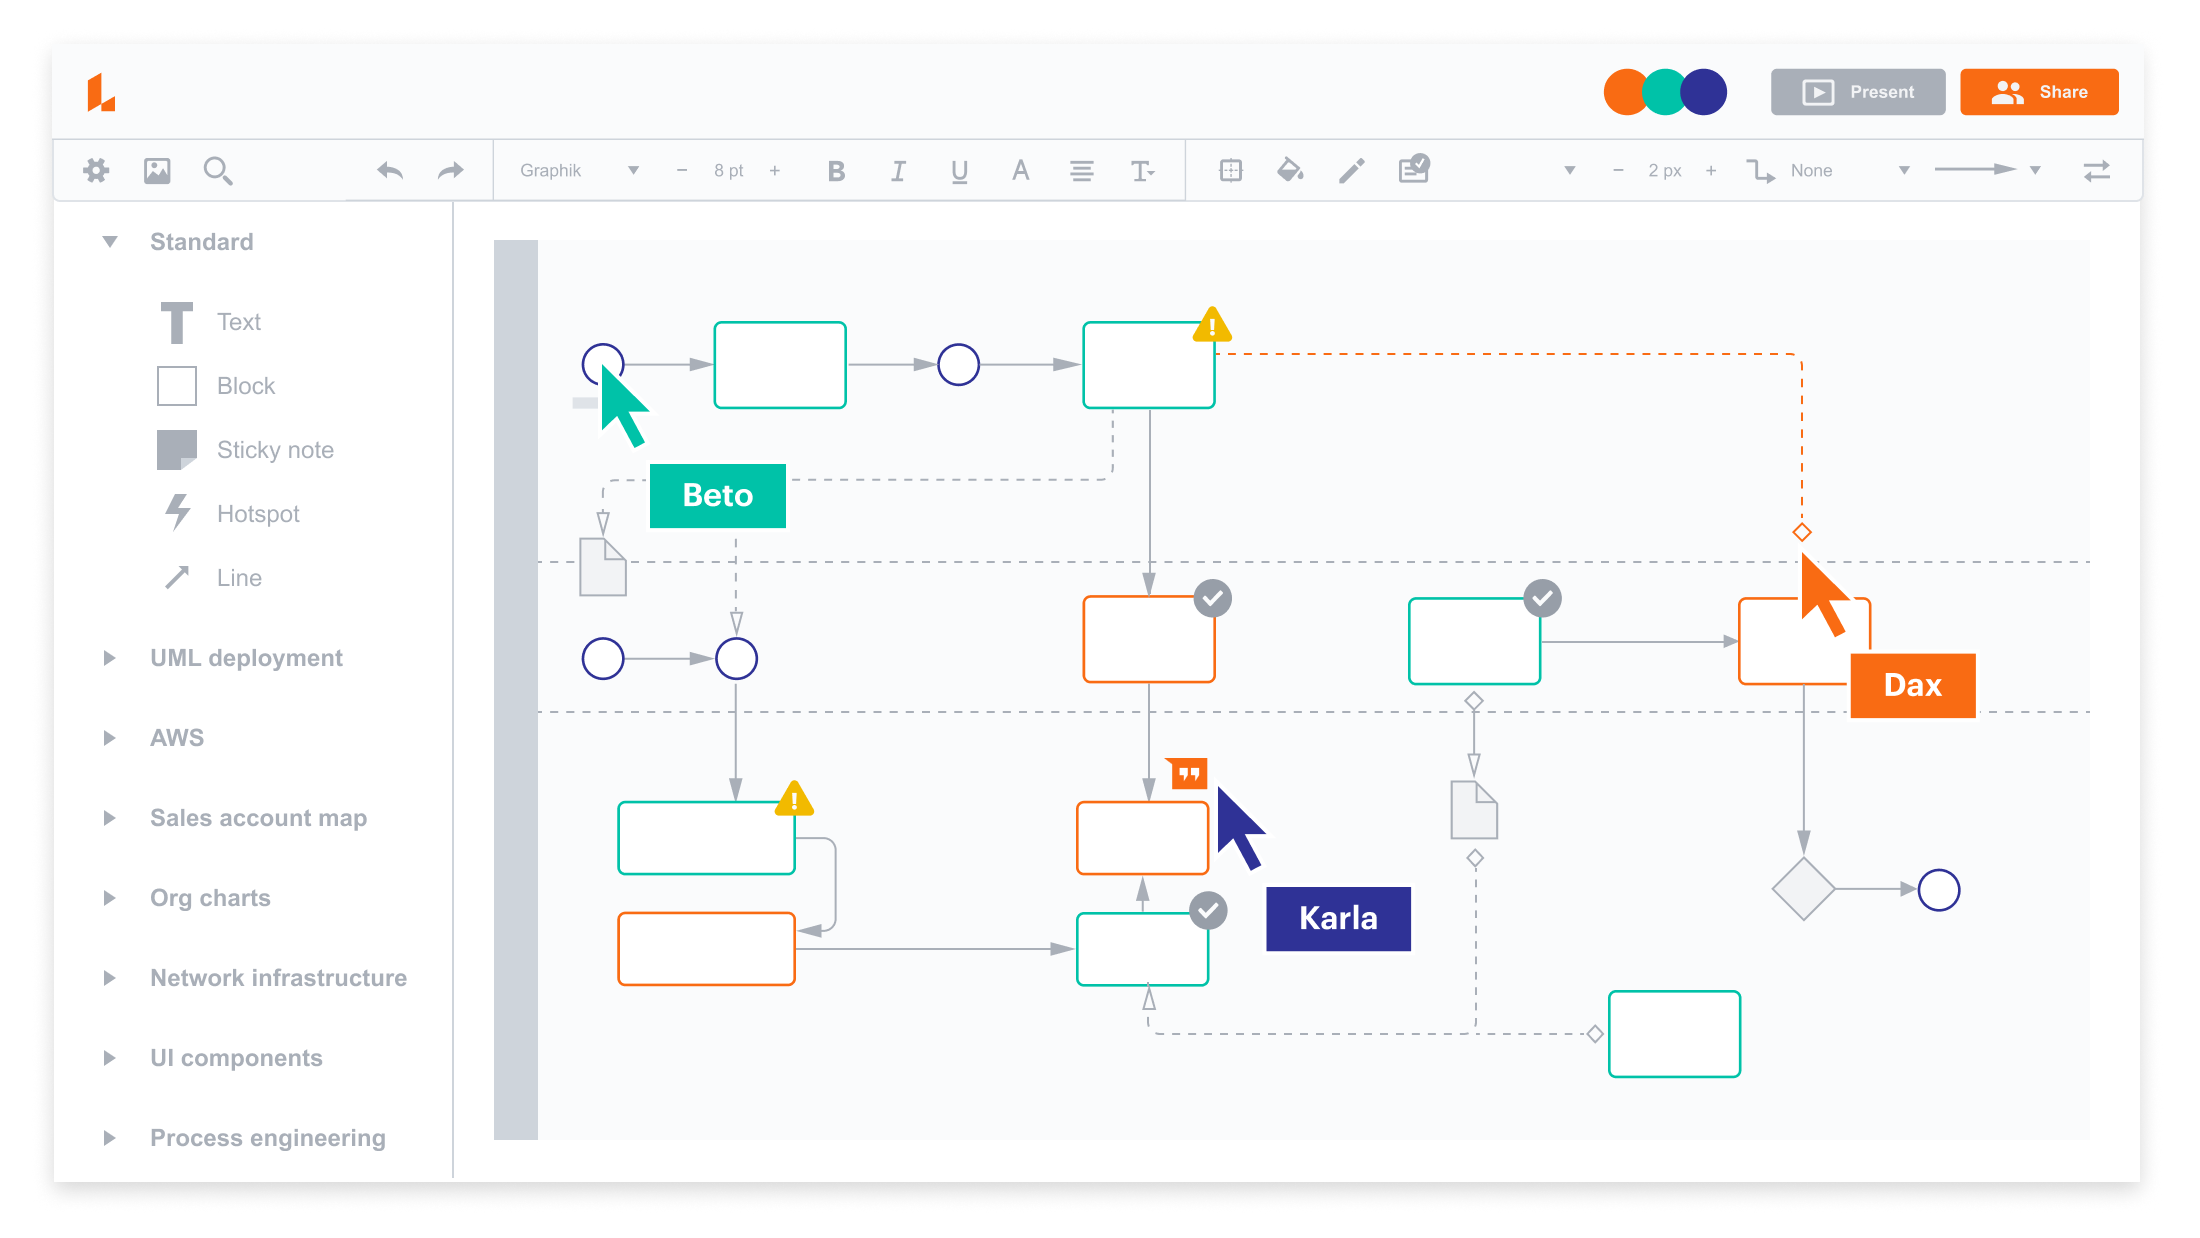
Lucidchart is a diagramming application for creating network diagrams, with drag-and-drop functionality and an extensive library of shapes including AWS and Cisco. It works across devices in the browser and supports real-time collaboration, so multiple people can work on the same diagram and comment within the editor.
For network documentation, it provides templates and shape libraries to map out AWS, Cisco or generic networks, along with Visio import and export, publishing and sharing options, and integration with tools such as Google Workspace, Microsoft Office, Jira and Confluence. A free plan is available, with paid tiers removing limits and adding features.
Best for: Collaborative, manually created network diagrams and documentation.
Strengths: Templates, extensive shape libraries, and real-time collaboration.
Things to consider: The free plan caps documents and objects, with full features behind paid tiers.
Key features include:
- Network shape libraries: Provides hundreds of network diagram shapes, including AWS and Cisco libraries, for building network topology diagrams.
- Templates: Offers a template gallery for network diagrams so users can start from a pre-built layout rather than a blank canvas.
- Real-time collaboration: Allows multiple users to work on a diagram simultaneously with commenting, sharing and version history.
- Visio import and export: Imports and exports Visio files, and publishes diagrams as embedded pages, PDFs or shared links.
- Integrations: Connects with tools such as Google Workspace, Microsoft Office, Jira and Confluence, and can generate diagrams from text prompts.
Limitations (as reported by users on Capterra):
- Free plan limits: Users note the free tier is limited, with caps on editable documents and objects per document that prompt upgrading for fuller use.
- Cost of paid tiers: Reviewers describe the paid plans as relatively expensive compared with free alternatives.
- Performance and export: Some users report lag on large, complex diagrams and difficulty exporting diagrams cleanly for use in other tools.
Source: Lucidchart
9. Aircrack-ng
Aircrack-ng is a complete suite of command-line tools to assess WiFi network security. It focuses on monitoring through packet capture and export, attacking through replay attacks, deauthentication and packet injection, testing WiFi card and driver capabilities, and cracking WEP and WPA PSK keys. All tools are command-line, which allows for heavy scripting, and it works primarily on Linux but also on Windows, macOS and other systems.
The suite consists of multiple utilities including airodump-ng for capture, aireplay-ng for injection and attacks, and the core aircrack-ng cracking module, with support for WPA3 and OWE detection in airodump-ng and PMKID cracking.
Best for: Assessing WiFi network security through capture, injection and key cracking.
Strengths: Packet capture and export, injection attacks, and scriptable command-line tools.
Things to consider: Requires a compatible wireless adapter and is command-line only.
Key features include:
- Monitoring and capture: Captures packets and exports data to text files for further processing, with WPA3 and OWE network detection in airodump-ng.
- Attacking: Performs replay attacks, deauthentication, fake access points and other actions through packet injection.
- Testing: Checks whether WiFi cards and drivers support capture and injection before an assessment.
- Cracking: Recovers WEP and WPA PSK (WPA1 and 2) keys, including PMKID cracking from captured handshakes.
- Scriptable tools: Provides all functionality through command-line utilities that can be combined and automated through scripting.
Limitations (based on publicly available sources):
- Adapter dependency: Not all wireless adapters support the monitor mode and packet injection needed for full functionality, which can require specific hardware.
- Command-line interface: The suite is entirely command-line, so visual, GUI-driven workflows depend on third-party front ends.
- Capture setup issues: Users commonly encounter channel and monitor-mode problems that require killing conflicting network managers before capturing.
Source: Aircrack-ng

10. draw.io
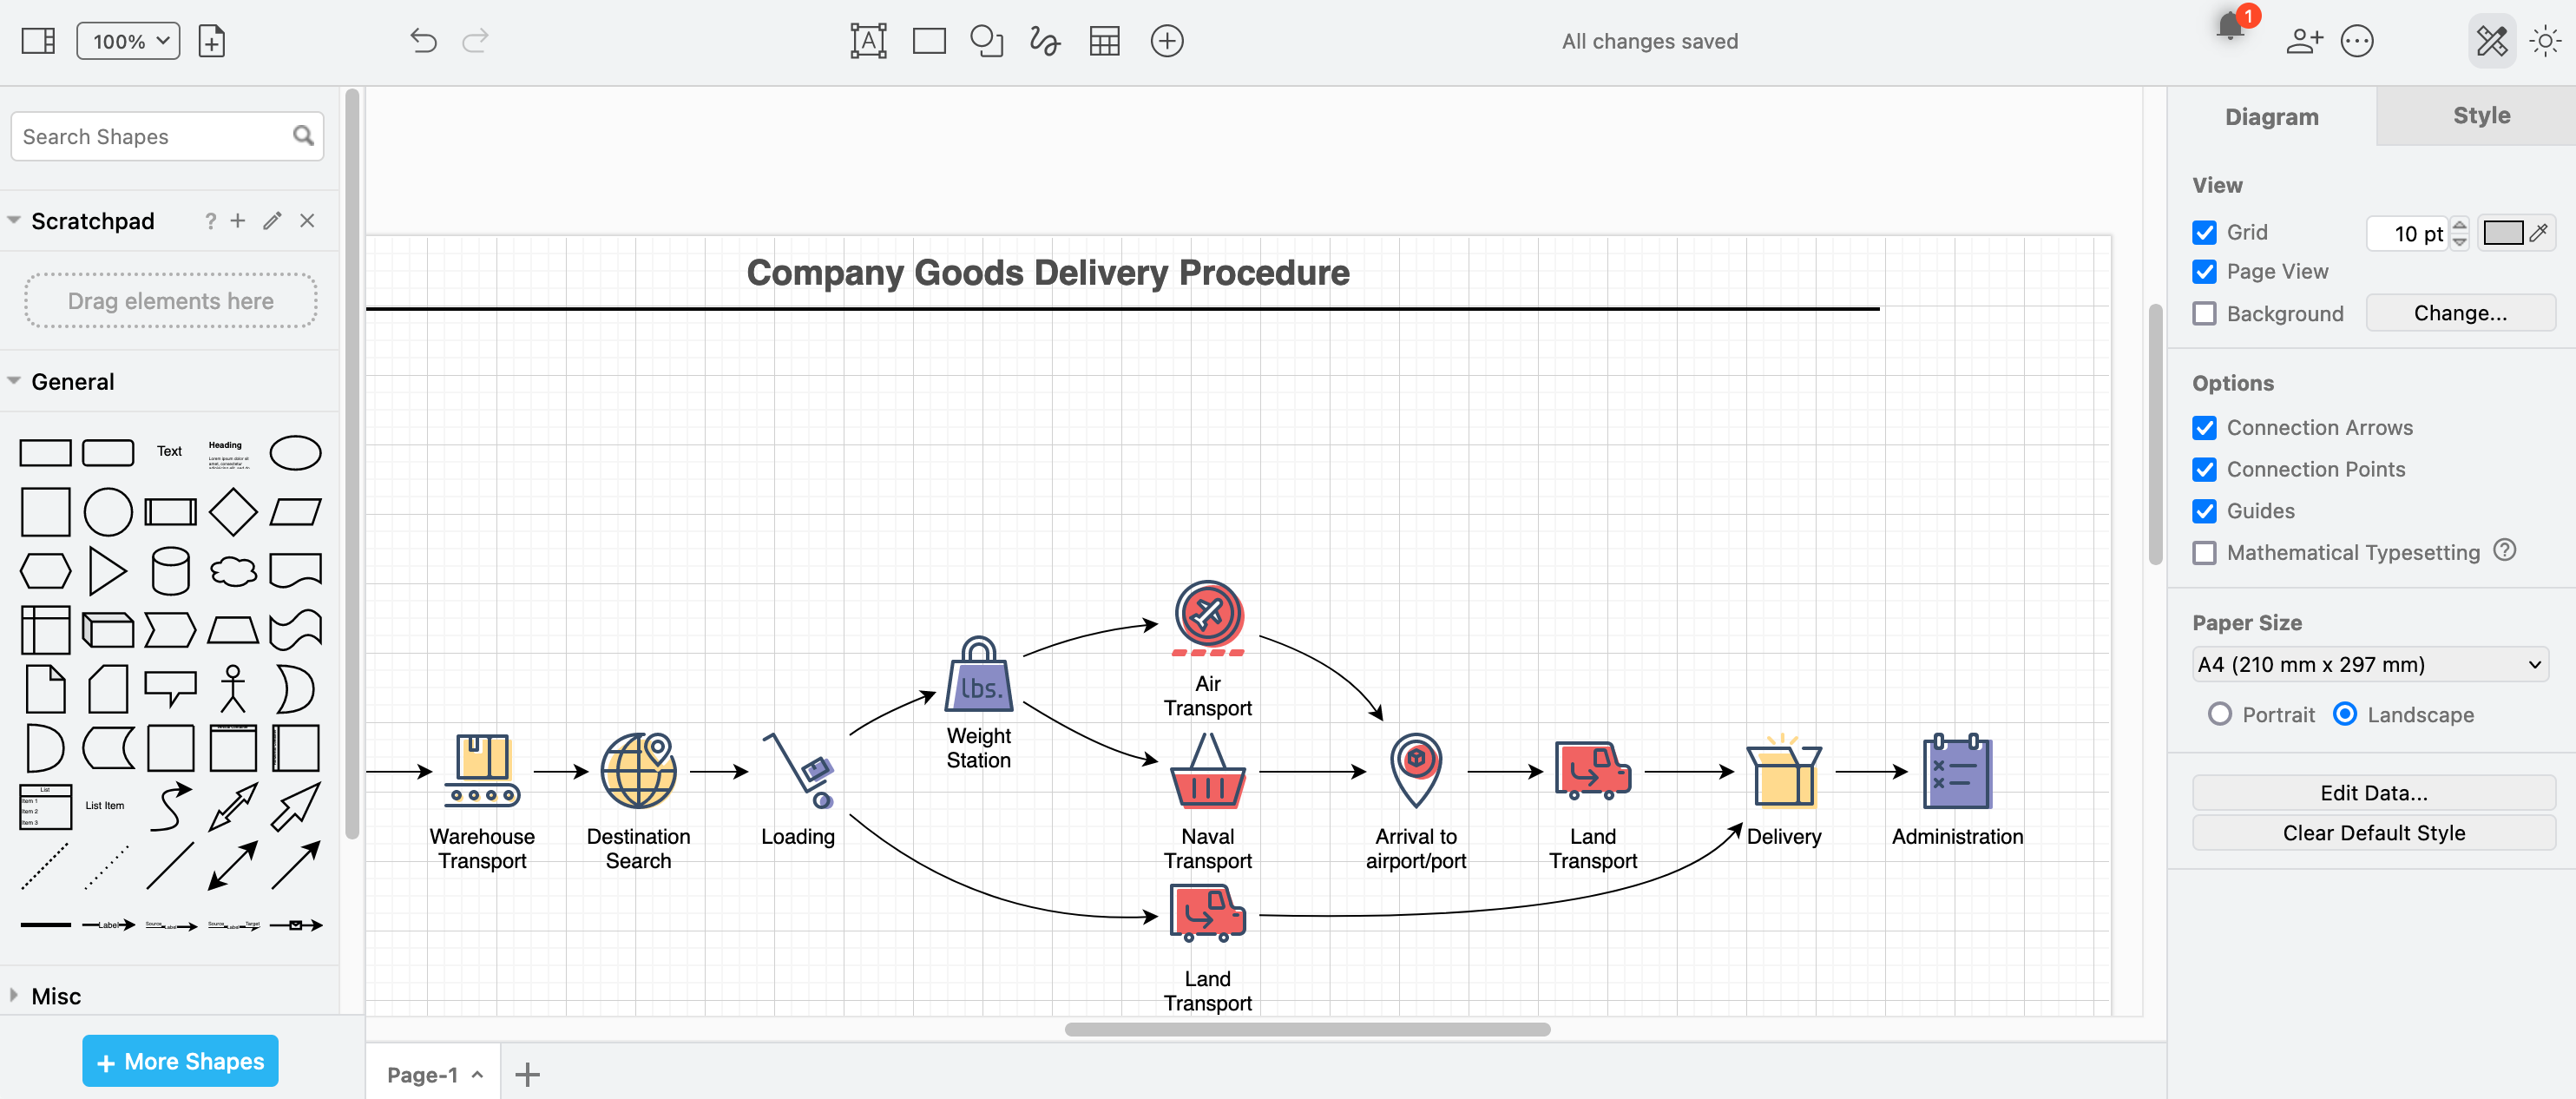
draw.io is a diagramming tool for creating network diagrams, available as an online tool and a desktop app. Users bring their own storage or save locally, and the tool emphasizes that diagram data stays with the user. It is free, requires no sign-up, and its source code is licensed under Apache 2.0.
For network diagramming, it provides a large shape library, real-time collaboration with shared cursors, and backwards compatibility so older diagram files still open. It integrates with storage and documentation tools such as Google Drive, OneDrive, SharePoint, Confluence, Jira, GitHub and VS Code, and can export to SVG, PNG and PDF or keep diagrams editable.
Best for: Free, manually created network diagrams with flexible storage.
Strengths: No cost, private storage, a large shape library, and broad integrations.
Things to consider: No live discovery, and the interface feels dated to some users.
Key features include:
- Shape library: Provides a large library of shapes and symbols for building network layouts, flowcharts and process maps.
- Flexible storage: Lets users store diagrams in their own storage or save locally, keeping diagram data under the user’s control.
- Collaboration: Supports real-time collaboration with shared cursors for teams working on the same diagram.
- Integrations: Connects with Google Drive, OneDrive, SharePoint, Confluence, Jira, GitHub, Notion and VS Code for embedding and storing diagrams.
- Export options: Exports diagrams to SVG, PNG and PDF, or embeds editable interactive diagrams in documents and wikis.
Limitations (as reported by users on Capterra):
- Dated interface: Users describe the interface as feeling dated and occasionally crowded when many panels are open.
- Performance on large diagrams: Reviewers report lag or slowdowns when working with large diagrams, and occasional browser crashes.
- Collaboration and export: Some users note that simultaneous group work is less smooth than in competing tools and that exporting to certain formats can require manual spacing fixes.
Source: draw.io
Considerations for Choosing Free Network Mapping Solutions
When selecting a free network mapping tool, evaluate how well the tool aligns with operational needs and network complexity. Consider the following points:
- Network size and complexity: Ensure the tool can scale to accommodate the network size.
- Mapping depth and automation: Some tools provide only static or manually generated maps, while others offer real-time, automated discovery and updates. Choose based on how frequently the network changes.
- Protocol and device support: Confirm the tool supports the devices and protocols used in the environment (e.g., SNMP, LLDP, CDP, IPv6).
- Visualization features: Look for features like interactive maps, zoom levels, and topology layers that help teams understand and troubleshoot the network.
- Data export and reporting: Check whether the tool allows exporting maps or generating reports for documentation and compliance.
- Integration and extensibility: Some tools support plugins or integrate with monitoring systems (like Zabbix, Nagios, or Prometheus), improving their utility.
- Resource usage: Consider how much CPU, memory, or bandwidth the tool consumes, especially when running on resource-constrained systems.
- User interface and usability: Tools with modern, intuitive interfaces can significantly reduce training time and increase operational efficiency.
- Community and documentation: Active community support and comprehensive documentation can ease setup and troubleshooting for open-source tools.
- Security features: For sensitive environments, ensure the tool supports secure communication, access controls, and audit logging.
Conclusion
Free network mapping platforms provide a valuable starting point for organizations looking to gain visibility into their IT environments without the expense of commercial software. These tools can assist with a range of tasks, from basic topology visualization to advanced traffic analysis and device management. The choice of the right platform depends on the organization’s specific technical needs, scalability requirements, and desired level of automation.
For smaller teams and resource-limited environments, the challenge often lies in finding a solution that is both easy to deploy and comprehensive enough to address real operational needs. This is where a platform like Faddom becomes essential. By offering core features such as discovery and application dependency mapping at no cost for up to 50 servers, it provides IT teams in startups, nonprofits, and educational institutions access to the kind of visibility that is typically available only to large enterprises.