What Is IBM Turbonomic?
IBM Turbonomic is an IT automation platform that improves performance and cost-efficiency of IT infrastructure. Using intelligent automation, it continuously ensures optimal allocation of compute, storage, and network resources without manual intervention. The platform carries out real-time optimization actions that adjust resource distribution based on current application demand.
Turbonomic supports public, private, and hybrid clouds, including major providers like AWS, Azure, and Google Cloud, along with Kubernetes and traditional data center infrastructure.
Editor’s note: Updated Turbonomic features and limitations and details of competing tools to reflect latest updates in 2026, and added one new competitor.
IBM Turbonomic Features
IBM Turbonomic delivers a powerful set of capabilities for automated, real-time optimization of IT infrastructure and applications. By continuously analyzing performance, utilization, and demand across environments, it helps organizations assure application performance, lower costs, and simplify resource management without manual intervention.
Key features include:
- Continuous real-time optimization: Automatically adjusts compute, storage, network, and container resources based on live demand to maintain performance and efficiency.
- AI-driven insights & automation: Uses intelligent analysis to generate trusted right-sizing actions, scaling decisions, and automation policies.
- Application-aware resource management: Models full application stacks to ensure resources match application demand across all layers of the environment.
- Hybrid & multicloud support: Optimizes workloads across public clouds (AWS, Azure, GCP), private clouds, and on-premise infrastructure.
- Cloud cost optimization: Rightsizes cloud resources, maximizes discount coverage, and automates parking or stopping of idle workloads to reduce spend.
- Scenario planning & forecasting: Enables “what-if” planning for capacity growth, migrations, hardware refreshes, and future demand.
- Full-stack visibility & reporting: Offers visibility into resource interactions and performance risk for more informed optimization and decision-making.
- Integration ecosystem: Works with cloud providers, container platforms (Kubernetes/OpenShift), hypervisors, ITSM tools, and DevOps workflows.
- Data center optimization: Automates VM and container placement and scaling to improve utilization and extend hardware value.
IBM Turbonomic Limitations
While IBM Turbonomic provides strong automation and optimization capabilities, user feedback highlights several practical limitations. These challenges often relate to complexity, integrations, and operational scalability in large or rapidly evolving environments. Limitations (as reported by users on G2) include:
- Frequent release cycles and support delays: Regular product updates can make it difficult for teams to keep up with new features and changes. Some users report slower support response times following major releases.
- Scheduling and scalability challenges: Managing resource scheduling in large-scale or rapidly expanding environments can be complex. Maintaining performance and cost-efficiency during infrastructure growth or demand spikes may require additional tuning.
- Limited integrations: Some users report gaps or shallow integrations with certain third-party or niche tools. This can lead to manual workarounds and reduced workflow automation across the broader IT ecosystem.
- Need for greater customization flexibility: Organizations with specialized operational requirements may find the platform’s configuration options somewhat rigid, requiring additional effort to align automation policies with internal standards.
- Steep learning curve and setup complexity: Initial deployment, policy tuning, and understanding the decision engine can take time. Teams without dedicated implementation resources may experience a longer ramp-up period before realizing full value.
Reporting and dashboard constraints: While detailed technical insights are available, some users find executive-level reporting and dashboard customization limited, requiring manual data exports for business-focused summaries.
IBM Turbonomic Competitors and Alternatives
Infrastructure Monitoring, ITSM and Orchestration
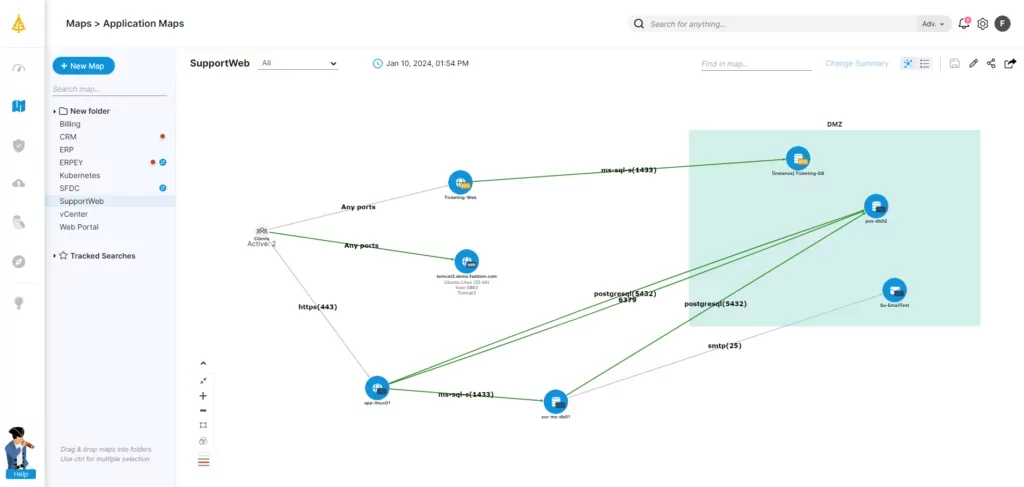
1. Faddom

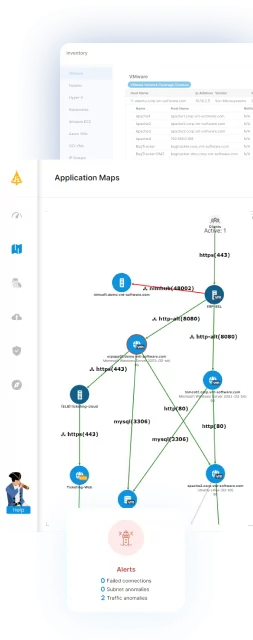
Faddom offers a unique approach to IT infrastructure optimization by mapping the entire IT ecosystem into business applications it supports. This helps IT teams identify underutilized resources and optimize costs without automatic resource allocation.
Key features:
- Agentless mapping: Completes infrastructure mapping within an hour without requiring credentials, ensuring security and ease of deployment.
- Business application mapping: Provides detailed visualizations of IT assets and their relationships to business applications, aiding in precise resource management.
- Cost optimization: Identifies underused servers and resources, helping to reduce operational costs efficiently.
- Lightweight deployment: Its lightweight nature ensures minimal disruption to existing systems during setup.
- Affordable pricing: Starts at $10K/year, making it accessible for organizations of various sizes.
Source: Faddom
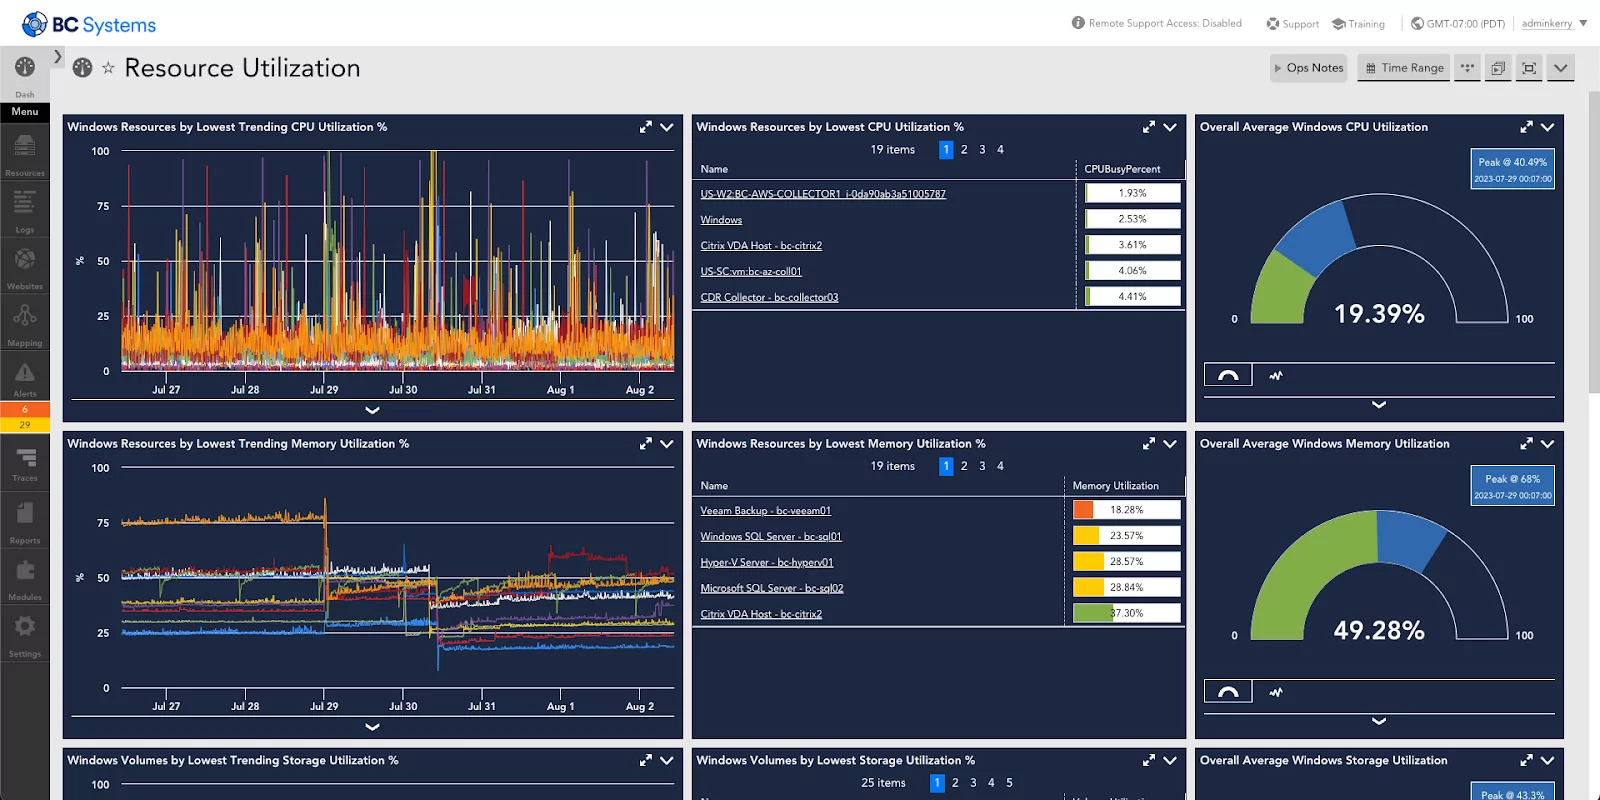
2. LogicMonitor

LogicMonitor is a hybrid observability platform to provide unified visibility across on-premises and multi-cloud environments. It supports infrastructure monitoring, cloud monitoring, and log analytics. The solution also incorporates AI-driven event analysis to help teams detect anomalies, reduce alert noise, and accelerate root cause identification across IT estates.
Key features:
- Hybrid infrastructure monitoring: Provides contextual visibility across data centers and multi-cloud environments from a single interface.
- AIOps with unified event intelligence: Uses AI to correlate events, reduce alert noise, and assist with faster incident resolution.
- Cloud and multi-cloud visibility: Delivers real-time performance insights for AWS, Azure, and Google Cloud deployments.
- Log analytics and correlation: Combines logs with metrics, alerts, and resource data for simplified troubleshooting.
- Extensive integrations: Offers more than 3,000 out-of-the-box integrations spanning on-premises and cloud technologies.
Source: LogicMonitor
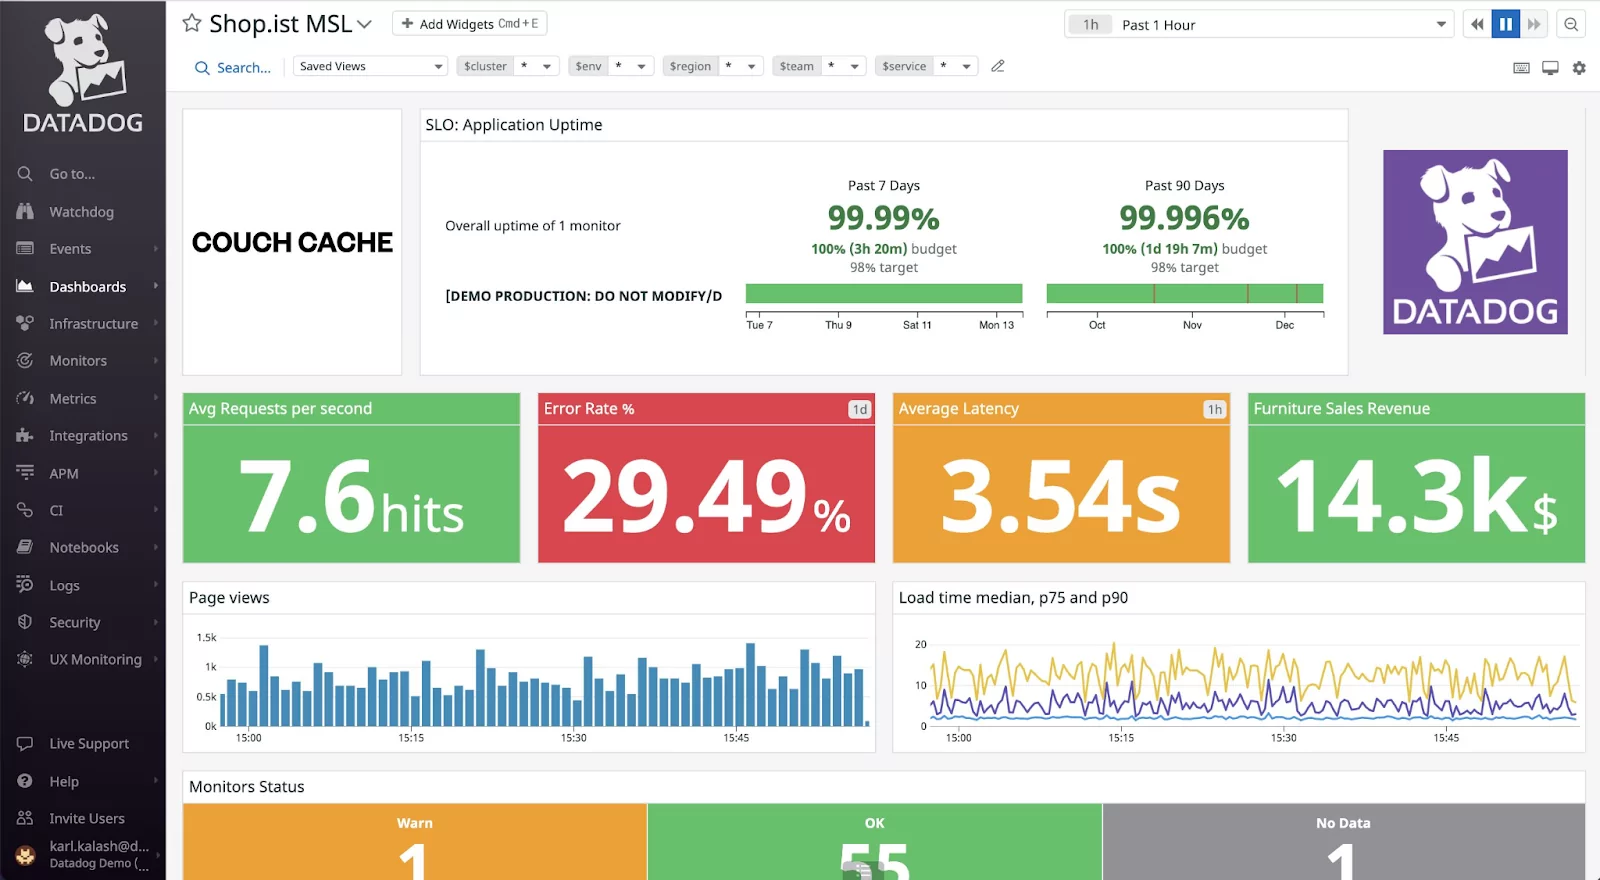
3. Datadog
Datadog is a full-stack observability and security platform for large-scale cloud and distributed environments. It provides visibility across applications, infrastructure, and development pipelines. The platform supports monitoring throughout the software lifecycle, helping teams detect issues early and evaluate production impact after deployments.
Key features:
- Full-stack observability: Monitors applications, infrastructure, and services across complex environments.
- CI/CD pipeline visibility: Detects critical issues before production and evaluates deployment health.
- Performance bottleneck detection: Identifies slow queries, traffic spikes, and runtime errors.
- Tool consolidation: Replaces multiple monitoring tools with a unified platform to reduce operational overhead.
- Enterprise scalability: Designed to operate across large, distributed environments.
Source: Datadog
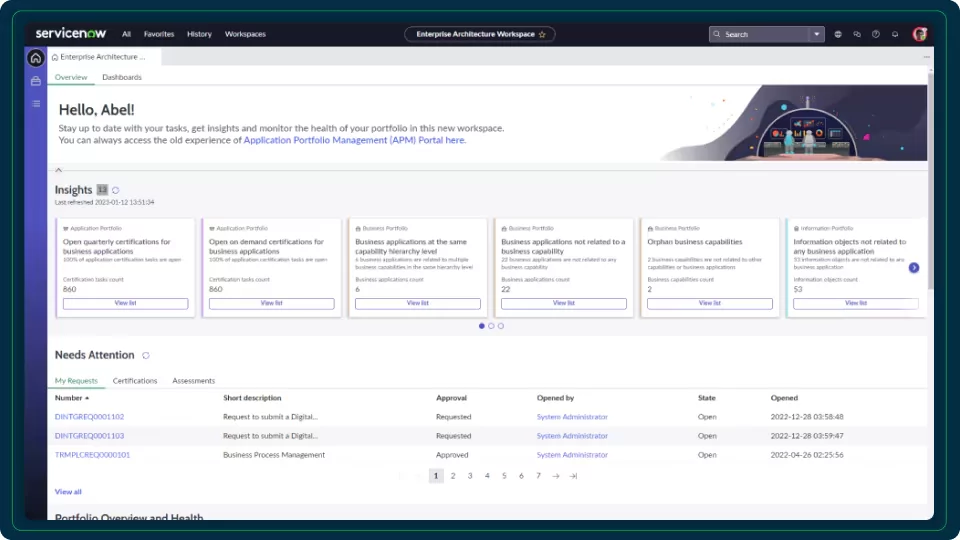
4. ServiceNow
ServiceNow Service Mapping provides service-aware visibility into applications and their underlying infrastructure. It maps relationships between IT components, cloud resources, and business services. Integrated with ServiceNow IT operations management, it helps teams assess business impact and maintain accurate service maps in dynamic environments.
Key features:
- AI-driven service mapping: Generates service maps using machine learning with tag-based and traffic-based methods.
- Multicloud discovery: Supports automated discovery and mapping across major cloud platforms.
- Automatic map updates: Keeps service maps current when infrastructure changes occur.
- CMDB integration: Connects directly with the ServiceNow configuration management database for service-aware operations.
- Flexible connection methods: Supports multiple mapping approaches to fit different environments.
Source: Servicenow
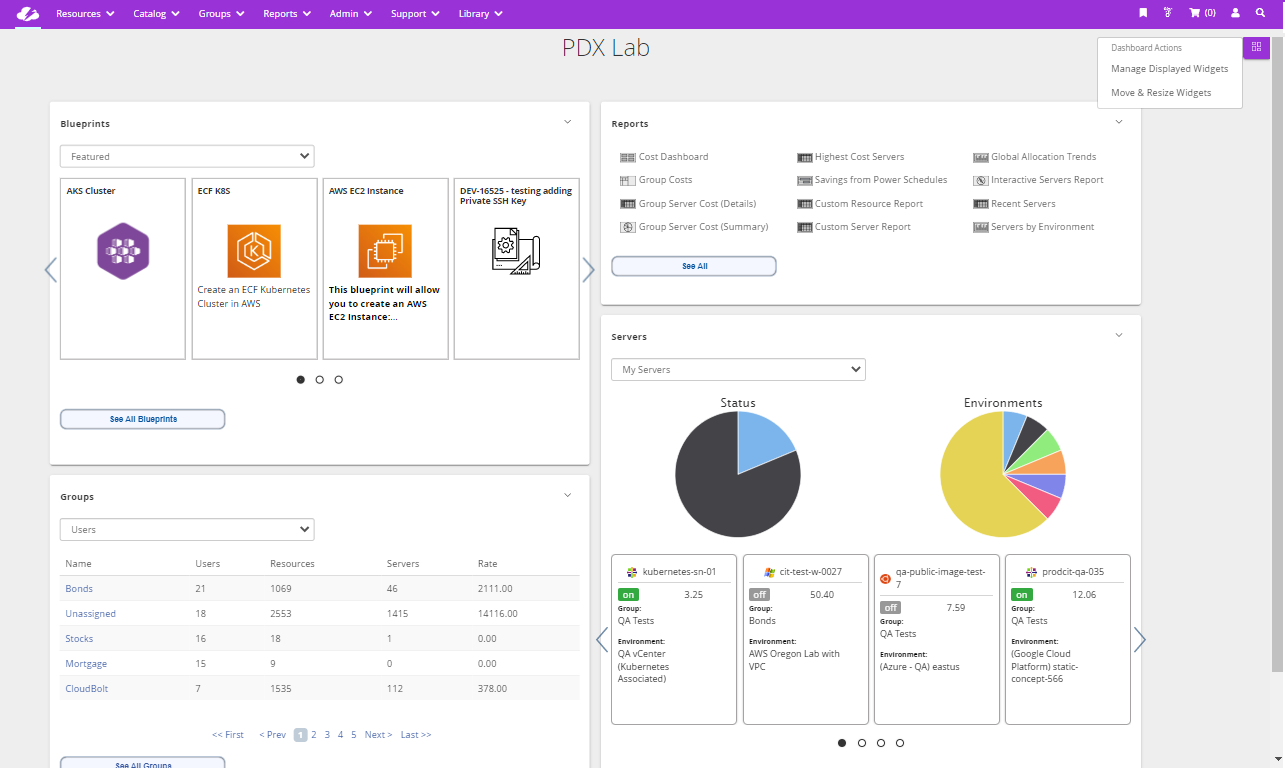
5. CloudBolt

CloudBolt is a hybrid cloud management platform focused on provisioning, governance, cost visibility, and continuous optimization. It enables organizations to manage public cloud, private infrastructure, and Kubernetes environments from a unified control plane. The platform emphasizes policy-driven automation and cost allocation across distributed environments.
Key features:
- Hybrid cloud reporting: Provides visibility across public cloud, private data centers, and SaaS environments.
- Provisioning and self-service: Automates infrastructure delivery through policy-driven workflows.
- Continuous optimization: Supports ongoing cost and resource optimization, including Kubernetes rightsizing.
- Allocation and chargeback: Enables cost distribution and financial reporting for FinOps use cases.
- Broad integrations: Connects with over 200 tools and cloud services.

Source: CloudBolt
Application Performance Monitoring and Full-Stack Observability
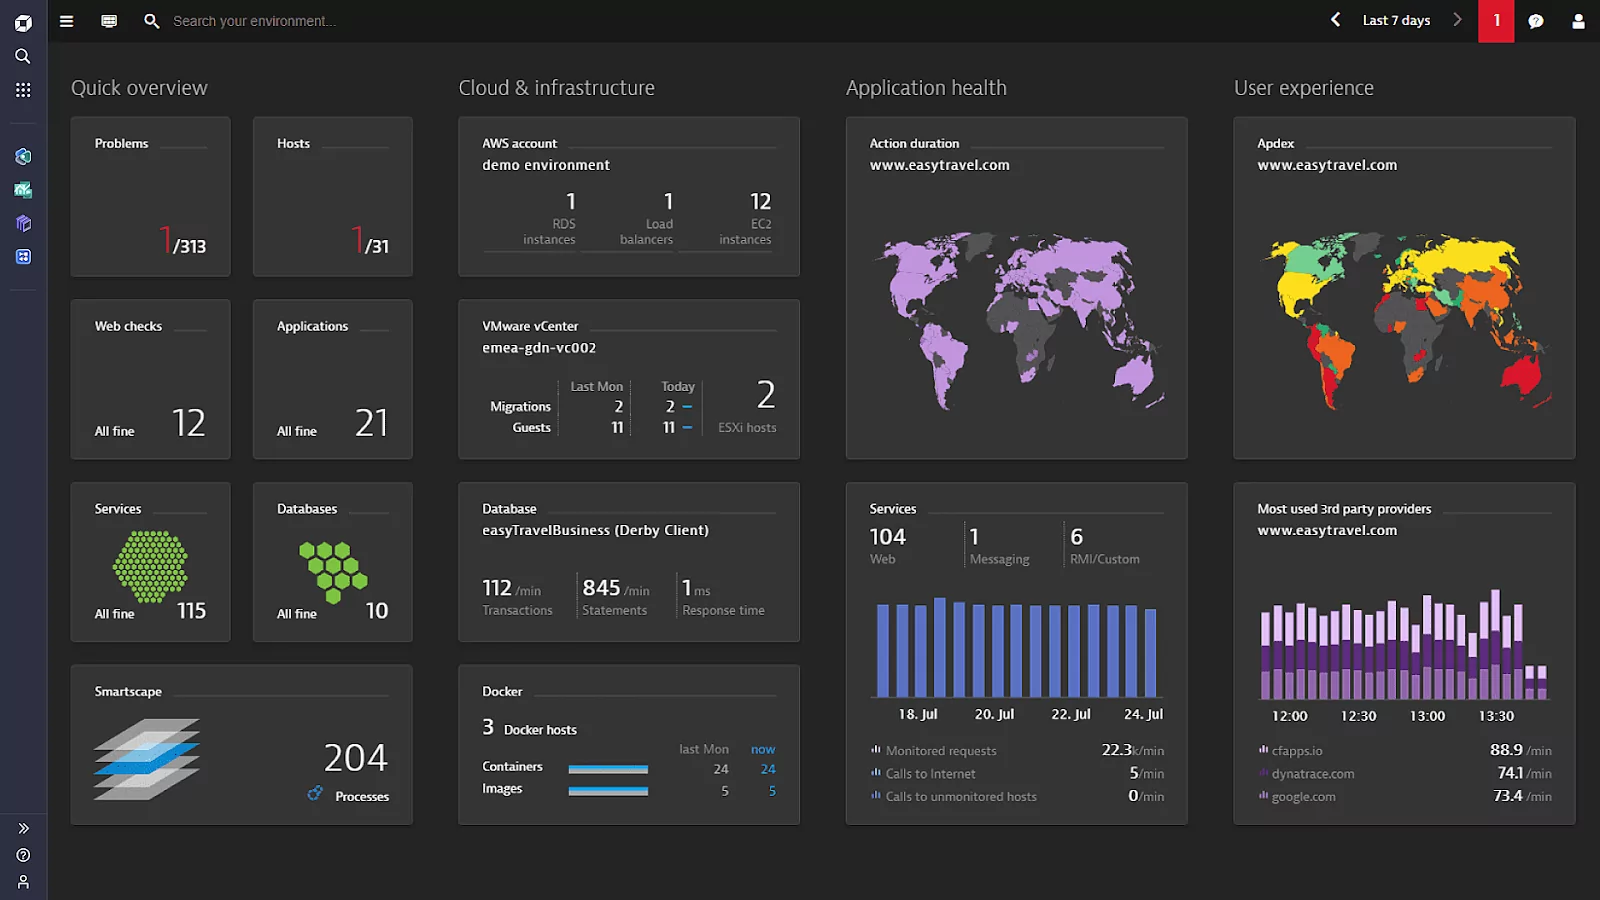
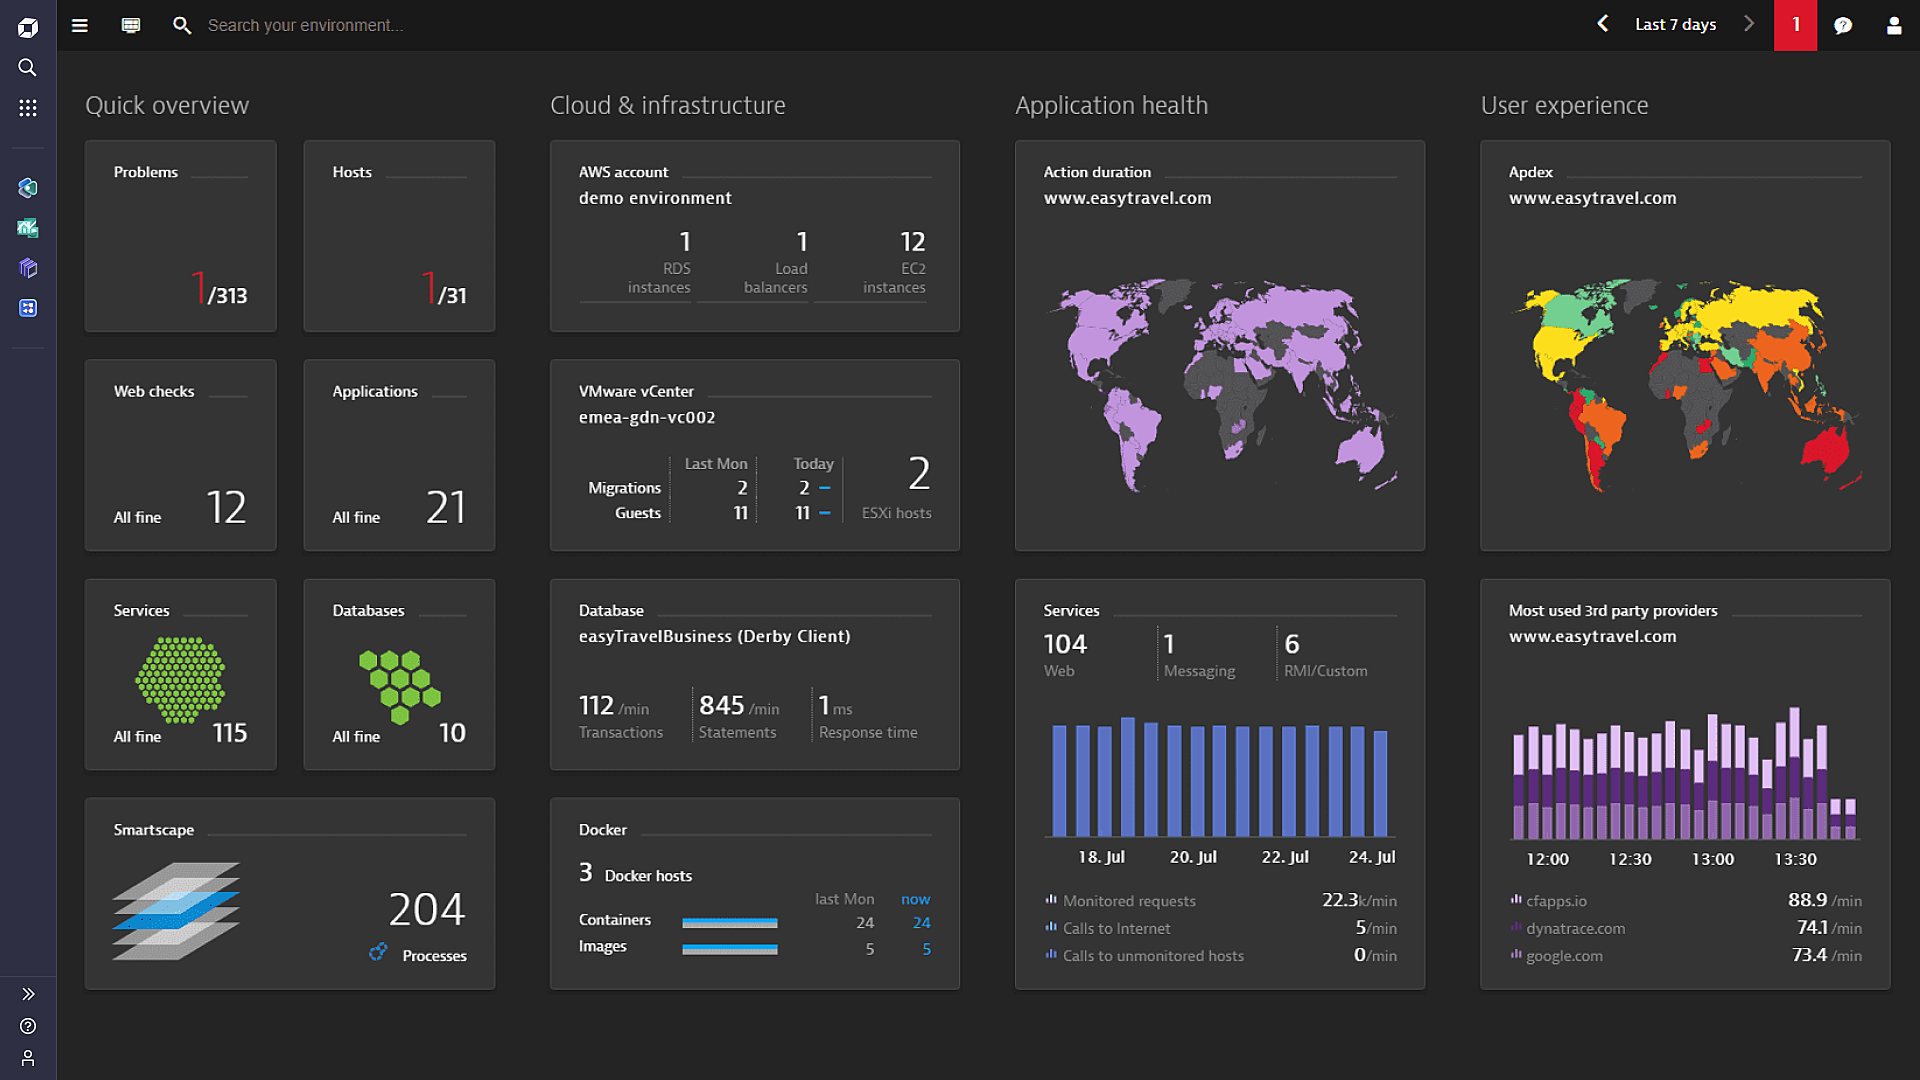
6. Dynatrace
Dynatrace is an AI-powered observability platform that unifies application, infrastructure, security, and business monitoring. It leverages a centralized data platform to analyze telemetry across cloud-native and traditional environments. AI capabilities help teams automate root cause analysis and drive real-time operational decisions.
Key features:
- AI-driven observability: Uses deterministic AI to detect anomalies and automate root cause analysis.
- Unified data platform: Consolidates telemetry into a centralized data lakehouse for contextual analysis.
- Full-stack coverage: Monitors applications, infrastructure, digital experience, and security in one platform.
- Automation engine: Enables automated workflows and agent-based remediation.
- Broad cloud integrations: Supports major cloud platforms and container technologies such as Kubernetes and Docker.
Source: Dynatrace
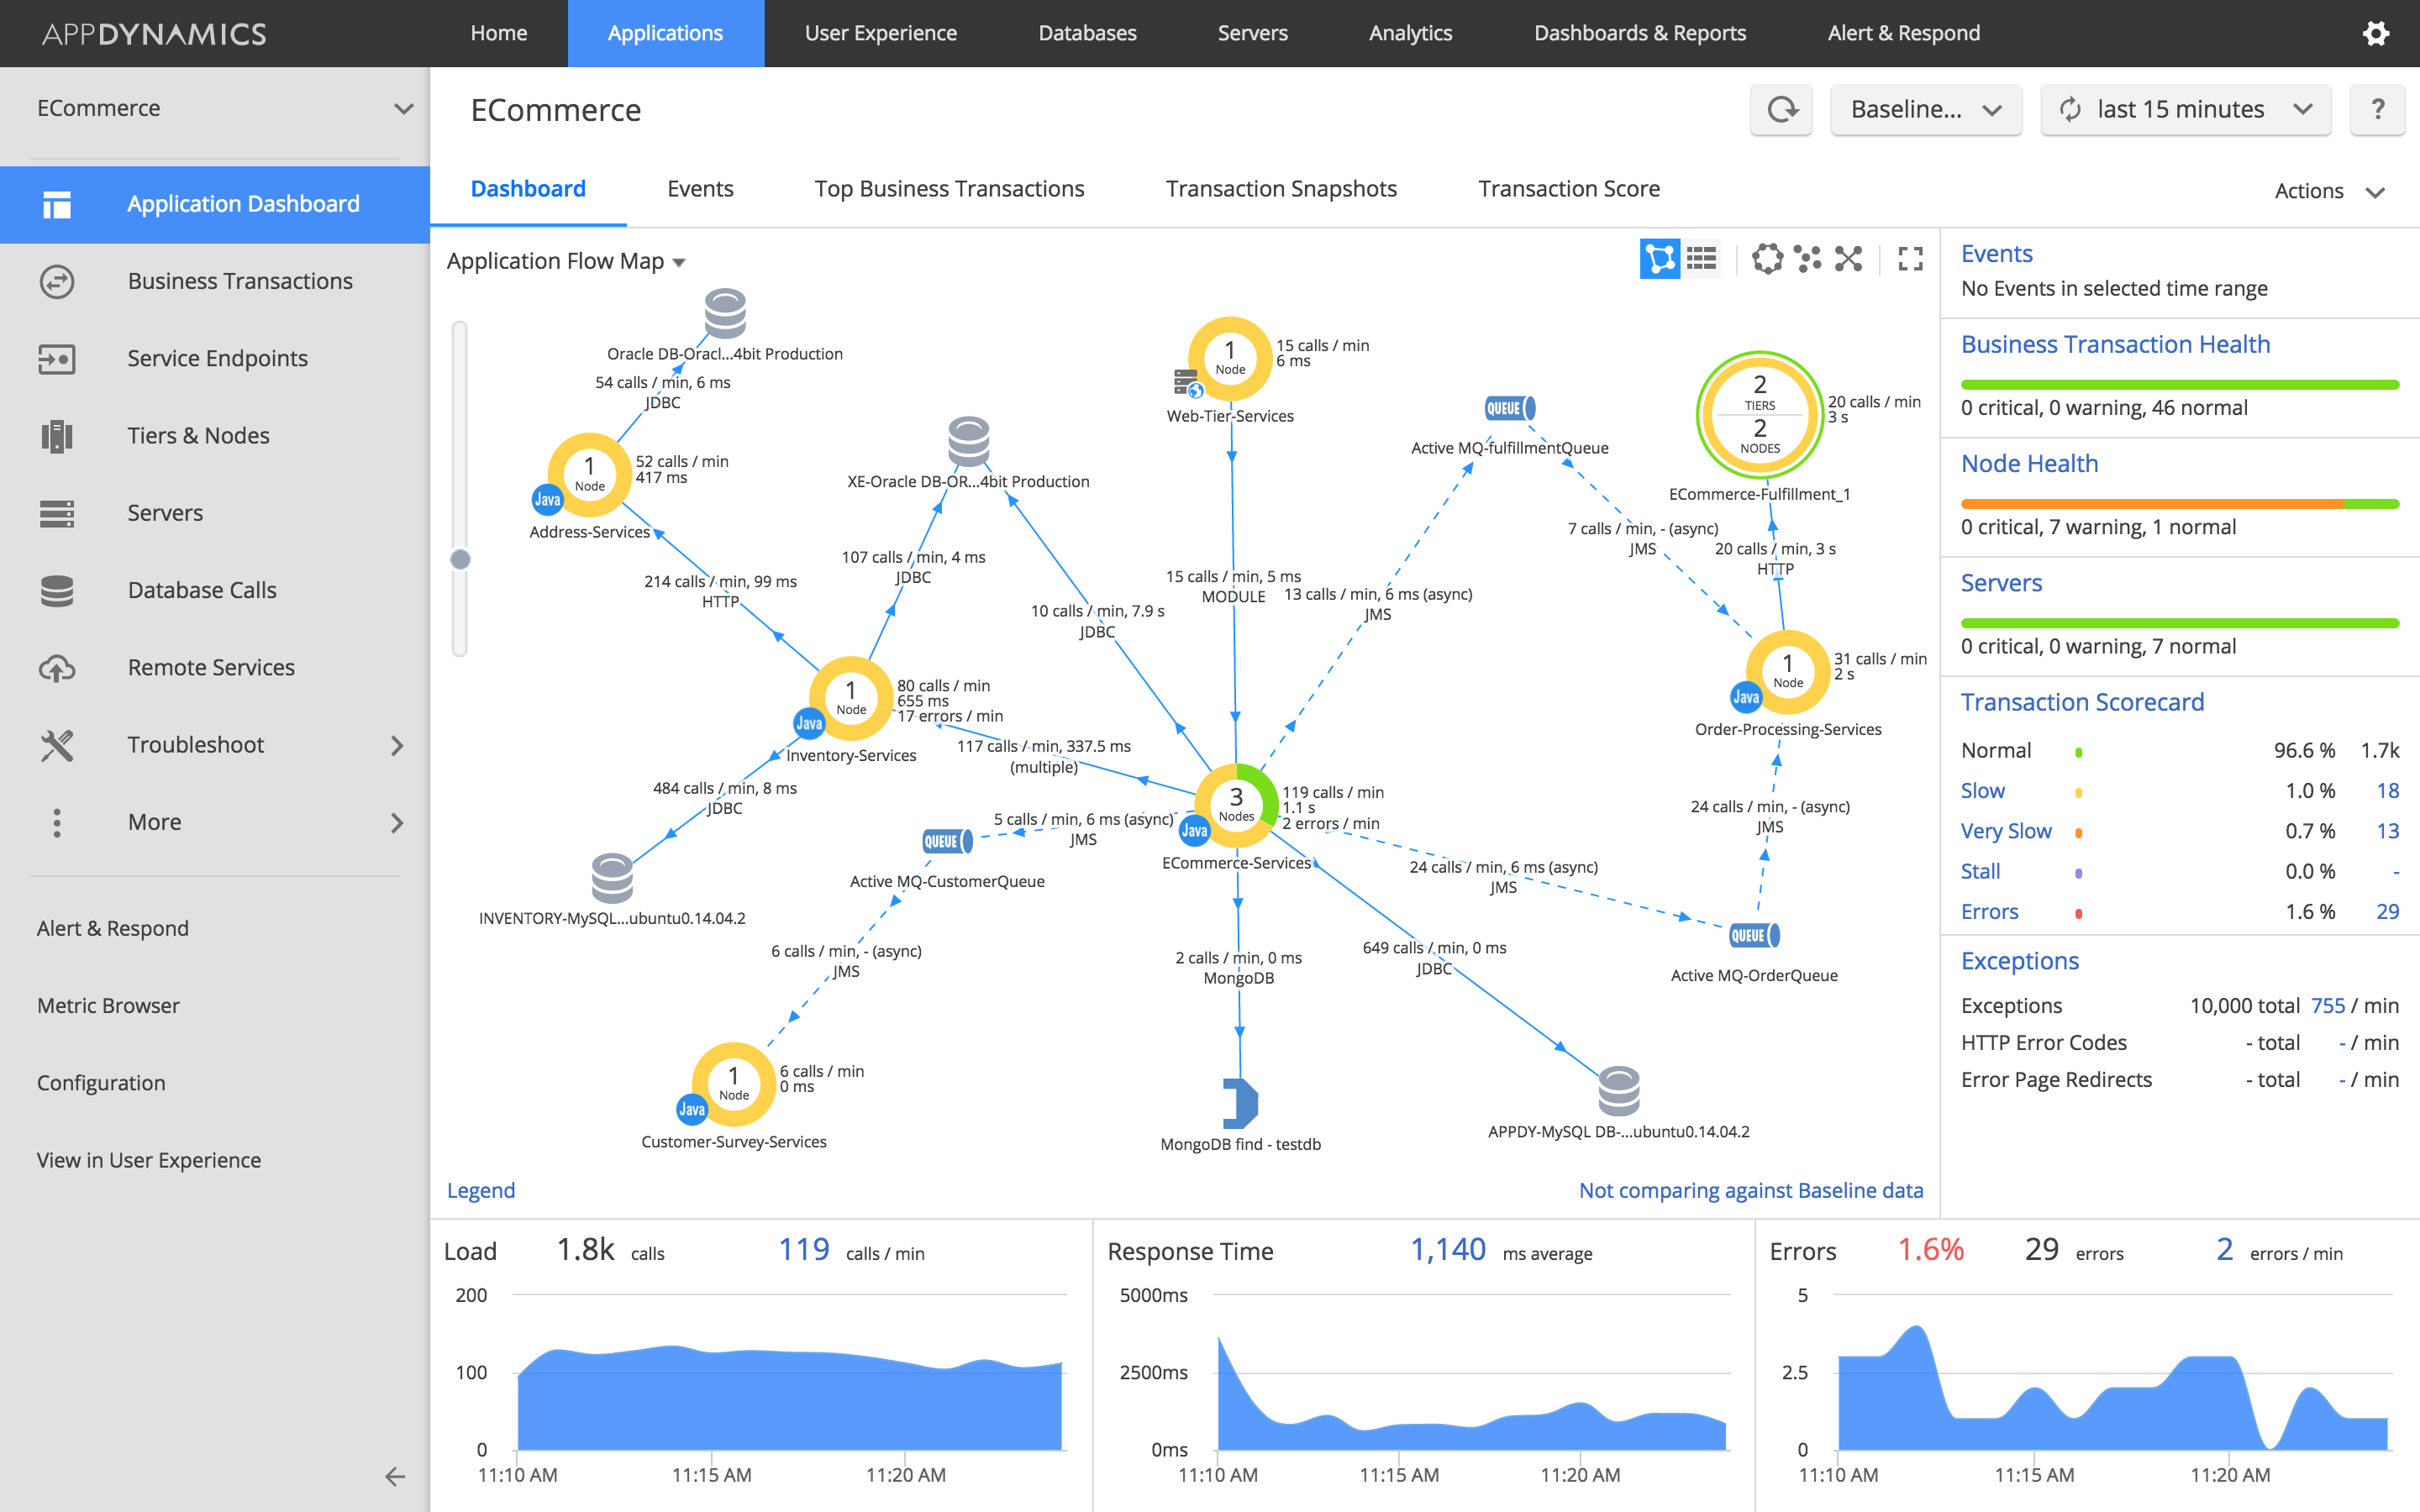
7. AppDynamics
Cisco AppDynamics is an application performance monitoring solution for cloud and on-premises environments. It delivers end-to-end visibility into application performance and correlates technical metrics with business outcomes. The platform supports real-time monitoring and automated diagnostics in multicloud environments.
Key features:
- Real-time application monitoring: Detects performance issues before they impact users.
- End-to-end service visibility: Provides visibility across applications, infrastructure, and dependencies.
- Machine learning diagnostics: Automates root cause detection using performance analytics.
- Multicloud monitoring: Supports public, private, and hybrid cloud environments.
- Secure architecture: Offers role-based access controls and secure deployment options.

Source: AppDynamics
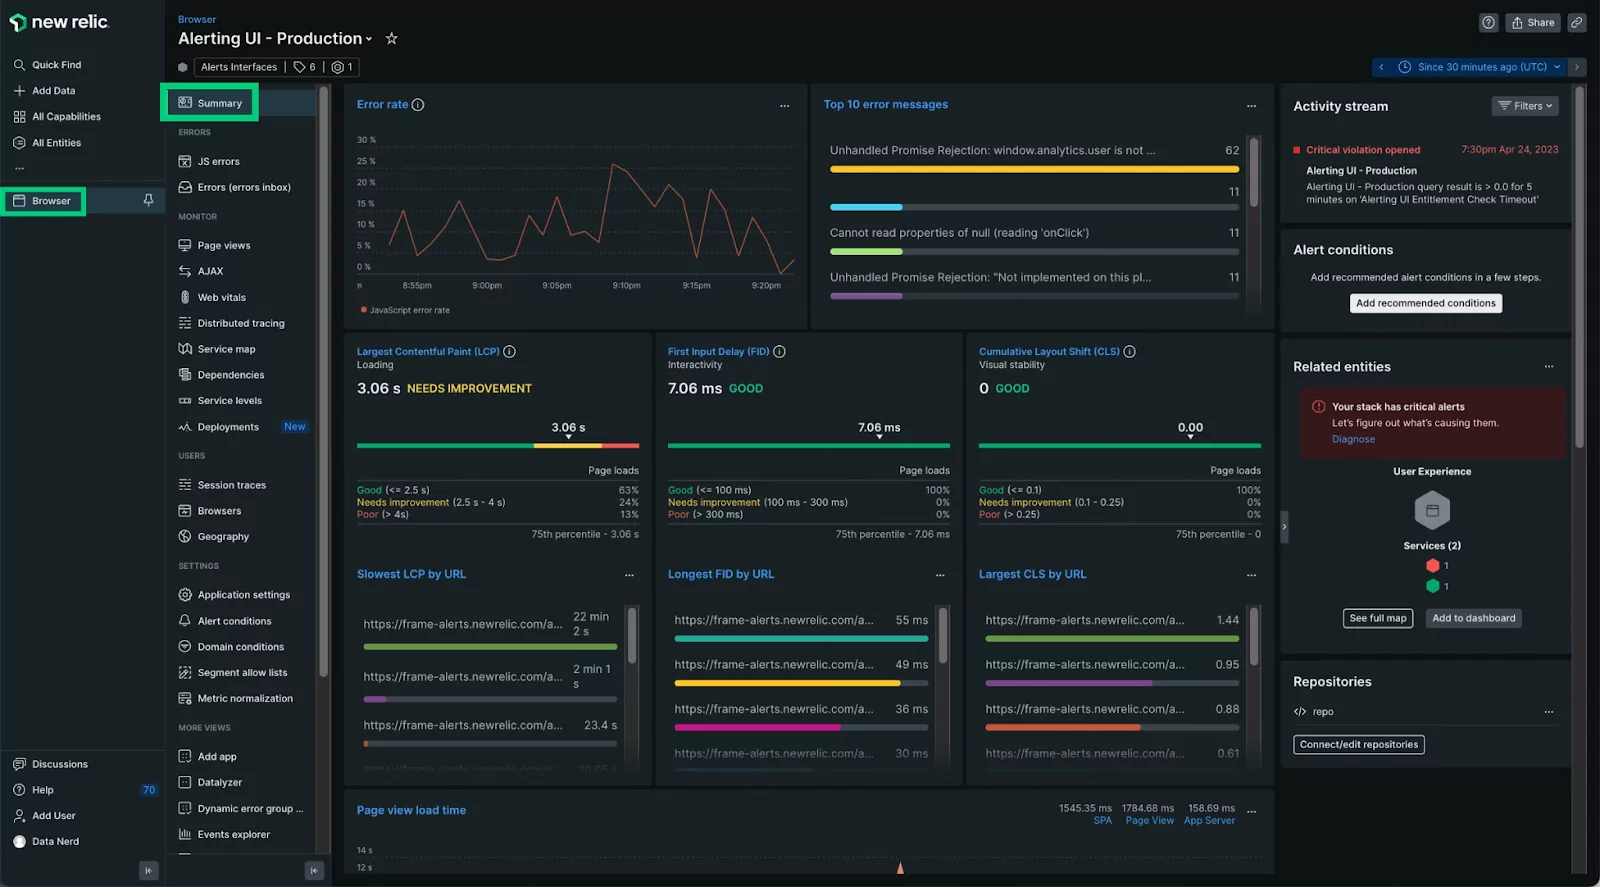
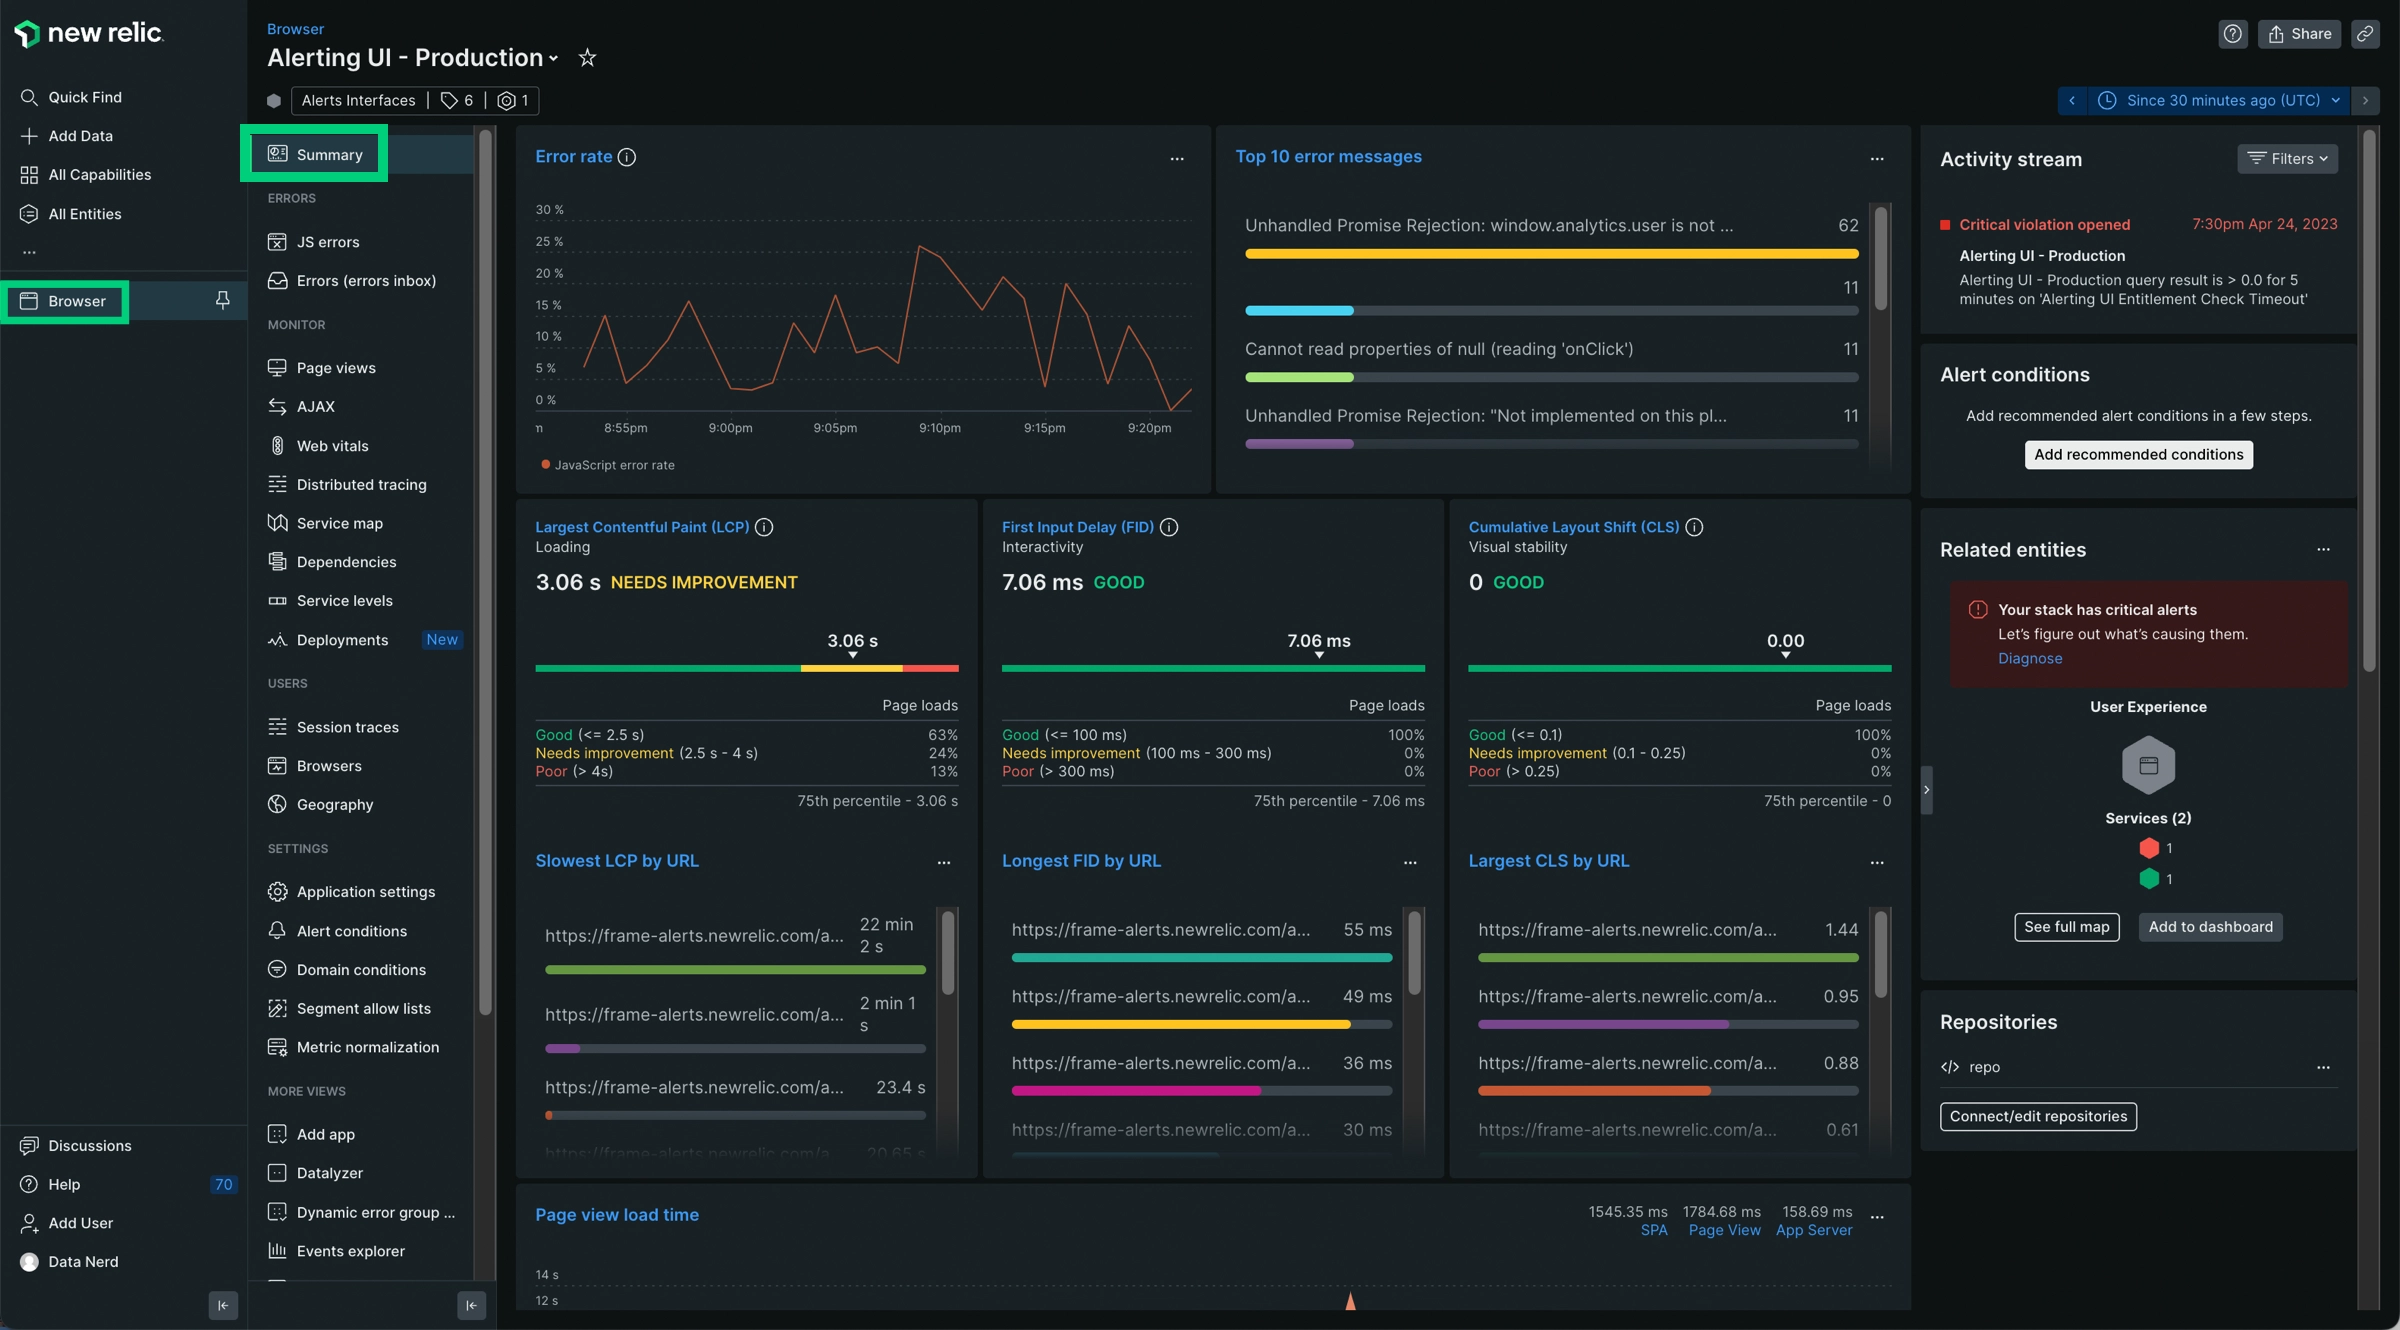
8. New Relic
New Relic is a full-stack observability platform that provides monitoring across applications, infrastructure, logs, and user experience. It supports open standards such as OpenTelemetry and integrates with hundreds of third-party tools. The platform enables teams to monitor distributed systems in real time using customizable dashboards and alerts.
Key features:
- Application performance monitoring: Provides visibility into backend services and frontend experiences.
- Infrastructure monitoring: Delivers unified monitoring for on-premises and cloud environments.
- Log management: Ingests and analyzes high volumes of log data for troubleshooting.
- Extensive integrations: Supports hundreds of integrations and open standards.
- Custom dashboards and alerts: Enables cross-platform visualization and proactive alerting.
Source: New Relic
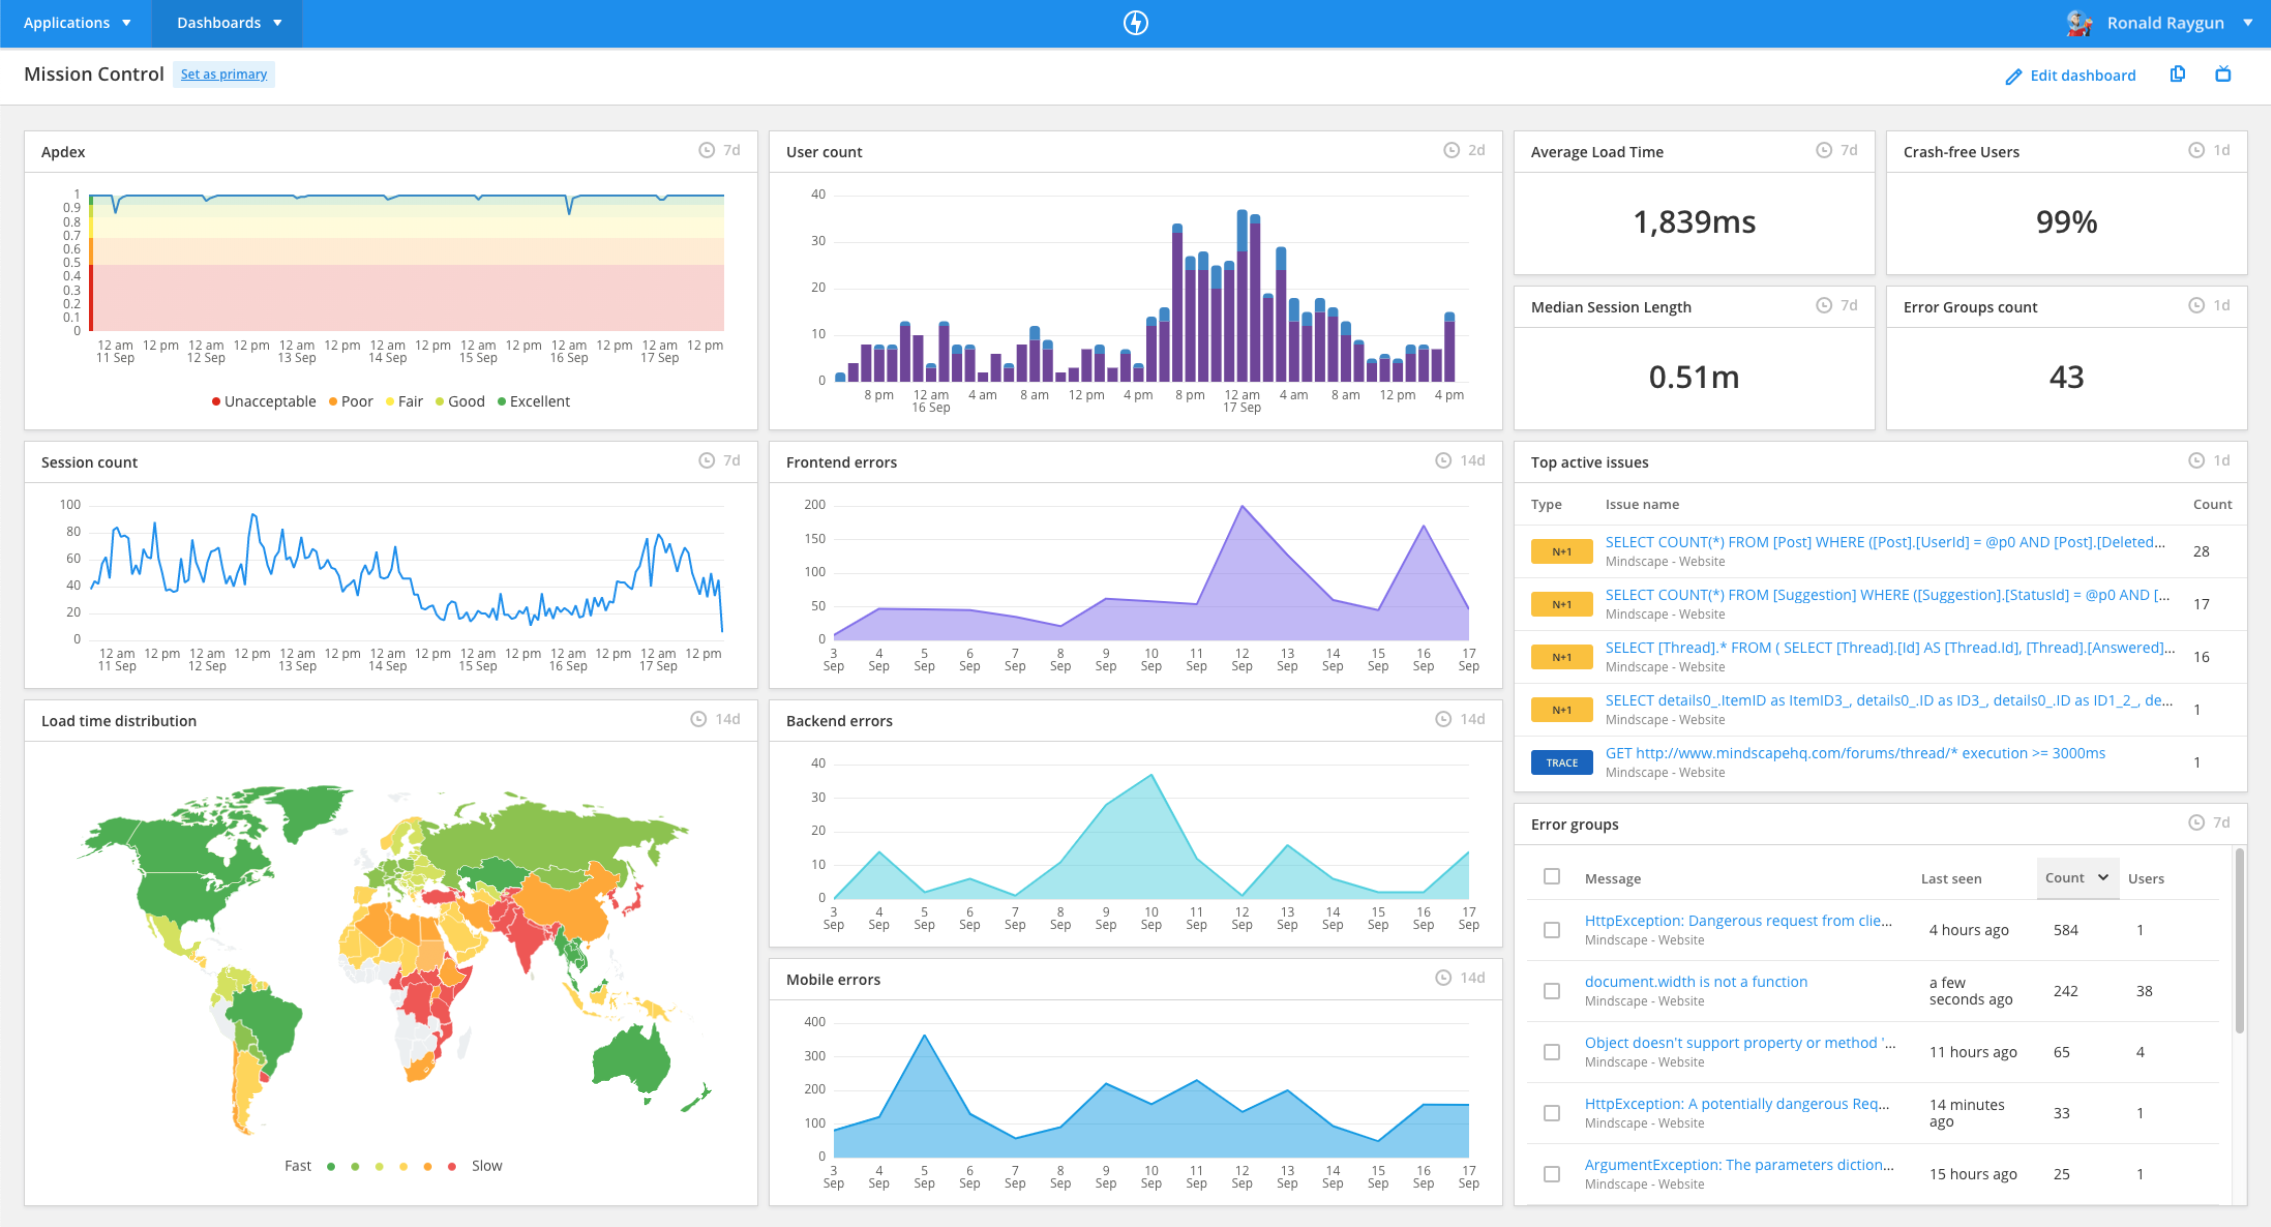
9. Raygun

Raygun is a monitoring platform focused on crash reporting, real user monitoring, and application performance management. It helps teams identify and resolve performance bottlenecks and application errors. The platform supports multiple programming languages and integrates with common development tools.
Key features:
- Crash reporting: Captures error data with stack traces and context.
- Real user monitoring: Tracks frontend performance and user experience metrics.
- Application performance monitoring: Monitors backend request lifecycles and identifies bottlenecks.
- Tool integrations: Connects with tools such as Slack, GitHub, Jira, and Bitbucket.
- Compliance and security controls: Supports standards such as HIPAA, GDPR, CCPA, and PCI.

Source: Raygun
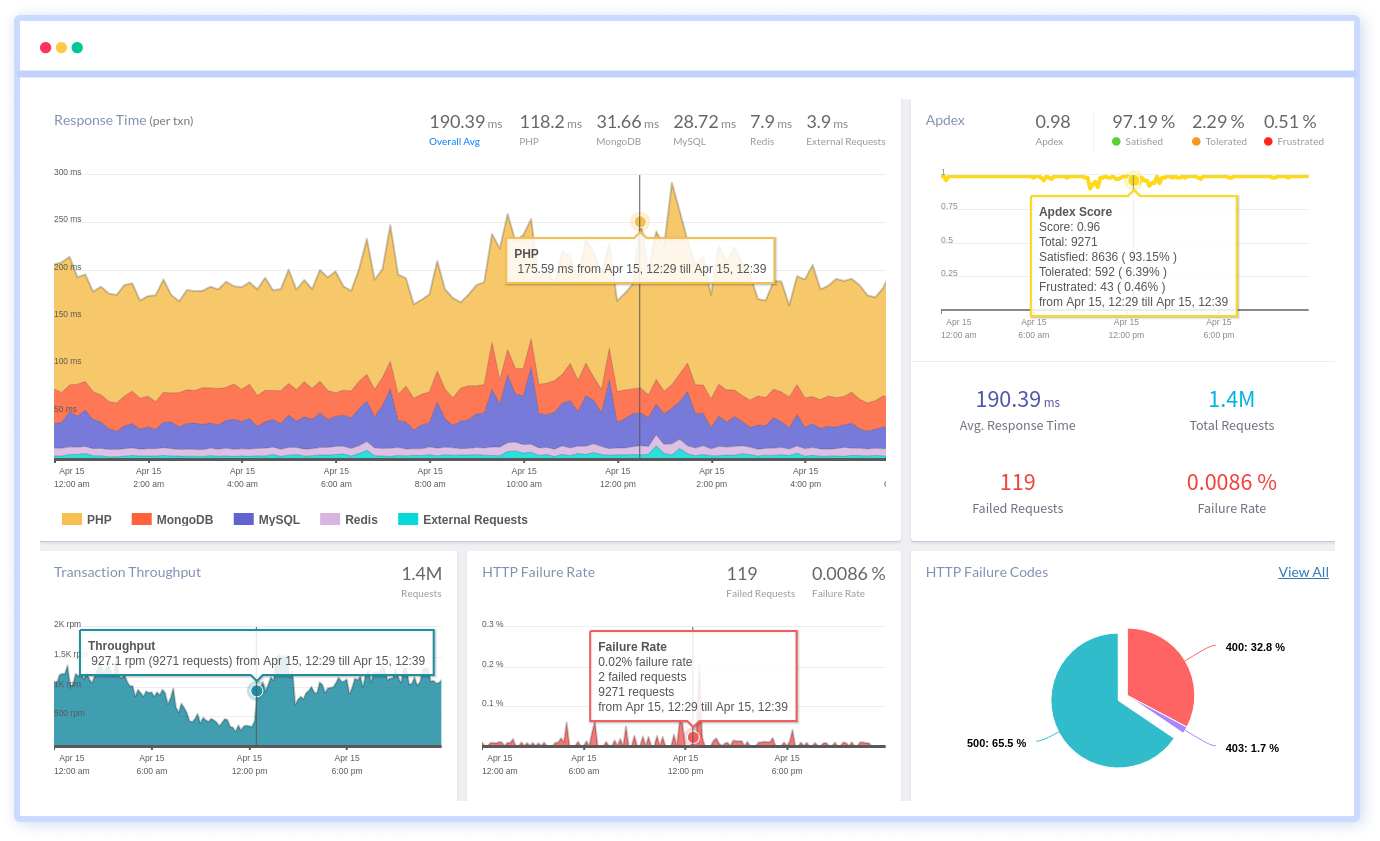
10. Atatus

Atatus is a full-stack observability platform that combines application performance monitoring, infrastructure monitoring, log management, and security insights. It supports distributed systems, including microservices and Kubernetes environments. The platform provides tracing and performance diagnostics across services and dependencies.
Key features:
- Application performance monitoring: Tracks request flows, microservices interactions, and error traces.
- Infrastructure and Kubernetes monitoring: Provides visibility into infrastructure and containerized environments.
- Log management: Aggregates and analyzes log data alongside performance metrics.
- Database and API analytics: Profiles database queries and monitors API performance.
- Broad technology support: Supports over 200 frameworks, integrations, and cloud services.

Source: Atatus
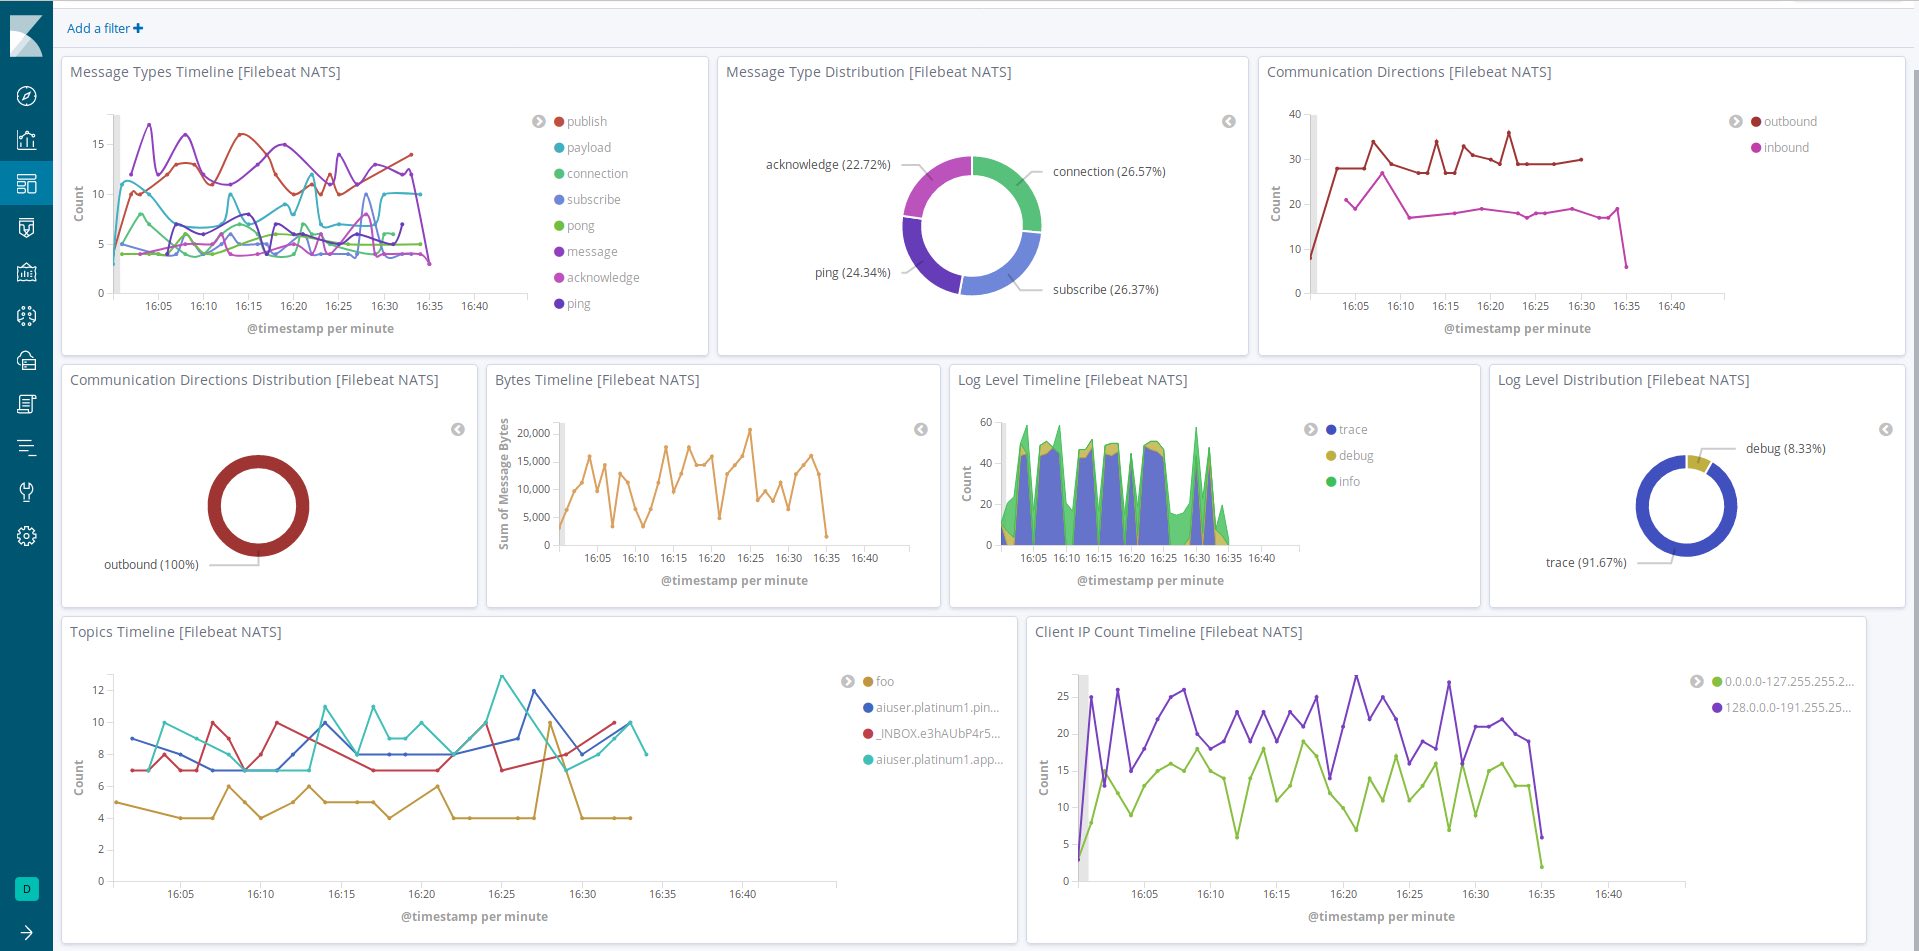
11. Elastic Observability
![]()
Elastic Observability is a full-stack observability platform built on Elasticsearch and open standards such as OpenTelemetry. It supports log analytics, application performance monitoring, infrastructure monitoring, digital experience monitoring, and AIOps within a unified data platform.
Key features:
- Log analytics: Enables large-scale log ingestion and search with tools for ad hoc queries, dashboards, and pattern analysis.
- Application performance monitoring: Supports OpenTelemetry-native instrumentation with broad language support and sampling capabilities.
- Infrastructure monitoring: Provides visibility across cloud, on-premises, Kubernetes, serverless, and host environments with extensive out-of-the-box integrations.
- AIOps and anomaly detection: Delivers always-on anomaly detection, correlation, and root cause analysis using machine learning.
- Digital experience monitoring: Includes real user monitoring (RUM), synthetic testing, and uptime monitoring to track frontend performance.
Source: Elastic
Conclusion
While IBM Turbonomic offers robust IT automation and resource optimization, organizations may encounter limitations such as frequent release cycles, scalability challenges, and limited integration options. These factors can prompt the consideration of alternative solutions that better align with specific operational needs, provide more extensive customization, or offer enhanced integration capabilities. Evaluating the unique features and strengths of various competitors can help organizations choose the right platform to optimize their IT infrastructure efficiently.

