
Asset discovery tools are designed to automatically identify and catalog all the IT assets within an organization’s network. They scan networks to detect devices, software, and sometimes configurations or services, creating an inventory of digital (and occasionally physical) assets. This process aids in understanding the scope of an organization’s resources, enabling better asset management and security.
By providing real-time visibility into the assets on a network, asset discovery tools play a crucial role in IT asset management (ITAM). They help organizations keep track of asset performance, usage, and lifecycle.
Additionally, these tools can identify unauthorized devices or software, helping to mitigate potential security risks. Their ability to discover and document assets automatically saves time and reduces errors compared to manual inventory methods.
This is part of a series of articles about application discovery.
Key Features of IT Asset Discovery Tools
IT asset discovery tools typically offer the following capabilities:
-
- Network scanning: Enables the automatic detection of all connected devices and software within an organization’s network. This allows for the identification of networked assets, including servers, workstations, printers, routers, and switches.
-
- Software license management: Tracks and manages the usage and deployment of software licenses within an organization. This helps ensure compliance with software licensing agreements, preventing legal issues and financial penalties associated with under-licensing or over-licensing software.
-
- Inventory management: Offers a centralized repository for tracking and managing all IT assets across an organization. This enables IT teams to maintain up-to-date records of hardware, software, and associated details such as purchase dates, warranty information, and configuration settings.
-
- Compliance reporting: Automates the process of generating reports that demonstrate adherence to various regulatory standards and internal policies. These tools collect data on software licenses, hardware configurations, and network activities to compile detailed documentation for audit trails. This capability is essential for organizations subject to GDPR, HIPAA, or SOX regulations.
Related Content: Read our guide about IT mapping and application discovery
Notable Asset Discovery Tools
The tools below are grouped into three categories based on how they discover assets: solutions that scan networks and map infrastructure, broader IT asset management platforms that build and maintain an inventory, and tools that discover SaaS, cloud, and internet-facing assets beyond the traditional network perimeter.
Network and Infrastructure Discovery
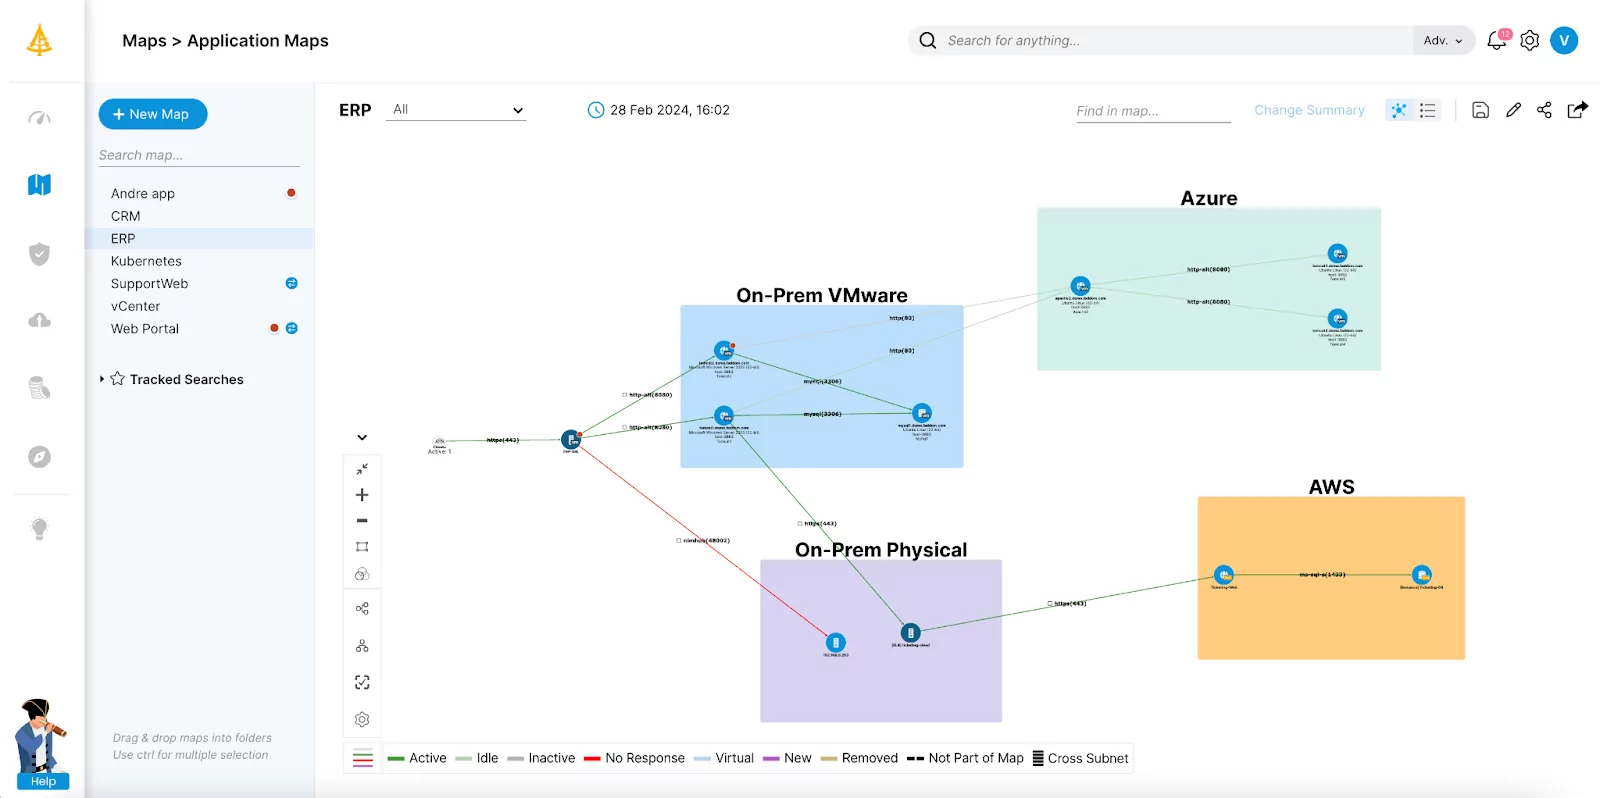
1. Faddom

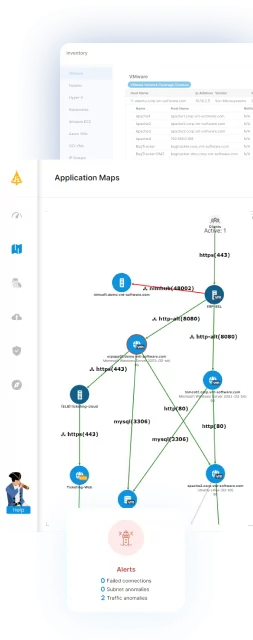
Faddom is a real-time application dependency mapping (ADM) tool that discovers servers and the business applications they support across on-premises, cloud, and hybrid environments. It builds a continuously updated map of an organization’s infrastructure by passively analyzing a copy of network traffic, so it does not require agents, credentials, or firewall changes. The platform automatically groups discovered servers into business applications and visualizes the east-west traffic and dependencies between them. It uses AI-driven correlation to turn raw network data into application and dependency maps, and it updates 24/7. Faddom is designed to deploy quickly, producing a first map within about an hour, and runs in read-only mode so data stays within the customer’s environment.
Key features include:
- Agentless, passive discovery: Faddom maps the environment by analyzing a copy of network traffic rather than installing agents or using server credentials. This means no firewall changes are required, the system can work offline, and it does not add load to monitored servers. Because it is read-only, it avoids making changes to the environment it observes.
- Real-time dependency mapping: The platform maps servers, applications, and the dependencies between them, updating continuously 24/7. It visualizes east-west traffic and how systems communicate, giving teams a current view rather than static, outdated documentation. Changes in the environment are tracked as they occur.
- Automatic business-application grouping: Discovered servers are automatically grouped into the business applications they support. This turns a flat list of machines into an application-centric view, making it easier to understand which servers belong to which application and how they interconnect.
- Hybrid and multi-cloud coverage: Faddom connects to on-premises data centers and cloud environments and maps them in a single view. It is platform-agnostic across hybrid and multi-cloud infrastructure, so teams get one consolidated map regardless of where assets run.
- Use-case coverage across IT and security: The same map supports asset discovery and documentation, change management and impact analysis, data center and cloud migration planning, resource and cost optimization, and IT audit and compliance. On the security side, Faddom surfaces an internal attack-surface view and a risk score that combines factors such as SSL, CVEs, users, and external traffic.
- Fast, simple deployment: Faddom installs in minutes and typically produces a first map within about 60 minutes of deployment. A single person can map an organization without a lengthy rollout, and a free trial is available without a sales call or credit card.
Limitations (as reported by users on G2):
- Setup in complex environments: A few users running large proof-of-concept deployments noted that completing initial configuration took longer than planned and benefited from working with Faddom’s support team to finalize.
- Documentation clarity: Some reviewers felt that certain setup guidance, such as cloud deployment templates, could be clearer and more consistent.
- Scope of an agentless approach: Because discovery relies on observing network traffic, capturing every dependency in heavily encrypted or tightly segmented environments can call for additional data sources, and Faddom is intended to
2. Lansweeper

Lansweeper is an IT asset discovery and inventory platform — positioned by the vendor as a Cyber Asset Intelligence platform — that automatically finds and catalogs every connected asset across IT, OT, IoT, and cloud environments. It combines several scanning methods to build a continuously updated inventory of hardware, software, users, and configuration data, then connects that data to insights on usage, lifecycle, and risk. Lansweeper is used to eliminate blind spots, detect unmanaged or rogue devices, and serve as a single source of truth that feeds other IT and security tools. It supports both agent-based and agentless discovery and is used across more than 30,000 environments.
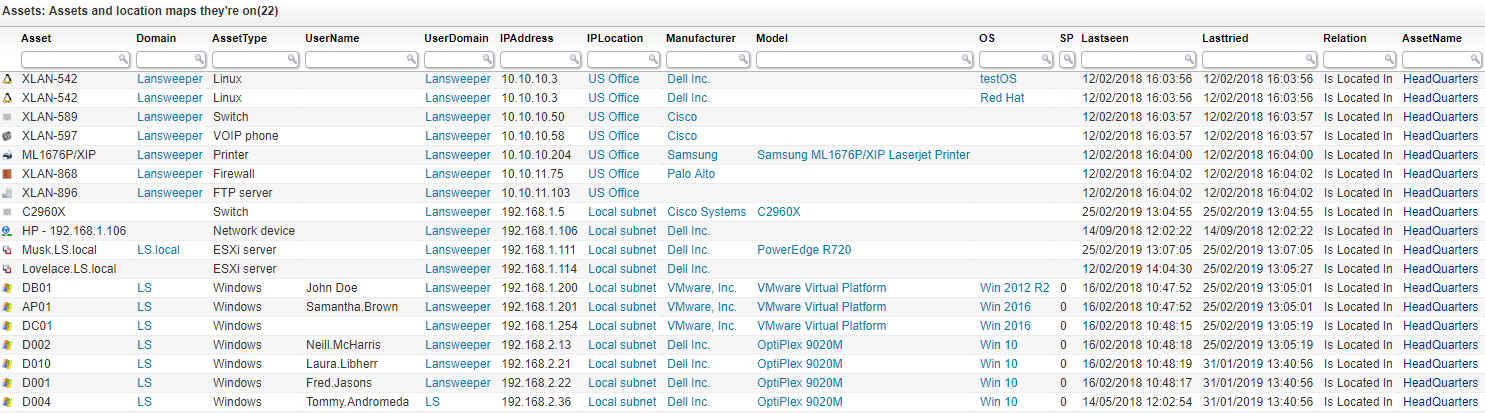
Source: Lansweeper
Key features include:
- Full-spectrum asset discovery: Lansweeper discovers and catalogs assets across IT, OT, IoT, and cloud, including servers, workstations (Windows, Linux, Mac), printers, switches, routers, virtual machines, cloud instances, mobile devices, and PLCs. It unifies physical, virtual, and cloud discovery so devices and systems are less likely to go uncatalogued.
- Multiple scanning methods: The platform combines active scanning (deep, targeted scans of known devices), passive discovery (silently listening to network traffic to find unmanaged assets), cloud API integration for AWS, Azure, and Google Cloud, and lightweight agents for remote or roaming devices. It can also import data from SCCM, Intune, and other sources, or accept manual CSV/XLS uploads.
- Deep data enrichment: Beyond identifying assets, Lansweeper captures hardware specs, installed software, configuration details, and OS versions. It surfaces known vulnerabilities tied to assets, flags lifecycle and end-of-life risks, and highlights shadow IT, turning raw inventory into contextual data.
- Unmanaged and rogue device detection: The platform detects and classifies devices as soon as they connect to the network and can alert teams when a new or unknown device appears. This helps surface shadow IT and rogue endpoints and reduce the window of exposure.
- Centralized, always-current inventory: Lansweeper maintains a single, continuously updated inventory of devices, software, users, and cloud infrastructure. The data is kept audit-ready and presented through dashboards, reports, and automatically generated network and virtualization diagrams.
- Integrations and automation: Asset intelligence feeds into ITSM, CMDB, and security tools through integrations with platforms such as ServiceNow, Jira Service Management, Freshservice, Splunk, and Microsoft Sentinel, so the data can drive action across the stack.
Limitations (as reported by users on G2):
- Interface learning curve: Some users report that the breadth of the interface can feel overwhelming for newcomers, making navigation and finding specific options less intuitive at first.
- Configuration friction: Reviewers note that locating and adjusting settings within the configuration area is not always straightforward.
- Coverage boundaries: Lansweeper focuses on discovery and inventory and does not natively handle tasks such as patch management or broad software deployment, so some teams pair it with additional tools.
- Pricing and roadmap concerns: Some users have mentioned price increases as their environments scaled, and a few noted the growing emphasis on the cloud product relative to the local installation.
3. Paessler PRTG

Paessler PRTG is an infrastructure monitoring tool that automatically discovers and then continuously monitors the devices, systems, traffic, and applications across a network. Its auto-discovery function scans a given IP address range, detects the devices within it, and automatically adds them to the monitoring environment. Monitoring is built around “sensors,” where each sensor tracks a single measured value such as a port’s traffic or a server’s CPU load. PRTG presents the resulting data in real-time maps, dashboards, and a device-tree view, and alerts teams before issues escalate. It is widely deployed, with the vendor citing more than 500,000 active installations, and it offers a free edition for up to 100 sensors.
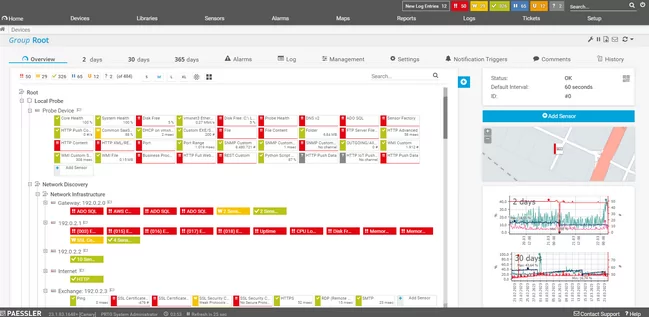
Source: Paessler
Key features include:
- Automatic network discovery: PRTG’s auto-discovery scans a defined IP address range, identifies the devices it finds, and incorporates them into the monitoring setup automatically. This reduces manual configuration when bringing a network under monitoring and helps keep the device list current as the environment changes.
- Sensor-based monitoring: Monitoring is organized around sensors, each tracking one metric such as bandwidth on a switch port, CPU load, or free disk space. PRTG ships with a large library of preconfigured sensors covering networks, servers, LAN devices, applications, databases, and cloud services, typically using several sensors per device.
- Broad protocol and technology support: The tool collects data using common technologies including SNMP, WMI, packet sniffing, flow protocols, and SSH, and it monitors agentlessly. It tracks endpoints such as servers, firewalls, routers, switches, and Windows and Linux systems across distributed locations.
- Maps, dashboards, and visualization: PRTG visualizes monitoring data through real-time network maps, custom dashboards, and a device-tree view of the full setup. Teams can build custom diagrams and views for network operations, availability, and management reporting to identify problems more quickly.
- Alerts and notifications: The platform sends customizable, centralized alerts by email, SMS, push notification, and more, with user-defined thresholds. This is intended to warn teams of congestion or failures before they cause downtime.
- Flexible access and extensibility: PRTG can be managed through its web interface or free iOS and Android apps, supports distributed monitoring of multiple networks, and can be extended through an HTTP API and custom sensors. It also offers customizable reporting in multiple formats.
Limitations (as reported by users on G2):
- Sensor-based licensing costs: Because each monitored metric counts as a separate sensor, users report that sensor counts — and therefore costs — can climb quickly in larger environments, prompting teams to be selective about what they monitor.
- Setup complexity at scale: Several reviewers note that initial configuration for complex infrastructures can feel overwhelming and that advanced customization requires deeper technical knowledge.
- Interface density: Some users describe the interface as feeling cluttered or dated, particularly for newcomers working through large volumes of information.
- Alert tuning: Managing the volume and variety of alerts can become complex as networks grow, requiring threshold tuning to reduce false positives.
4. Auvik
Auvik is a cloud-based network management platform that automatically discovers network devices, maps the topology, and monitors performance in real time. After an Auvik collector is installed, the platform discovers everything on the network with an IP address — switches, firewalls, routers, printers, and workstations — and draws a network map automatically, often within an hour. It then provides device-level monitoring, traffic analysis, and alerting, and automates network documentation. Auvik is aimed at corporate IT teams and managed service providers that need visibility across distributed networks, and it also offers separate server, endpoint, and SaaS management products.
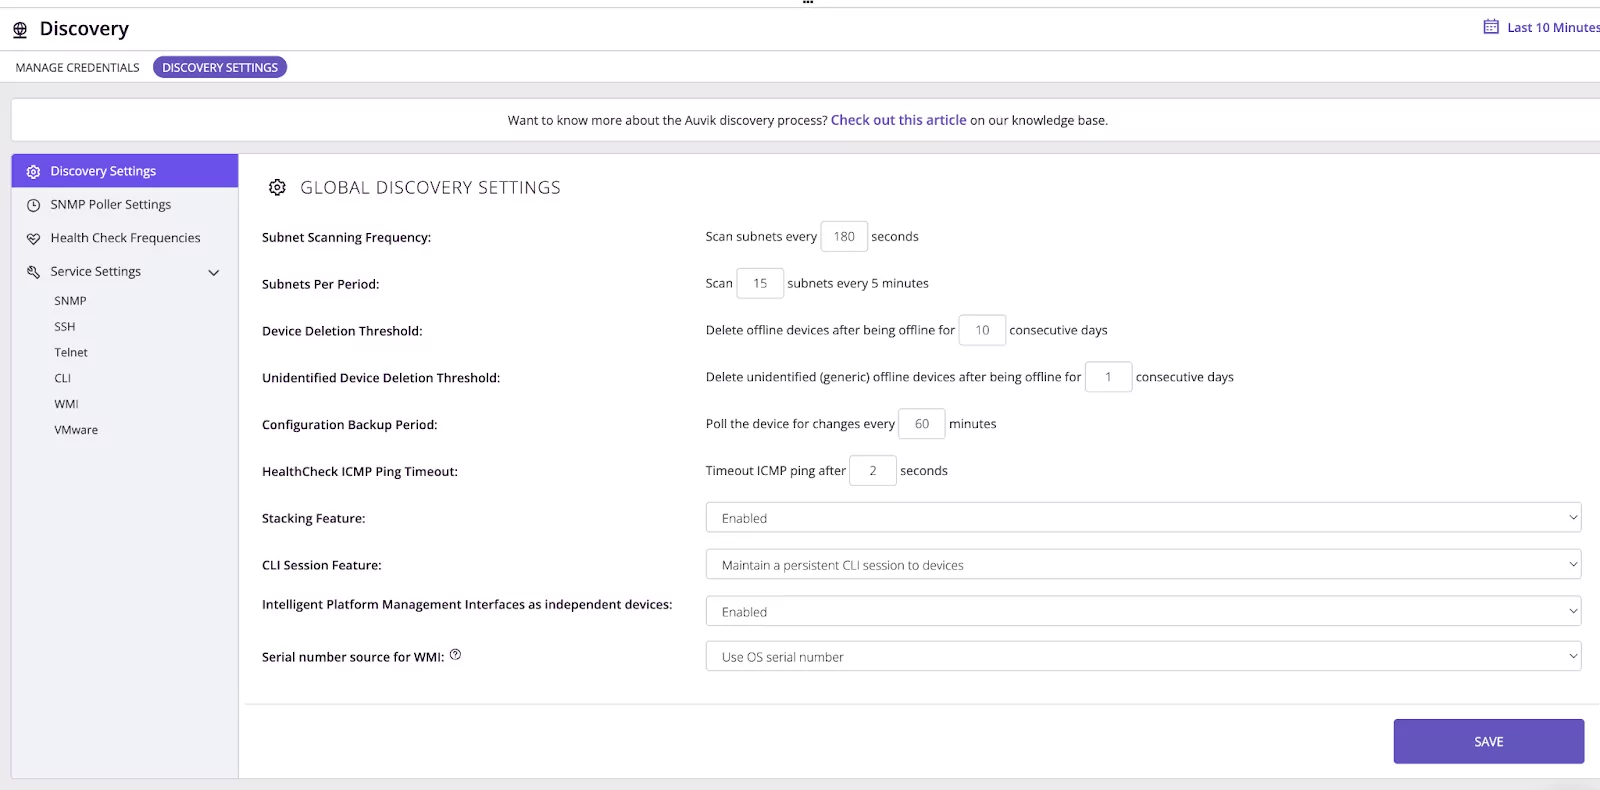
Source: Auvik
Key features include:
- Automated discovery and inventory: Once a collector is deployed, Auvik automatically identifies devices on the network and keeps an ongoing inventory without manual effort. It captures device details and keeps documentation current, replacing spreadsheets and manual wire tracing.
- Real-time topology mapping: Auvik builds a live network map showing Layer 1, 2, and 3 connections, which updates automatically as the network changes. Users can hover over any node to see details and drill into individual devices for traffic and performance information.
- Monitoring and troubleshooting: Each router, switch, and firewall gets its own dashboard with health, performance, logs, and configuration insights. The platform highlights bandwidth spikes and unusual activity to help teams find the root cause of issues faster.
- Preconfigured alerting: Auvik includes a library of more than 60 preconfigured alerts spanning informational to emergency severity, viewable directly on the live map. Alerts work out of the box and can be customized to fit a given environment.
- Network traffic analysis: Through NetFlow-based analysis, Auvik shows who is on the network, what they are doing, and where traffic is going, including for encrypted traffic. This supports faster diagnosis of performance bottlenecks.
- Configuration management: The platform automatically backs up device configurations and lets teams compare changes side by side, restrict changes to authorized admins, and keep a detailed history for audits and compliance.
Limitations (as reported by users on G2):
- Device-based pricing: Auvik bills based on billable devices such as routers, switches, and firewalls, and some users find this can become expensive in larger network environments.
- Alert noise: Reviewers note that the alerting system can be noisy out of the box and takes time to tune thresholds in order to reduce alert fatigue.
- Device identification accuracy: Some users report occasional device misidentification and alerts that continue to trigger for equipment that has been removed from production.
- Learning curve: A few reviewers describe the initial configuration as requiring effort and skill, especially when migrating from another platform.
IT Asset Management and Inventory Platforms
5. Asset Panda

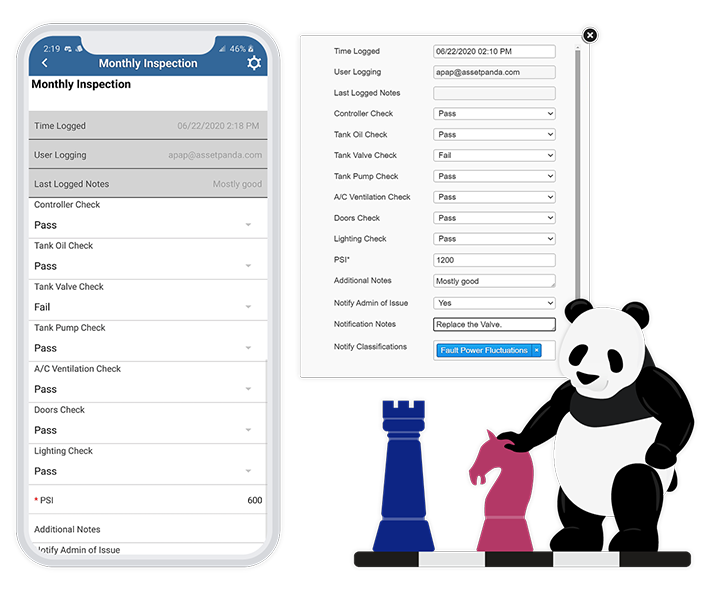
Asset Panda is a highly configurable, cloud-based asset tracking and management platform used to track the location, status, condition, and full lifecycle of both physical and digital assets. Rather than enforcing a fixed workflow, it lets organizations customize fields, workflows, and account structures to match the way they already work, across departments, locations, or clients. The platform pairs a web application with iOS and Android mobile apps that include built-in barcode and QR-code scanning and an offline mode. It is used across many industries to replace spreadsheets with a single, centralized source of asset data, and it adds AI-assisted capabilities through its Asset Panda Intelligence (Ursa) features.
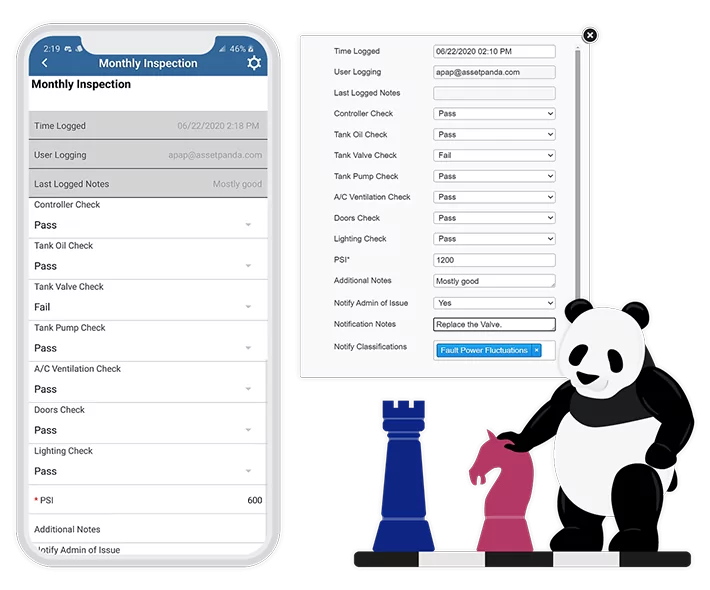
Source: Asset Panda
Key features include:
- Configurable, no-code platform: Asset Panda lets teams customize fields, workflows, and forms without code to fit their specific asset types and processes. Accounts can be organized by department, location, or client in a multi-account structure, with custom user permissions and user-specific views.
- Mobile app with barcode scanning: Native iOS and Android apps let users look up and update asset records in the field by scanning barcodes and QR codes with the device they already carry, removing the need for separate scanners. An offline mode allows work to continue without connectivity and sync later.
- Full lifecycle tracking: The platform tracks the status, location, and condition of assets and maintains a full lifecycle history, including assignment history, repairs, depreciation, and warranty information. This supports procurement-to-retirement reporting and forecasting.
- Reporting and dashboards: Asset Panda provides reporting with custom dashboards, scheduled reports delivered by email, and exports in CSV, XLS, and PDF formats. Global and faceted search help users find assets across the organization and filter parent-child relationships between collections.
- Maintenance, inspections, and contracts: Teams can schedule maintenance with notifications, build custom inspection checklists, manage repair tickets, capture digital signatures, and receive alerts when equipment or technology contracts are due to expire.
- Integrations and AI assistance: Asset Panda integrates with tools such as Microsoft Intune, Jamf Pro, Azure Active Directory, Google Workspace, and ConnectWise to keep data in sync. Its AI-assisted features include AI-powered column mapping for imports and AI-translated versions of the platform.
Limitations (as reported by users on G2):
- Asset-based pricing: Because pricing is based on the number of assets tracked rather than users, some reviewers note costs can climb for organizations managing large asset counts, and pricing details often require a custom quote.
- Advanced-feature learning curve: Setting up advanced capabilities such as API integrations and custom workflows can require technical know-how and time.
- Mobile offline constraints: Some users report that offline functionality on the mobile app is limited and that the app can be slow or experience occasional syncing issues in low-connectivity areas.
- Workflow friction: A few reviewers mention that certain reporting, export, or navigation workflows are not always as straightforward as they would like.
6. SysAid

SysAid is an IT service management (ITSM) platform with built-in IT asset management that automatically discovers and catalogs connected devices in real time. Its asset management is AI-first: SysAid continuously discovers the IT environment across hardware, software, cloud, and endpoints, and its Advanced Discovery Network — which the vendor notes is powered by Lansweeper and augmented with AI — extends discovery across IT, OT, IoT, and cloud. Asset data is tied directly into the service desk and a CMDB, so device information appears in tickets and configuration items are mapped to one another. SysAid deploys via agent-based and agentless methods and supports operating systems including Windows, Linux, Mac, and Unix.

Source: SysAid
Key features include:
- Real-time, AI-assisted discovery: SysAid discovers assets across hardware, software, cloud, and endpoints in real time, and uses AI agents that learn from discovery data, flag anomalies, and anticipate risks across IT, OT, IoT, and cloud systems. Its Advanced Discovery Network is powered by Lansweeper and amplified with AI.
- Inventory and network discovery: The platform automatically discovers network assets and their attributes to build a comprehensive view of hardware and software, with automatic updates to keep the data accurate. This underpins lifecycle management and audit readiness.
- CMDB: SysAid tracks configuration items, automatically imports data into a CMDB, and provides a view of how items in the IT network relate to one another, helping teams understand dependencies and impact.
- Software and patch management: Teams can manage installed software, track locations, and automate renewal reminders for compliance, and deploy patches to one or many machines according to customized policies, integrated with change management.
- Service desk integration: Asset and configuration data is embedded in tickets — including details such as screenshots — so agents have context for faster resolution, and AI agents can trace the asset source of incidents and requests.
- Remote support and AI agents: SysAid integrates Splashtop remote support so agents can resolve issues on any device from within a ticket, and offers prebuilt AI agents for tasks such as checking warranty expirations, managing Intune devices, and scanning for inactive or high-failure-rate devices.
Limitations (as reported by users on G2):
- Interface feel: Some users describe the interface as clunky or dated, with certain features buried in menus and navigation that can require extra clicks.
- Learning curve: Reviewers note that customization and initial setup can take time and training to master.
- Mobile experience: Several users report that the mobile app lacks the full feature set of the desktop version, leading many to prefer the desktop experience.
- Reporting depth: A few reviewers feel that internal and knowledge-base reporting is more basic than other parts of the product.
7. InvGate Asset Management

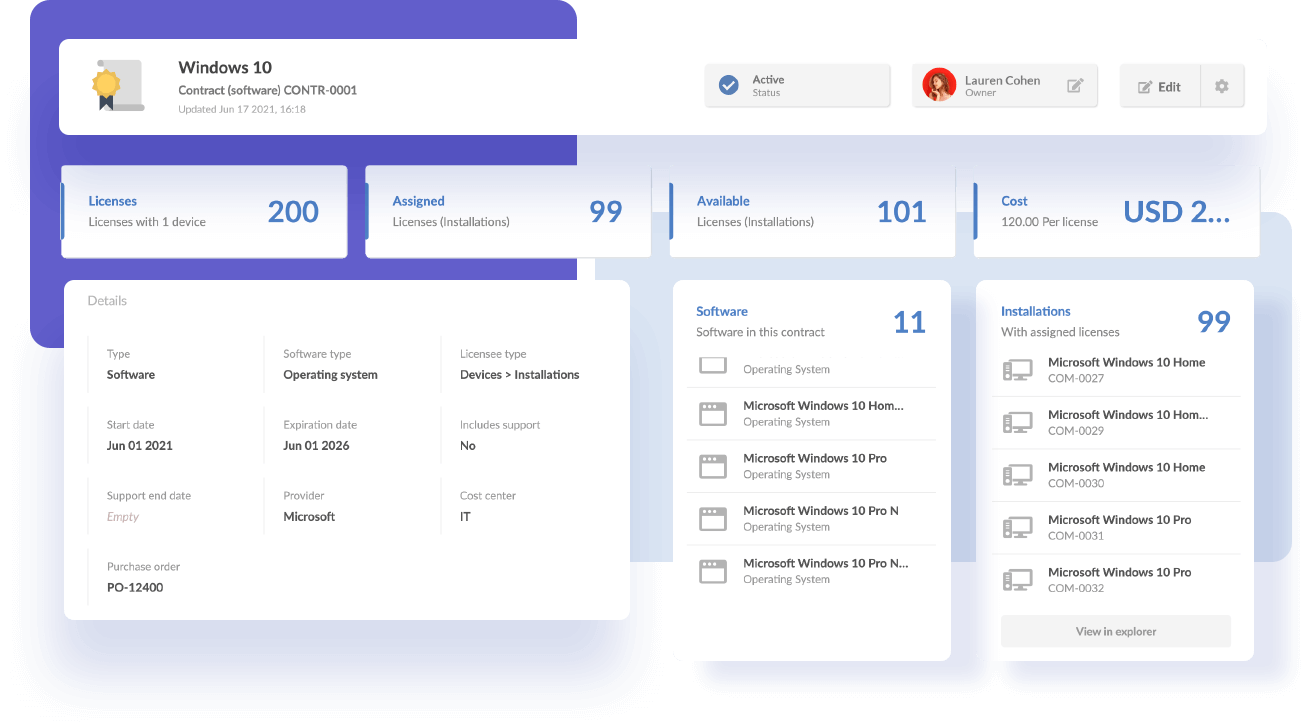
InvGate Asset Management — formerly known as InvGate Insight — is a no-code IT asset management solution, available in the cloud or on-premises, that automatically discovers and inventories hardware, software, virtual, and cloud assets across the IT environment. It maps the IT landscape using a discovery engine that draws on a lightweight agent, network scanning, integrations, and bulk import, then consolidates everything into a centralized inventory. The platform manages assets across their full lifecycle, from procurement to disposal, and builds a CMDB through automatic relationship discovery. Its AI engine, Atlas, surfaces end-of-life and version context and powers Smart Recommendations. InvGate Asset Management supports organizations ranging from a few hundred to a million assets.
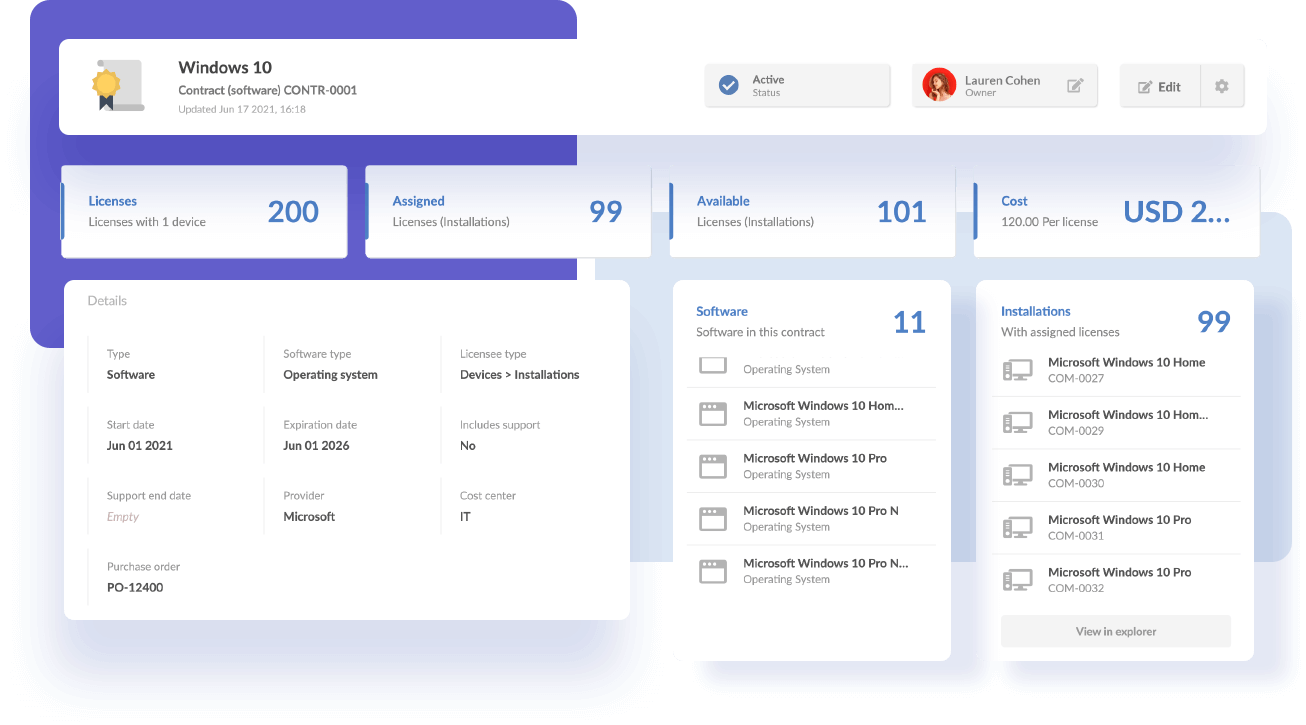
Source: InvGate
Key features include:
- Automated multi-source discovery: The discovery engine identifies hardware, devices, servers, containers, databases, and cloud services using a lightweight agent, network scanning, integrations, or bulk import. The InvGate Agent collects data from networked devices daily on Windows, Linux, and macOS, while the InvGate Proxy performs agentless discovery via SNMP, WMI, and SSH for network hardware such as printers and switches.
- Unified inventory of IP and non-IP devices: InvGate builds a unified inventory of network-connected assets, covering IP devices such as computers, mobile devices, and network equipment, as well as non-IP devices like monitors and peripherals, each tracked with its associated software and licenses.
- CMDB and dependency mapping: The platform accelerates CMDB creation with automatic relationship discovery and assisted mapping, letting teams visualize dependencies and understand impact across services with a continuously updated view of the infrastructure.
- Lifecycle, license, and compliance management: InvGate manages the asset lifecycle from procurement to disposal, including software license management, software metering, contract tracking, warranty and renewal alerts, and Health Rules that monitor compliance across the inventory.
- AI-driven insights with Atlas: Atlas, the product’s AI engine, centralizes end-of-life and end-of-support data and version status, while Smart Recommendations flags risky or outdated assets and suggests next actions such as update, replace, or reassign.
- Broad integrations and cloud coverage: The platform connects natively, without an agent, to AWS, Microsoft Azure, Google Cloud Platform, and VMware vCenter, and integrates with Intune, Jamf, Entra ID, Active Directory, ServiceNow, and Jira, plus an open API and support for more than 15 infrastructure-discovery protocols.
Limitations (as reported by users on Capterra):
- No native remote deployment or vulnerability scanning: Some users note the absence of built-in remote software deployment and native vulnerability checking, which can require complementary tools.
- Integration and API depth: Reviewers mention that API documentation and certain integrations could be more robust for smoother connections to other systems.
- Customization and reporting requests: A few users would like more customization for day-to-day management, more direct connections to external BI tools, and improvements to certain reports and charts.
- Advanced-view learning curve: Some reviewers note that the more advanced views take time to get used to.
SaaS, Cloud, and External Asset Discovery
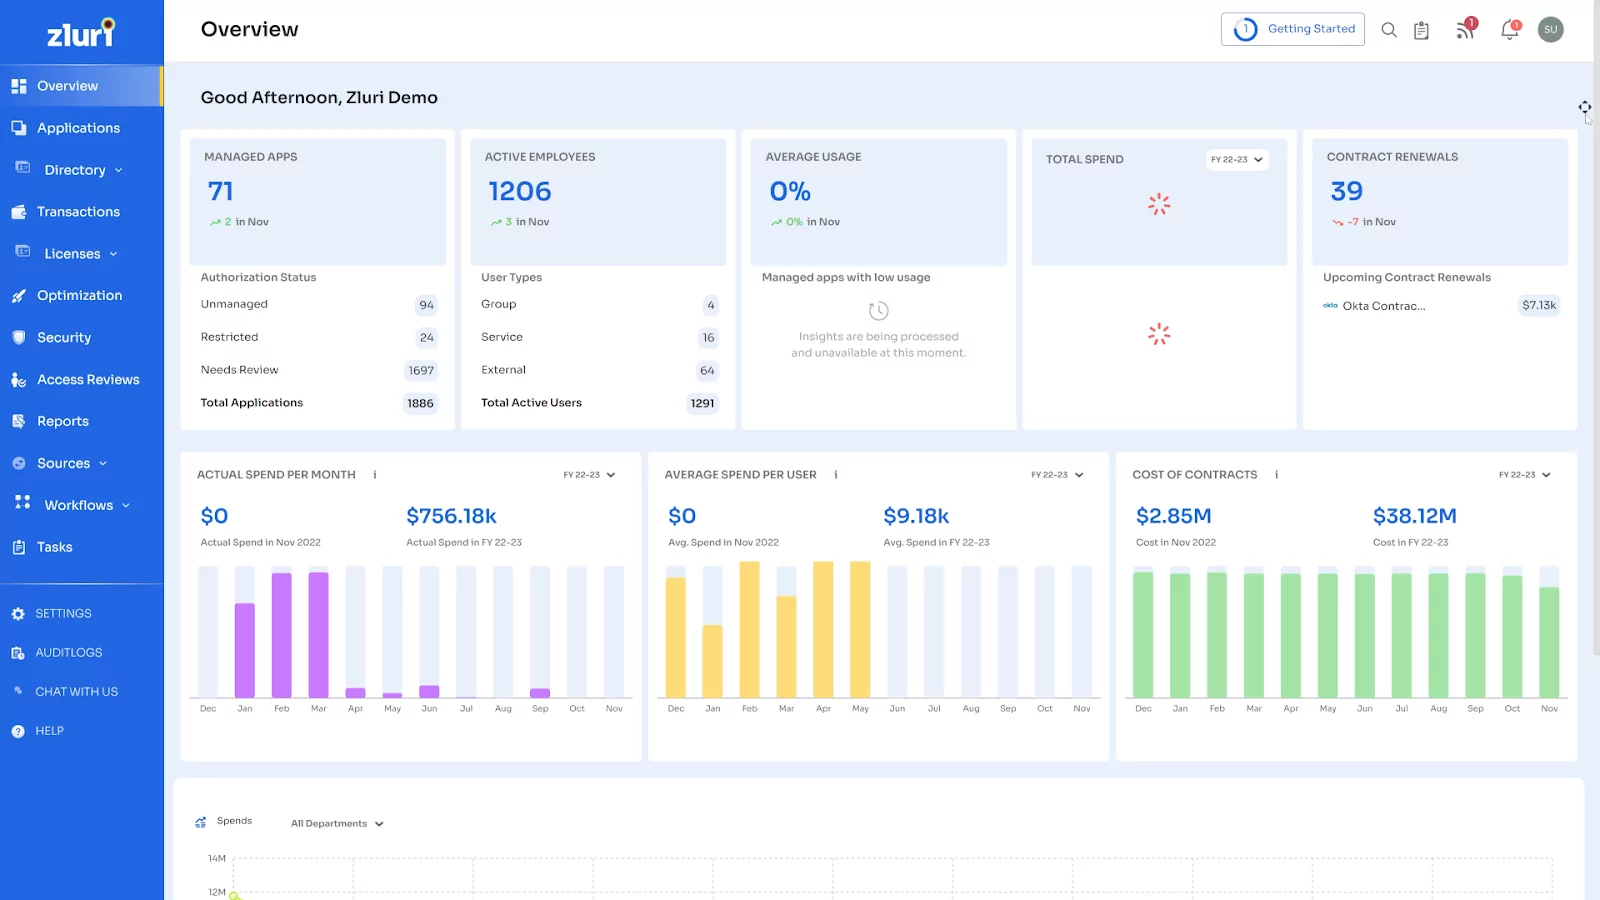
8. Zluri
Zluri is a SaaS management platform that gives IT teams visibility into and control over their organization’s software and AI applications. Using a patented discovery engine, Zluri discovers every application in the environment — sanctioned, unmanaged, and shadow IT — and creates a single source of truth enriched with data on users, activity, spend, roles, and licenses. It draws on 300+ direct API integrations, a native iPaaS engine, and SDKs to deliver visibility across cloud and hybrid environments. Beyond discovery, Zluri optimizes software spend, manages contracts and renewals, and extends governance to generative AI apps. It is part of a broader platform that also includes identity governance and access management.
Source: Zluri
Key features include:
- Application discovery and 360° visibility: Zluri’s patented discovery engine uncovers every app across the organization and classifies them as managed, unmanaged, or shadow IT, drawing on a catalog of more than 239,000 apps with auto-classification and enriched metadata. This creates a single source of truth for SaaS and AI applications.
- Shadow IT detection: The platform continuously detects unauthorized SaaS applications as they appear and can instantly alert admins and users when restricted apps are accessed, helping mitigate the security risks of unsanctioned tools.
- Generative AI app governance: Zluri provides visibility into generative AI apps such as ChatGPT and others across the organization, helping identify and mitigate shadow AI risks and enforce policies so that only authorized users access approved AI apps.
- License and spend optimization: Using user-activity insights, Zluri identifies unused or underused licenses and redundant apps and can automatically reclaim or downgrade licenses based on usage thresholds, with smart cost recommendations to reduce software spend.
- Contract and renewal management: The platform tracks contracts, renewals, and vendor details in one place, sends renewal alerts to prevent missed deadlines, and helps forecast future license needs to support budgeting and vendor negotiations.
- Broad integration framework: Zluri offers 300+ direct API integrations alongside a native iPaaS engine and SDKs, consolidating data from many sources into a unified view of the application stack across cloud and hybrid environments.
Limitations (as reported by users on G2):
- Setup and integration time: Some users report that initial setup and connecting multiple tools can be time-consuming, and that certain integrations need extra setup or validation for fully accurate usage data.
- Integration coverage gaps: Reviewers note that some needed integrations may still be in development, so teams whose stack falls outside supported connectors can encounter gaps.
- Dashboard refresh lag: A few users mention that some analytics dashboards take time to update, which can delay real-time insights in large organizations.
- Agent scope: Some reviewers point out that the desktop agent captures desktop applications only, separate from the browser extension.
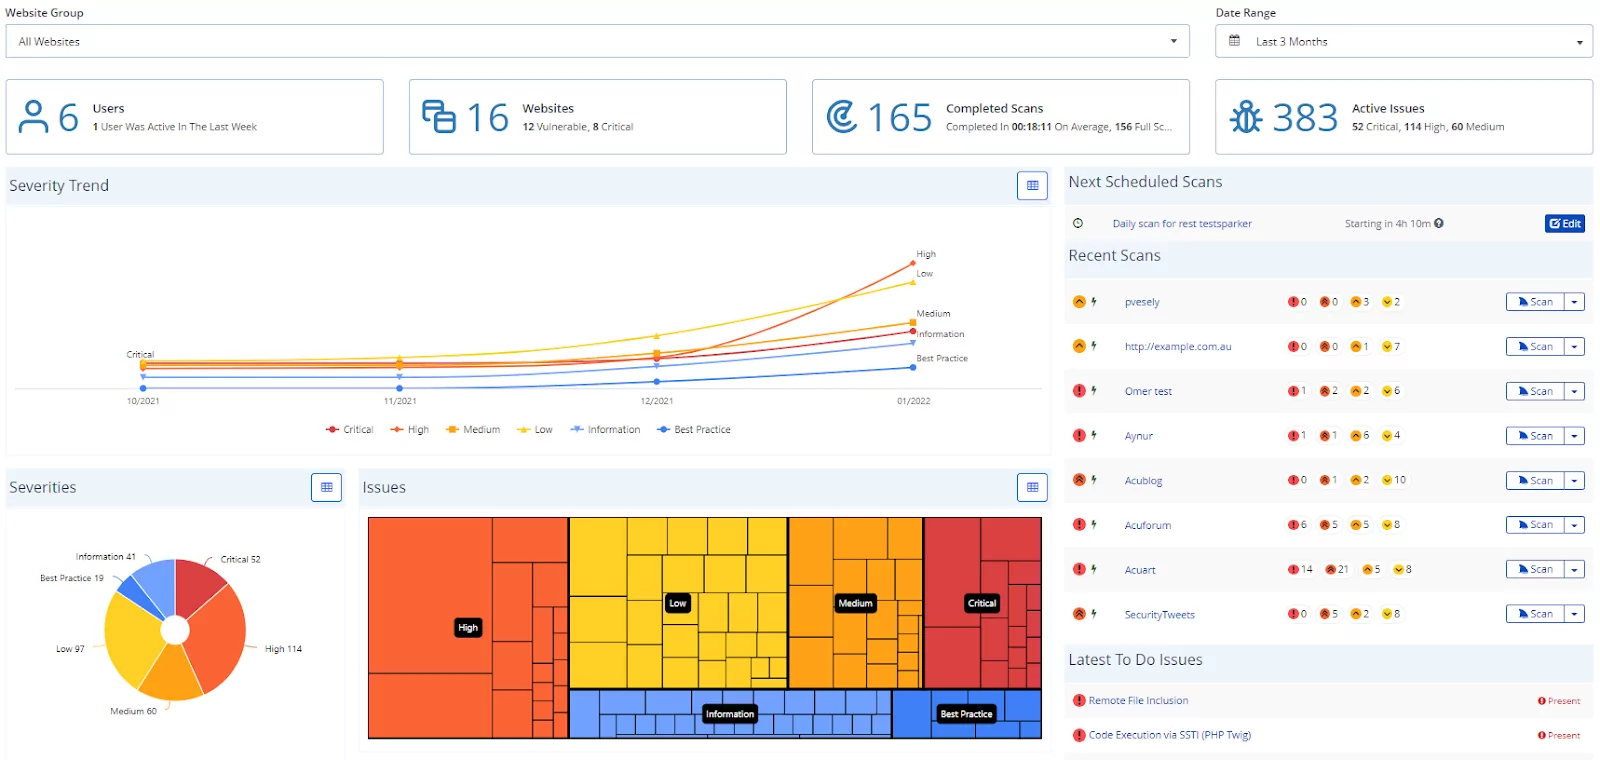
9. Invicti
Invicti — which brings together the former Netsparker and Acunetix products — is an application security platform whose discovery-relevant capabilities help organizations find and test their internet-facing web applications and APIs. Through attack surface management, it identifies exposed applications and endpoints, and its API discovery uncovers documented and undocumented (shadow) APIs so they can be tested. At its core is a dynamic application security testing (DAST) engine that uses proof-based scanning to validate exploitable vulnerabilities, which the vendor cites at 99.98% accuracy. Invicti also unifies findings across scanners through application security posture management (ASPM). It is aimed at enterprise security and development teams and serves more than 3,600 organizations.
Source: Invicti
Key features include:
- Web attack-surface discovery: Invicti’s attack surface management identifies an organization’s exposed applications and endpoints, helping teams find web-facing assets across their environment so they can be brought under security testing.
- API discovery and testing: The platform automatically discovers APIs — including undocumented or shadow APIs — and tests REST, SOAP, and GraphQL endpoints with the same depth as web apps, helping uncover hidden parts of the attack surface.
- Proof-based DAST scanning: Invicti’s DAST engine tests running applications the way an attacker would and automatically attempts to safely confirm whether a detected vulnerability is exploitable, attaching proof. The vendor cites 99.98% scanning accuracy, which reduces time spent triaging false positives.
- Vulnerability correlation and ASPM: The platform consolidates findings from its own and third-party security tools, correlates and deduplicates them into a single prioritized risk view, and applies threat intelligence to adjust risk scores, helping teams focus on real, runtime-verified issues.
- CI/CD integration and automation: Invicti orchestrates scans across CI/CD pipelines via a CLI, triggers scans and escalations automatically, and offers two-way syncing with tools such as Jira, GitHub, and Azure Boards to keep issues current until resolved.
- Reporting and broader coverage: It generates dashboards and compliance reports for different stakeholders, tracks remediation metrics such as time-to-fix, and extends to SAST, SCA, container, IaC, and secrets scanning for organizations running larger application security programs.
Limitations (as reported by users on G2):
- Configuration complexity: Some users find the settings and configuration options overwhelming at first and note that complex authentication flows, such as multi-step SSO, can require extensive manual configuration.
- Scan performance at scale: Reviewers report that running concurrent scans across a large application portfolio can lengthen scan times and create bottlenecks in fast-moving deployment cycles.
- Occasional false positives: Without careful tuning, the scanner can sometimes struggle with context and surface findings that require manual triage.
- Target-based licensing: A few users note that licensing tied to URLs or targets can become costly and restrictive when scanning many domains.
10. Intruder
![]()
Intruder is a cloud-based attack surface management and vulnerability scanning platform that continuously monitors an organization’s internet-facing assets to discover unknown assets and surface exposures. Its attack surface management discovers assets across the organization — subdomains, login pages, APIs, and exposed services — and can connect to AWS, Google Cloud, Cloudflare, and Azure accounts to automatically begin scanning when new services are spun up. It combines multiple scanning engines and continuously rescans when the attack surface changes or a new threat emerges. Intruder is aimed at lean security teams and serves more than 3,000 organizations.
Key features include:
- External asset discovery: Intruder discovers assets across the organization, including subdomains, login pages, APIs, and exposed services, and automatically adds new cloud assets by connecting to AWS, Google Cloud, Cloudflare, and Azure accounts, giving visibility into the true attack surface.
- Continuous attack-surface monitoring: The platform lets teams search across their attack surface to see what is exposed, find open ports and services, and monitor for changes, triggering scans automatically when something changes.
- Exposure detection: Intruder highlights risky issues such as exposed admin panels, publicly facing databases, misconfigurations, and expiring certificates, customizing output from multiple scanning engines to surface actionable results rather than raw noise.
- Proactive and reactive scanning: Through Emerging Threat Scans and adaptive scanning, Intruder rescans the attack surface whenever it changes or when a new threat appears in the wild, helping teams respond quickly to the changing threat landscape.
- Cloud asset visibility: For organizations running heavily in the cloud or frequently spinning up VMs and containers, Intruder consolidates visibility of internet-exposed cloud assets in one place to make attack-surface management more manageable.
- Vulnerability management and integrations: Beyond discovery, the platform prioritizes issues by risk, provides remediation guidance, and connects to workflow and compliance tools, with capabilities spanning external, internal, cloud, web app, and API scanning.
Limitations (as reported by users on G2):
- Pricing changes and license model: Some users note that pricing has increased and that the split between infrastructure and application licenses can be confusing to understand at first.
- Coverage gaps: Reviewers mention that the scanner does not catch every vulnerability and that some findings can be false positives, which can blur the line between lower-risk and critical issues.
- Target management constraints: A few users point to a lock period when moving authentication domain targets, which limits how quickly they can switch a target.
- Reporting and discovery tiers: Some reviewers would like more report customization, and broader asset discovery is concentrated in higher tiers or available via cloud connectors.
Conclusion
Asset discovery tools are essential for maintaining an accurate and comprehensive inventory of an organization’s IT assets. They automate the discovery process, improve security by identifying unauthorized devices, and ensure compliance with regulatory standards. By providing real-time visibility and detailed insights into asset configurations and usage patterns, these tools enable better management and optimization of IT resources.
Learn more about Faddom for asset discovery or start a free trial to the right!


