
What Are Network Discovery Tools?
Network discovery tools are software utilities used to automatically detect devices, systems, and services across a network. They collect data about all connected assets—including routers, switches, servers, endpoints, and IoT devices—by using various protocols such as SNMP, ICMP, and ARP.
These tools help administrators maintain visibility into their networks. They provide a real-time view of what is connected, how those assets are configured, and how they communicate. This is crucial for security audits, compliance, troubleshooting, and network management.
Editor’s note: Updated information for all network discovery tools to reflect features and capabilities in 2026, and added one new tool.
Core Functions of Network Discovery Tools
Device Identification
Device identification is the foundation of network discovery. Tools typically start by scanning a defined IP address range using ping sweeps or ARP requests to detect live hosts. Once a device responds, the tool attempts to classify it by querying attributes like MAC address, hostname, operating system, and hardware type using SNMP, NetBIOS, or other available protocols.
Tools also use fingerprinting techniques to infer device types and roles (e.g., printer, router, mobile phone). This process helps identify unauthorized devices or rogue endpoints that may pose a security risk. By maintaining an accurate inventory of devices, administrators can ensure network policies are enforced and reduce the risk of shadow IT.
Service Detection
Service detection involves identifying the software services and applications running on discovered devices. Tools perform port scanning to check for open TCP/UDP ports and then use banner grabbing or protocol-specific handshakes to gather information about the services running on those ports.
For example, an open port 80 might indicate a web server, and the banner might reveal it’s running Apache version 2.4. This data helps security teams assess vulnerabilities, determine if outdated software is in use, and confirm that only intended services are active. In managed environments, this also supports compliance with internal policies and external regulations.
Topology Mapping
Topology mapping gives a visual and logical view of how devices connect and interact within the network. Tools analyze routing tables, MAC address tables, and SNMP data to map physical and logical paths between nodes. They can identify layer 2 relationships (such as switch-port connections) and layer 3 paths (like routing between subnets).
Accurate topology maps are critical for understanding network segmentation, traffic bottlenecks, and interdependencies. They allow teams to quickly locate issues during outages, plan for capacity and redundancy, and implement network segmentation or zero-trust strategies. Some tools also support real-time mapping, automatically updating diagrams as the network changes.
Inventory Management
Inventory management consolidates all discovered data into a structured, searchable database. This inventory typically includes device types, hardware specifications, operating systems, firmware versions, IP and MAC addresses, installed software, and patch levels. Some tools integrate with CMDBs (configuration management databases) or IT asset management systems.
Automated inventory ensures accuracy and consistency, eliminating manual record-keeping errors. It also supports patch management by identifying devices that are missing critical updates. For organizations subject to audits or compliance checks (e.g., PCI DSS, HIPAA), maintaining a current inventory is crucial for demonstrating control over IT assets.
Benefits of Implementing Network Discovery Tools
There are several reasons to use dedicated discovery tools to keep track of corporate networks.
Enhanced Visibility
Network discovery tools automatically scan and catalog every device and service on the network, offering a real-time inventory. This includes endpoints, infrastructure devices, virtual machines, cloud services, and IoT components. Administrators gain a single source of truth for understanding what exists within the network environment.
With continuous scanning and updates, visibility extends to newly added or relocated devices. This reduces blind spots and supports proactive management, helping teams better plan for growth, identify underutilized assets, and validate architectural changes.
Improved Security
One of the most critical benefits of network discovery is early detection of unauthorized devices that could pose a threat. The tool can flag unknown or unmanaged endpoints, devices outside of policy, or hardware that bypasses formal procurement channels (i.e., shadow IT).
Integrating discovery tools with a security information and event management (SIEM) system enables real-time alerts when anomalies occur. This proactive approach helps prevent data breaches, lateral movement by attackers, and non-compliant behavior by internal users. It also ensures that only approved and patched devices are allowed network access.
Efficient Troubleshooting
When network issues arise, discovery tools accelerate root cause analysis by providing up-to-date information on device status, connectivity, and relationships. Engineers can quickly determine what’s down, what it’s connected to, and what might be affected.
For example, if a switch port goes offline, topology maps and inventory data help identify the impacted hosts and services. This speeds up diagnosis and resolution, minimizing downtime. The historical data captured by these tools also aids in identifying recurring issues, spotting trends, and refining long-term maintenance strategies.
Regulatory Compliance
Compliance frameworks such as PCI DSS, HIPAA, ISO 27001, and GDPR require organizations to maintain up-to-date inventories of all systems handling sensitive data. Network discovery tools automate this task, ensuring completeness and reducing human error.
They provide audit-ready reports on hardware, software versions, and configuration baselines. This simplifies compliance reviews and reduces the risk of fines or corrective actions due to incomplete or outdated documentation. Ongoing discovery also supports change management by logging when new devices appear or configurations shift, enabling traceability.
Network Discovery Tools vs. Other IT Infrastructure Tools
While network discovery tools focus on identifying and mapping devices, services, and relationships across a network, they are often confused with related tools that serve different—though sometimes overlapping—purposes.
- Network Monitoring Tools: These tools track the performance and health of devices already known to the network. While discovery tools identify what exists, monitoring tools observe behavior—measuring metrics like CPU usage, latency, bandwidth, and uptime. Some platforms combine both capabilities, but discovery is typically the starting point.
- Vulnerability Scanners: Tools like Nessus or OpenVAS scan discovered assets for known security flaws. They rely on the output of network discovery to determine what to scan. Unlike discovery tools, they don’t detect devices on their own; instead, they assess risks on assets already identified.
- Asset Management Tools: IT asset management (ITAM) platforms maintain records of hardware and software lifecycles, procurement, and ownership. They often ingest data from discovery tools to ensure accurate asset inventories but focus more on business-related metadata than technical mapping.
- Configuration Management Tools: These tools, such as Ansible or Puppet, manage and enforce system configurations. While they might perform basic discovery for target hosts, their primary role is change deployment, not asset detection.
In short, network discovery tools establish the baseline visibility that other tools rely on. They are foundational to broader IT operations, enabling functions such as monitoring, security assessment, configuration control, and asset lifecycle management.
Notable Commercial Network Discovery Tools
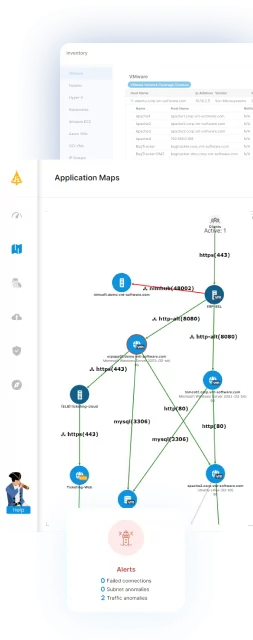
1. Faddom

Faddom is an agentless application dependency mapping platform that provides real-time discovery of devices, services, and application flows across hybrid IT environments. It enables organizations to automatically map infrastructure and dependencies without using agents or credentials, making it ideal for maintaining accurate inventories, understanding network topology, and detecting security risks.
Key features include:
-
- Agentless, real-time discovery: Automatically maps on-premises and cloud assets with no agents or credentials, nd can be deployed in under 60 minutes.
Topology mapping: Visualizes network and application dependencies across subnets, VLANs, and cloud environments to improve visibility and troubleshooting.
- Agentless, real-time discovery: Automatically maps on-premises and cloud assets with no agents or credentials, nd can be deployed in under 60 minutes.
-
- Vulnerability detection: Identifies unpatched systems, known CVEs, expired SSL certificates, and unauthorized software.
-
- Change tracking: Detects software changes and highlights end-of-life or unsupported software in the environment.
-
- Risk prioritization: Analyzes traffic patterns to flag abnormal behavior, lateral movement paths, and external exposure risks.
-
- Integrations: Connects with CMDBs, ITSM, and SIEM platforms such as ServiceNow to enrich asset data and support compliance workflows.

2. SolarWinds Network Performance Monitor

SolarWinds Network Performance Monitor (NPM) is a network monitoring platform to provide visibility into network performance across hybrid and multi-vendor environments. It continuously monitors network availability and performance metrics to help identify issues affecting infrastructure. The platform also provides mapping, analytics, and alerting capabilities that support troubleshooting and performance analysis across network devices and services.
Key features include:
- Network performance monitoring: Continuously tracks network availability and performance metrics to detect operational issues and maintain uptime.
- Hybrid network visibility: Provides monitoring across on-premises and hybrid IT environments, supporting infrastructure from multiple vendors.
- NetPath visualization: Displays end-to-end network paths to help analyze connectivity and identify root causes of performance issues.
- Intelligent network mapping: Automatically generates maps of network devices and connections to improve visibility and management.
- PerfStack analytics: Enables analysis and correlation of network performance metrics across devices and time periods.

Source: SolarWinds
3. Auvik
![]()
Auvik is a cloud-based network management platform to provide visibility into network devices, connections, and performance metrics. It automatically discovers infrastructure components and maintains an updated view of the network as changes occur. The platform supports monitoring and management tasks through a browser-based interface and integrates with common IT management tools.
Key features include:
- Real-time monitoring: Provides live visibility into network metrics and activity to help identify operational issues as they occur.
- Automated topology mapping: Automatically updates network maps as devices and connections change.
- Cloud-based deployment: Uses a cloud-hosted platform that can be deployed quickly with minimal setup.
- Multi-vendor device support: Supports monitoring of devices from hundreds of network hardware vendors.
- Integrated network management tools: Combines mapping, traffic analysis, configuration management, and inventory features within a single platform.

Source: Auvik
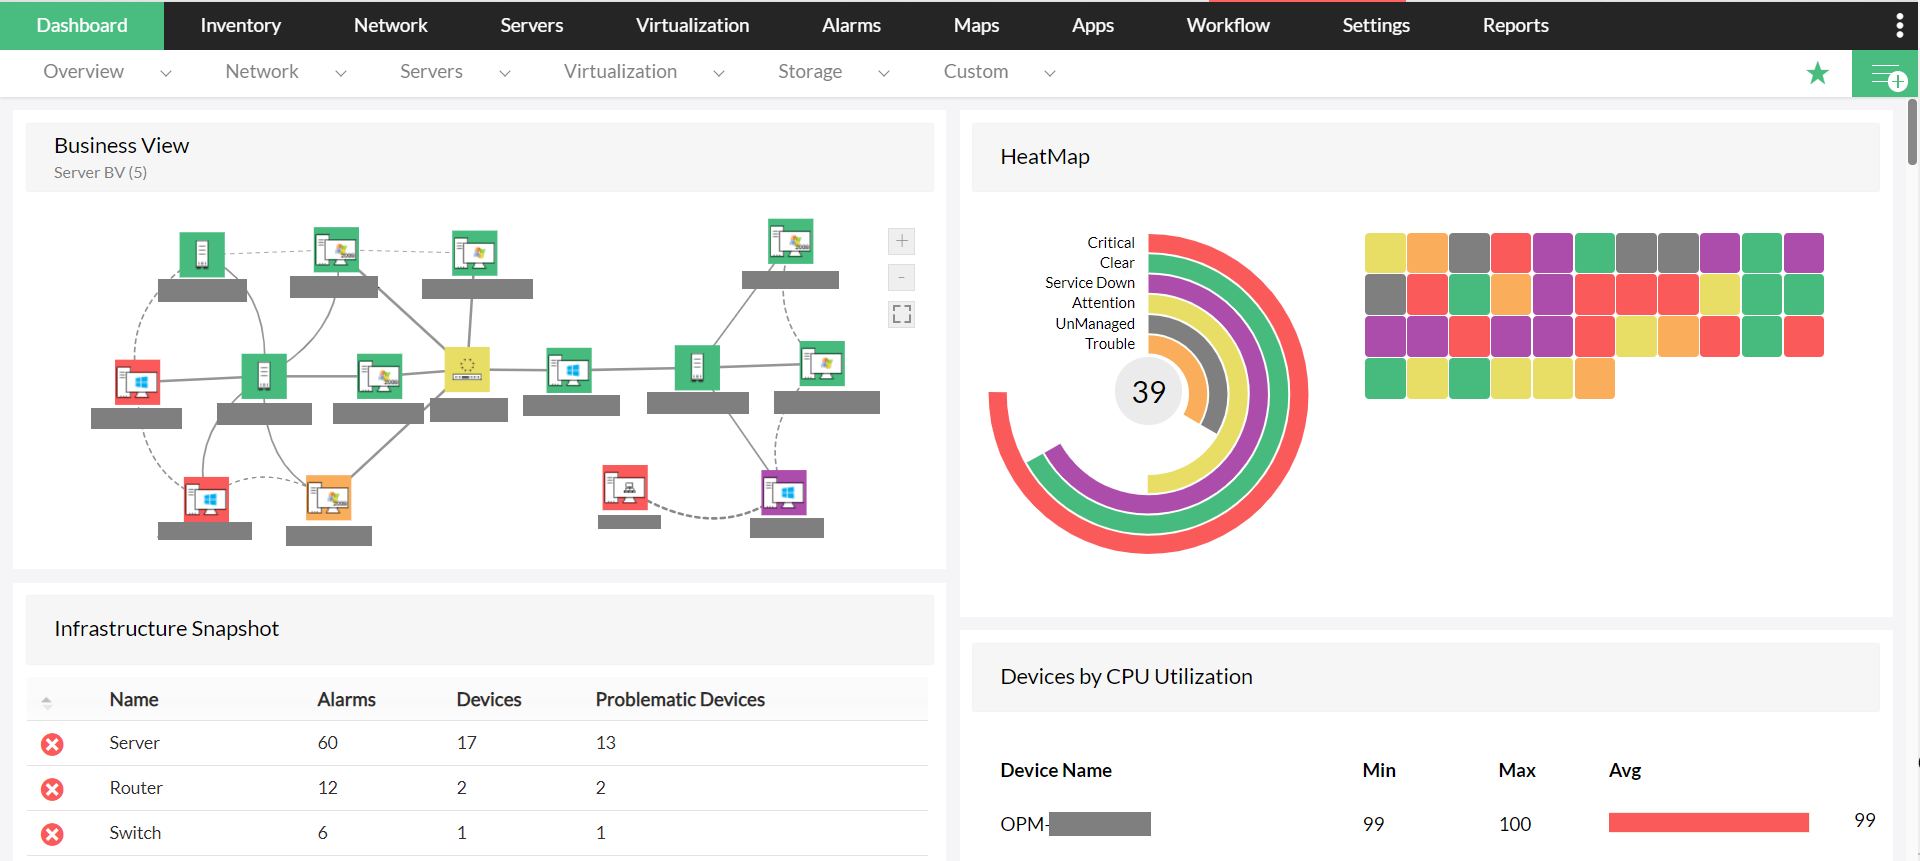
4. ManageEngine OpManager

ManageEngine OpManager is a network monitoring platform that provides visibility into the performance and health of IT infrastructure components. It monitors routers, switches, firewalls, servers, virtual machines, storage systems, and wireless devices. The platform includes visualization, alerting, and analytics capabilities that help administrators identify faults and troubleshoot network issues.
Key features include:
- Network device monitoring: Tracks the health, availability, and performance of IP-based devices such as routers, switches, and firewalls.
- Server and virtualization monitoring: Monitors physical servers and virtual infrastructure platforms including VMware, Hyper-V, Citrix Xen, and Nutanix environments.
- Wireless network monitoring: Collects performance metrics from wireless access points, routers, and Wi-Fi networks.
- WAN monitoring: Uses Cisco IPSLA technology to monitor WAN link performance, including latency, jitter, and availability.
- Storage monitoring: Tracks capacity and performance metrics for storage arrays, fiber channel switches, and tape libraries.

Source: ManageEngine
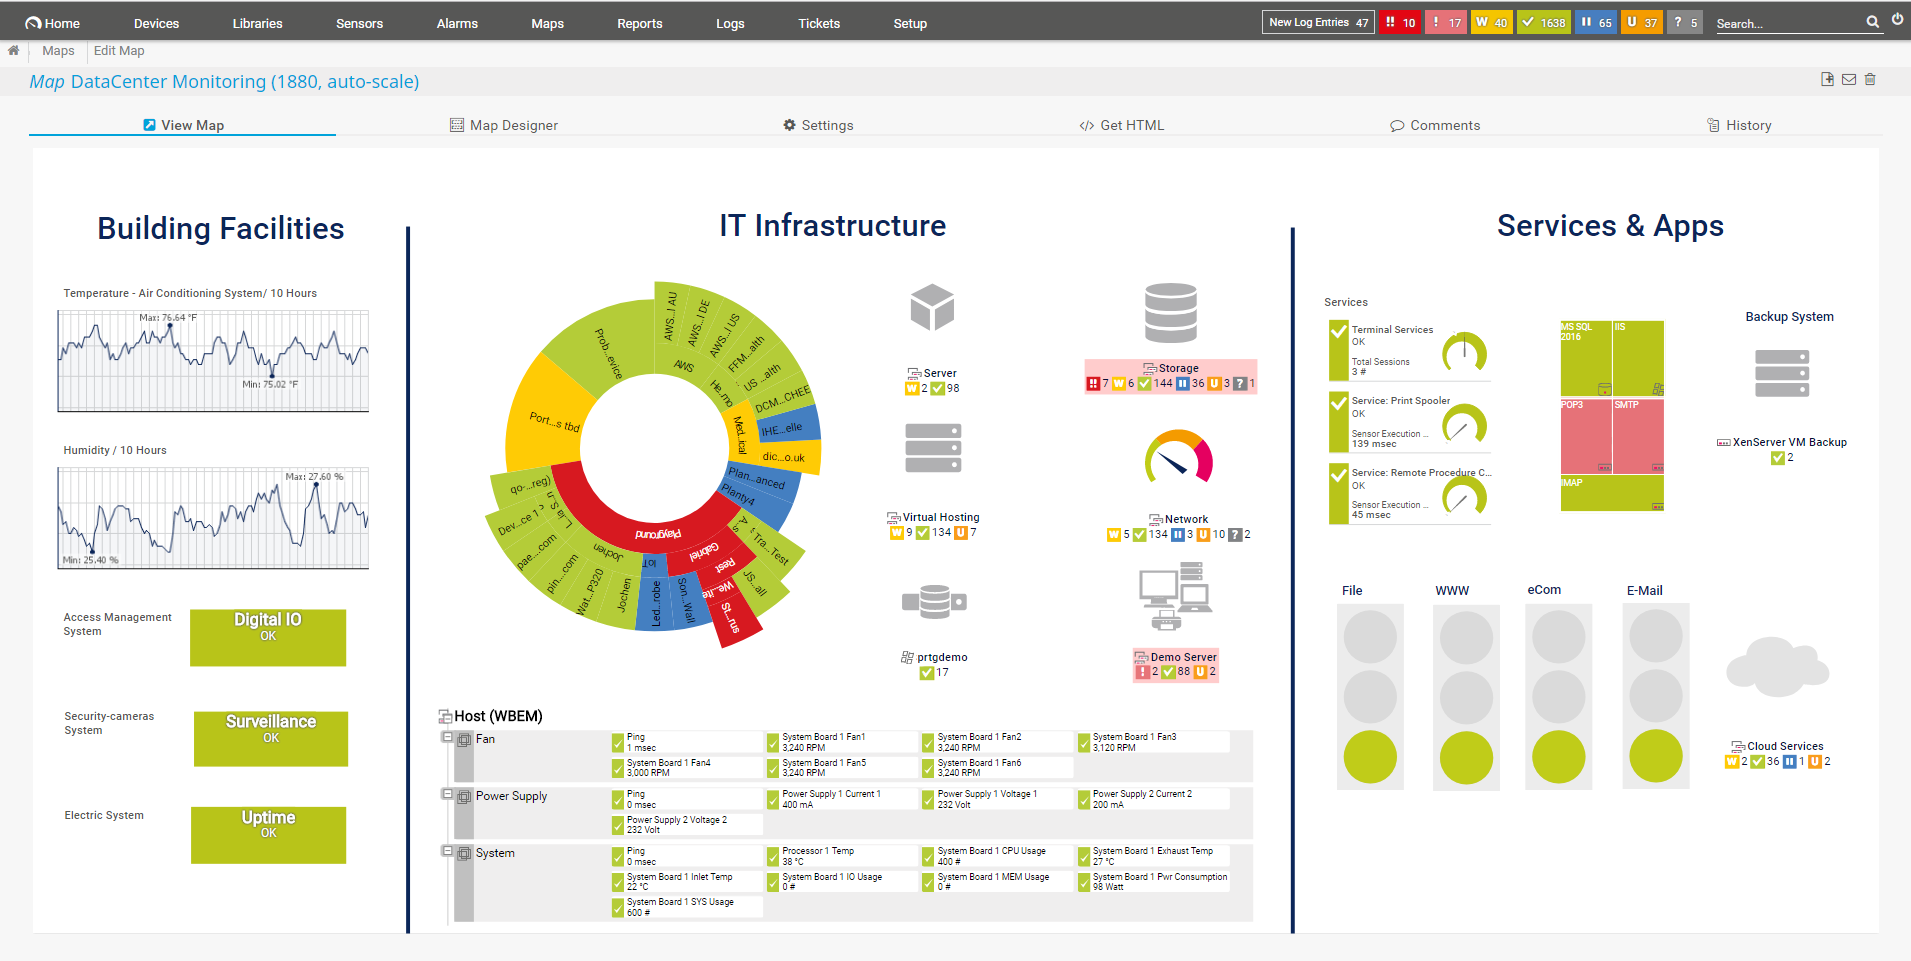
5. Paessler PRTG Network Monitor

Paessler PRTG Network Monitor is an infrastructure monitoring platform used to observe networks, devices, servers, applications, and cloud services from a centralized interface. It uses a system of sensors to collect performance data and automatically discovers devices on the network. The platform supports multiple monitoring methods and provides alerts when abnormal conditions occur.
Key features include:
- All-in-one monitoring: Monitors network devices, servers, applications, virtual environments, and cloud services within a unified platform.
- Automatic network discovery: Automatically detects devices on the network and assigns appropriate monitoring sensors.
- Multiple monitoring protocols: Supports SNMP, packet sniffing, and flow-based monitoring to collect network usage data.
- Preconfigured monitoring sensors: Includes built-in sensor templates for monitoring common device types and services.
- Centralized management console: Provides a single interface for viewing network status, performance metrics, and alerts.

Source: Paessler
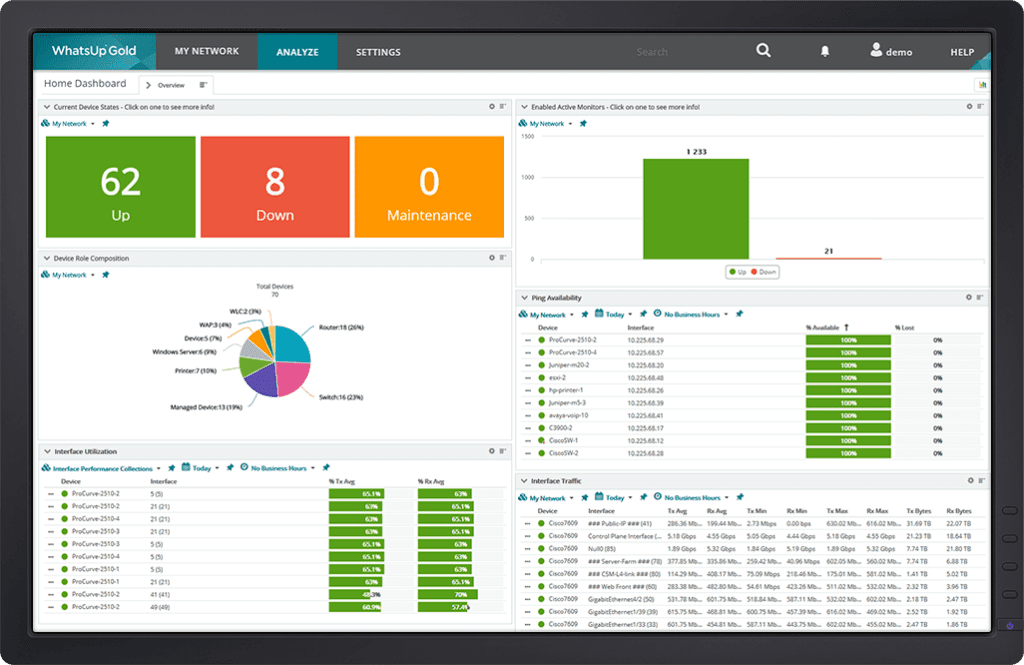
6. WhatsUp Gold Network Monitoring Software

WhatsUp Gold is an infrastructure monitoring platform to provide visibility into network devices, servers, applications, and traffic flows. It supports monitoring across on-premises, cloud, and hybrid environments. The platform includes automated discovery, mapping, alerting, and analytics tools that help administrators analyze network performance and troubleshoot operational issues.
Key features include:
- Unified infrastructure monitoring: Monitors servers, applications, network devices, wireless systems, and cloud resources from a centralized platform.
- Automated device discovery: Identifies devices and their relationships through Layer 2 and Layer 3 discovery processes.
- Dynamic network mapping: Generates maps that display network connections and dependencies between devices.
- Real-time monitoring and alerts: Tracks performance metrics and sends alerts when thresholds or anomalies are detected.
- Protocol-based monitoring: Uses protocols such as Ping, SNMP, WMI, and SSH to monitor device status and performance.

Source: WhatsUp Gold
7. AssetLoom

AssetLoom is an IT asset management platform that provides centralized tracking and management of hardware, software licenses, and IT equipment. It helps organizations organize asset inventories, monitor lifecycle stages, and automate operational tasks related to asset usage and maintenance. The platform also supports integrations and reporting features that help teams maintain visibility into asset availability, usage, and lifecycle status.
Key features include:
- Asset lifecycle management: Tracks assets from acquisition through usage and retirement, providing visibility across all lifecycle stages.
- Centralized asset tracking: Maintains a structured inventory of hardware, software licenses, accessories, and other IT resources.
- Automation and alerts: Automates operational tasks such as maintenance notifications and alerts for expiring licenses or inventory changes.
- Asset booking and allocation: Supports check-in and check-out processes and allows users to reserve shared assets.
- Reporting and analytics: Provides reporting tools and dashboards that help analyze asset usage and inventory status.
Free and Open-Source Network Discovery Tools
While commercial network discovery tools provide advanced capabilities, there are also several free and open source tools that are widely used to diagnose and troubleshoot network issues.
8. Nmap

License: Custom license (based on GPL-2.0)
Repo: https://github.com/nmap/nmap
GitHub stars: 11K+
Contributors: <10
Nmap is a network scanning tool used to discover hosts and services on a network. It sends crafted packets to target systems and analyzes the responses to determine which hosts are reachable, which ports are open, and what services may be running. The tool supports multiple scanning methods and includes additional utilities such as Ncat, Ndiff, and Nping. Users can operate Nmap from the command line or through the Zenmap graphical interface.
Key features include:
- Host discovery: Identifies active devices on a network before performing deeper scans.
- Port scanning methods: Supports multiple techniques such as TCP SYN scanning to determine open ports.
- Service and version detection: Probes open ports to identify running services and their versions.
- Operating system detection: Uses packet analysis and fingerprinting to infer the operating system of a target host.
- Scriptable scanning engine: Supports automation and extended functionality through the Nmap scripting engine (NSE).
9. ZMap

License: Apache-2.0
Repo: https://github.com/zmap/zmap
GitHub stars: 5K+
Contributors: 90+
ZMap is a stateless network scanner for high-speed Internet-wide measurements. It sends single packets to large numbers of IP addresses without maintaining connection state, allowing it to scan the public IPv4 address space quickly. The tool is commonly used for large-scale network surveys, such as identifying hosts that respond on a specific port or protocol.
Key features include:
- High-speed Internet scanning: Can scan the entire public IPv4 address space on a single port in under 45 minutes on a gigabit connection.
- Stateless scanning model: Sends probes without maintaining per-host connection state, improving scalability.
- Protocol probe modules: Includes modules for TCP SYN, ICMP, DNS queries, UPnP, BACNET, and UDP probes.
- Extensible architecture: Supports additional functionality through modules and companion tools such as ZGrab for application-layer probing.
- Cross-platform operation: Runs on Linux, macOS, and BSD systems.
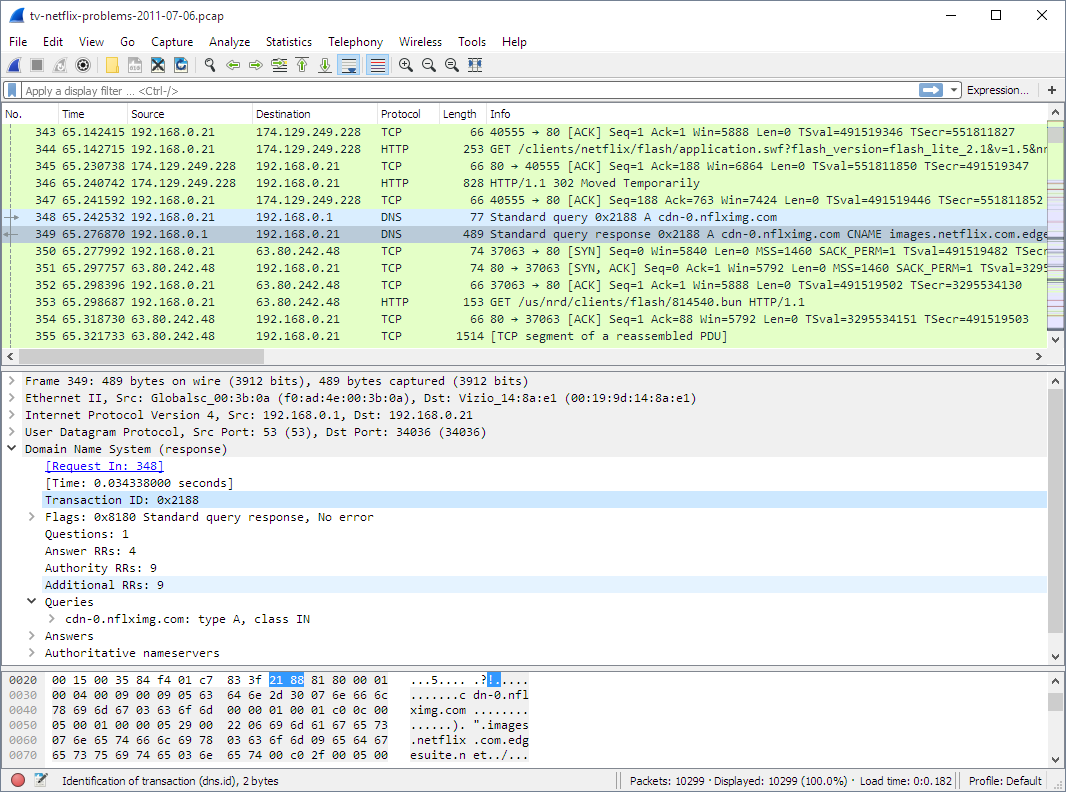
10. Wireshark

License: GPL-2.0
Repo: https://github.com/wireshark/wireshark
GitHub stars: 8K+
Contributors: 1K+
Wireshark is a network traffic analyzer used to capture and inspect packets transmitted across a network. It provides detailed visibility into protocol interactions by decoding packet contents and presenting them in a structured format. The project also includes command-line tools such as TShark for packet capture and analysis without a graphical interface.
Key features include:
- Packet capture and inspection: Captures network packets and displays their structure and protocol fields for detailed analysis.
- Protocol dissection: Decodes a range of protocols to reveal encapsulated fields and communication details.
- Multiple capture tools: Includes utilities such as TShark for command-line packet analysis and editcap for manipulating capture files.
- Cross-platform support: Runs on Linux, Windows, macOS, and various Unix-like systems.
- Capture file compatibility: Reads and writes multiple packet capture formats and can process compressed capture files.

Source: Wireshark
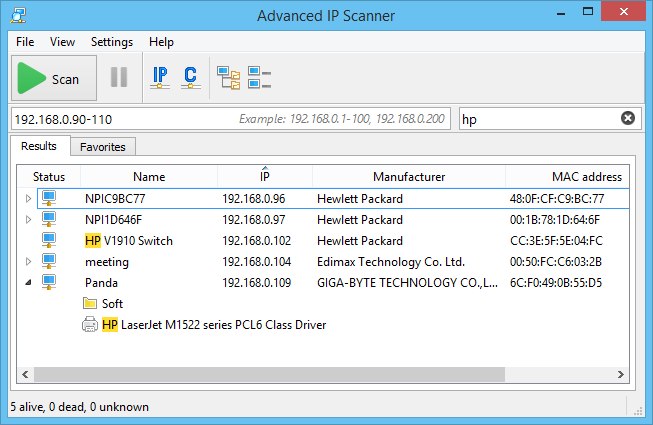
11. Advanced IP Scanner

License: GPL-2.0
Repo: https://www.advanced-ip-scanner.com/
Advanced IP Scanner is a network scanning tool to quickly identify devices connected to a local area network. It scans IP ranges and displays information about discovered hosts, including network addresses and shared resources. The tool also integrates remote access capabilities that allow administrators to connect to or manage devices directly from the scan results.
Key features include:
- Network device discovery: Scans a LAN and lists detected devices along with information such as IP and MAC addresses.
- Remote access integration: Supports remote connections through protocols such as RDP and Radmin.
- Shared resource detection: Identifies shared folders available on discovered machines.
- Remote power control: Allows administrators to switch computers on or off remotely.
- Exportable scan results: Supports exporting discovered device information to CSV files.

Source: Advanced IP Scanner
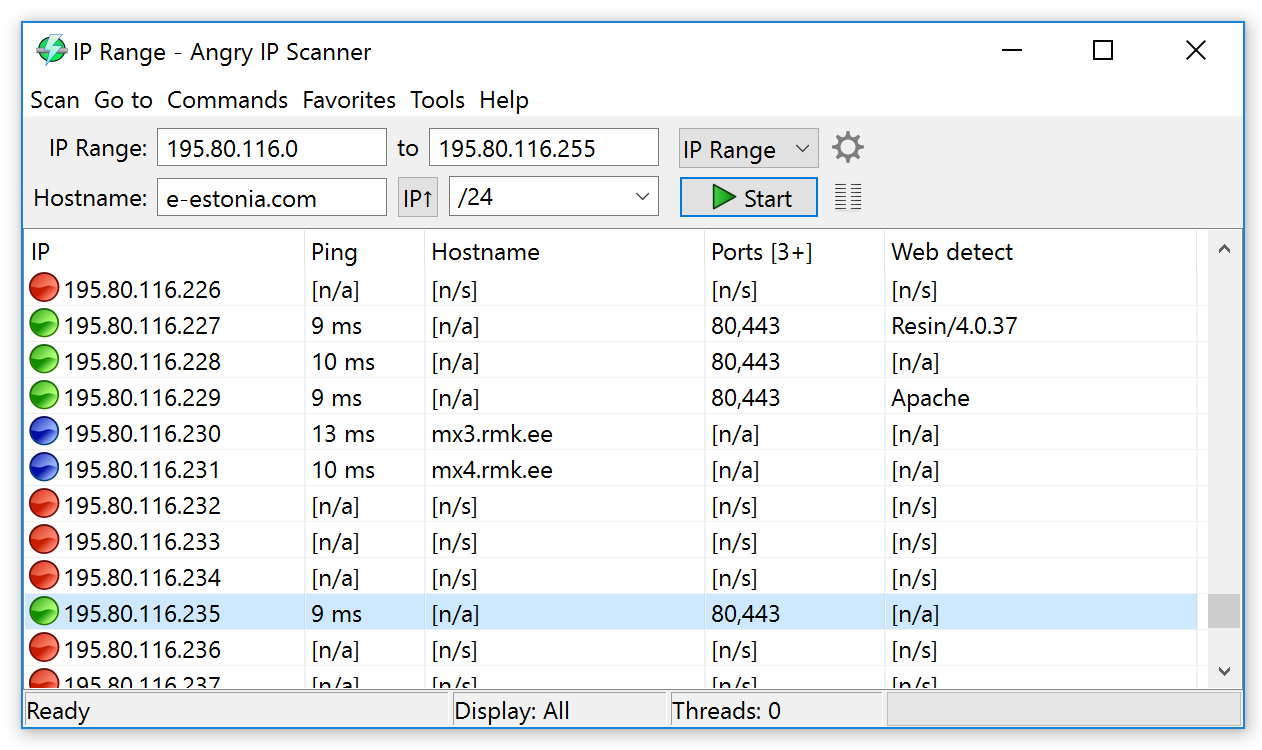
12. Angry IP Scanner

License: GPL-2.0
Repo: https://github.com/angryip/ipscan
GitHub stars: 4K+
Contributors: 30+
Angry IP Scanner is an open-source network scanner used to discover active hosts on a network. The project is primarily written in Java and uses the SWT library from the Eclipse project to provide a graphical interface with native components across operating systems. It can be built and packaged using Gradle and runs on multiple platforms.
Key features include:
- Cross-platform operation: Runs on Linux, Windows, and macOS using a Java-based implementation.
- Java-based architecture: The application is primarily written in Java, enabling portability across systems that support the Java runtime.
- Native graphical interface: Uses the SWT library from the Eclipse project to provide platform-native GUI components.
- Source-based build system: Supports building and packaging through Gradle, allowing compilation and distribution for different operating systems.
- Open-source development model: Hosted on GitHub with contributions from multiple developers and support for community pull requests.

Source: Angry IP Scanner
13. Masscan
License: AGPL-3.0
Repo: https://github.com/robertdavidgraham/masscan
GitHub stars: 25K+
Contributors: 60+
Masscan is a high-speed TCP port scanner for scanning large address ranges, including the entire Internet. It transmits packets asynchronously and can send millions of packets per second from a single machine. The tool is optimized for wide-scale port discovery rather than deep inspection of individual hosts and uses its own TCP/IP stack to manage scanning operations.
Key features include:
- High-speed port scanning: Can scan the entire Internet in minutes by transmitting up to millions of packets per second.
- Asynchronous scanning engine: Uses separate transmission and reception processes to maximize scanning throughput.
- Flexible target ranges: Supports scanning arbitrary IP ranges and port ranges in a single operation.
- Banner collection: Can establish TCP connections to retrieve basic service banner information from open ports.
- Multiple output formats: Exports scan results in formats such as XML, JSON, binary, grepable, or simple lists.
Evaluation Criteria for Network Discovery Tools
When evaluating network discovery tools, organizations should consider the following aspects.
1. Network Size and Complexity
When selecting a network discovery tool, it’s crucial to match its capabilities to the size and complexity of the network. Smaller networks may only need basic scanning features, while large enterprise environments require scalable tools that can support thousands of nodes across multiple subnets, VLANs, and geographic locations.
The tool should be capable of discovering devices across different network layers and integrating with existing infrastructure, including cloud and hybrid environments. Support for distributed scanning, subnetwork segmentation, and bandwidth-efficient polling is essential in large-scale environments to avoid network strain and ensure comprehensive visibility.
2. Real-Time Monitoring Capabilities
Real-time monitoring ensures that network administrators always have current information about devices, connections, and services. Look for tools that support continuous discovery and polling, which automatically detect and report changes like new devices, configuration updates, or service disruptions.
Features such as live dashboards, event logging, and integration with alerting systems (e.g., SIEM, syslog, SNMP traps) are key for timely incident response and network health tracking. Some tools offer agentless monitoring or use lightweight probes to provide real-time updates without adding overhead.
3. User Interface and Reporting
A user-friendly interface reduces the learning curve and improves operational efficiency. Tools should offer intuitive navigation, customizable dashboards, and visual topology maps that clearly show network relationships. Drag-and-drop capabilities and search filters help users quickly locate devices or troubleshoot issues.
Reporting capabilities are equally important. Look for tools that generate detailed, exportable reports on device inventory, service status, uptime, and changes over time. These reports support compliance audits, executive summaries, and technical planning. Automated scheduling and role-based access to reports can simplify recurring tasks and collaboration.
4. Cost and Licensing
Total cost of ownership includes not just the initial license fee, but also ongoing maintenance, support, training, and infrastructure requirements. Open-source tools may be free but could require more internal resources to deploy and manage. Commercial tools often come with support and updates, but licensing models vary—some charge per device, others per user or feature set.
Organizations should assess whether the tool’s cost aligns with its capabilities and projected usage. Considerations include scalability, integration with other systems, vendor reputation, and the potential for future expansion. Trial periods or proof-of-concept deployments can help evaluate cost-effectiveness before committing.
If you would like to see Faddom in action within your environment, please schedule a demo with our experts by completing the form on the right.


