What Is Virima?
Virima is an IT management platform that combines IT asset management (ITAM), IT service management (ITSM), and IT operations management (ITOM) into a unified solution. It helps organizations gain visibility and control over their technology environments through automated discovery, configuration management, service mapping, and deep integration with ITSM tools.
Virima is intended to address common challenges in IT environments—such as incomplete or inaccurate configuration data—by offering automated tools for asset discovery and dependency mapping. The platform supports both agentless and agent-based discovery across on-premise and multi-cloud infrastructure, providing a real-time view of IT assets and services.
By simplifying asset inventory, service relationships, and incident data into a centralized, visual interface, Virima helps IT teams reduce manual effort, improve service reliability, and accelerate response times. It also provides fast time-to-value and return on investment, making it a practical solution for IT management.
Key Features of Virima
Virima offers a range of features designed to simplify and unify IT asset, service, and operations management. Key capabilities include:
- Agentless and agent-based discovery: Automatically detects physical and virtual assets across hybrid environments. Agentless IP-based scanning is complemented by optional agents for continuous monitoring and off-network visibility.
- Configuration management database (CMDB): ITIL SACM-compliant CMDB enhanced with automation and deep integration capabilities. It synchronizes with external data sources and ITSM platforms to maintain an accurate configuration baseline.
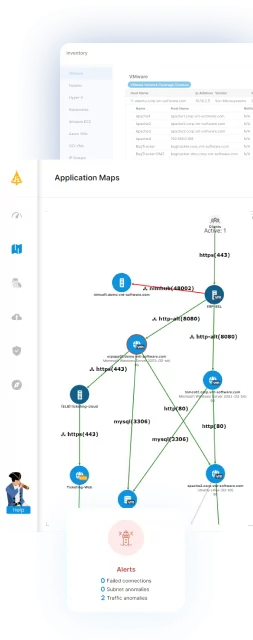
- Service and dependency mapping: Identifies application and infrastructure dependencies automatically. Enables impact analysis, migration planning, and incident resolution with visually rich relationship maps.
- Virima Visual Impact Display (ViVID™): Provides an interactive visualization of service maps overlaid with live ITSM data like incidents, changes, alerts, and vulnerabilities. Improves situational awareness for IT operations and security teams.
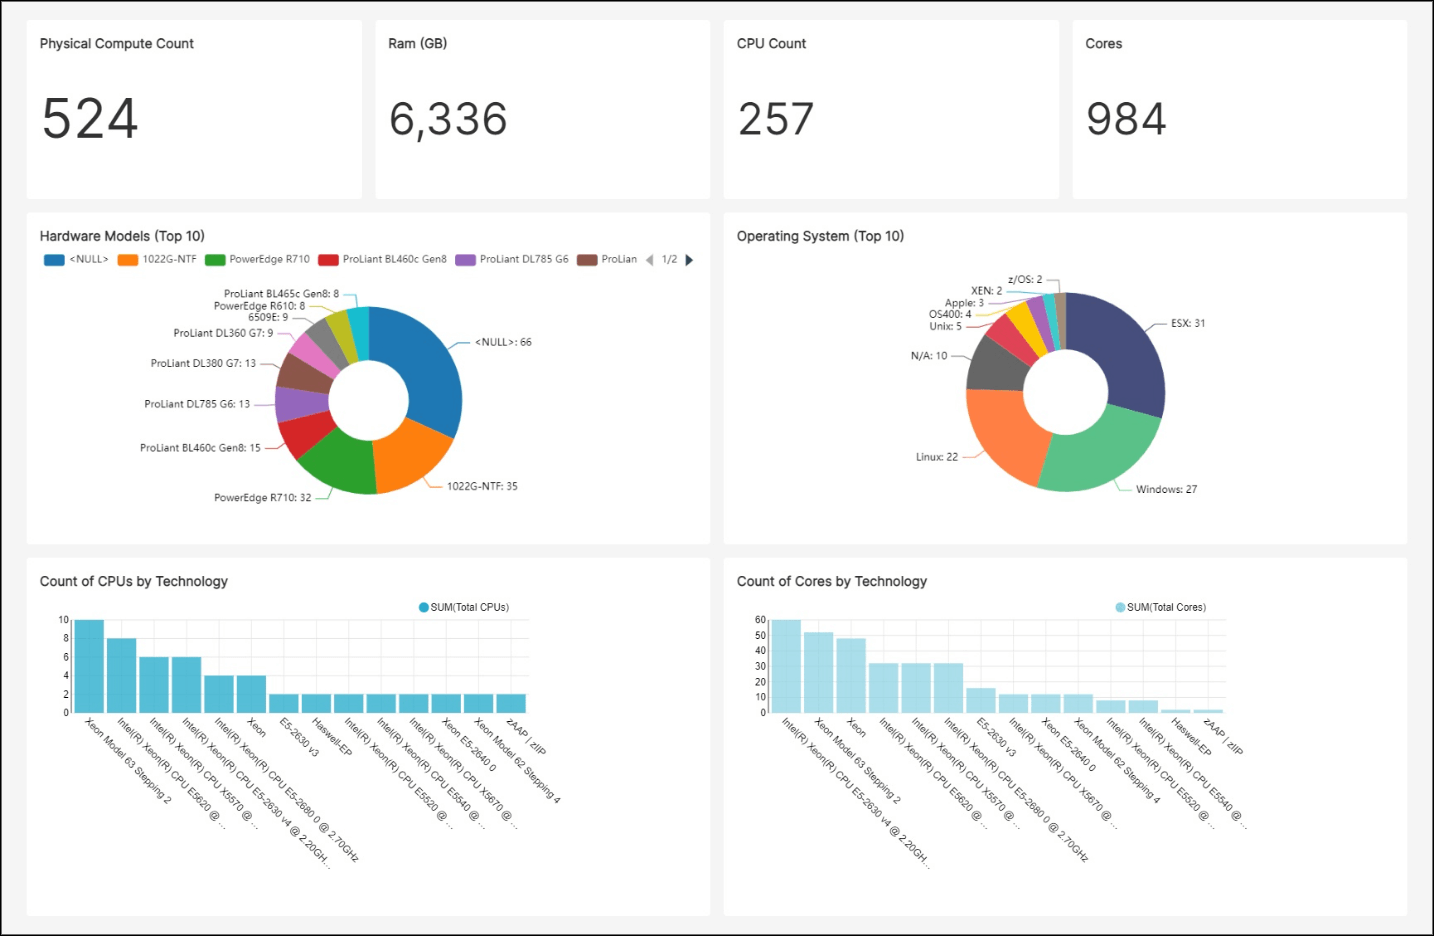
- IT asset management (ITAM): Supports lifecycle management of hardware and software assets. Delivers insights into inventory, licensing, compliance, and financial reporting.
- ITSM integrations: Offers codeless integrations with platforms like ServiceNow, Ivanti, and Jira Service Management. Enables bi-directional data sync to maintain alignment between IT operations and service management processes.
- IT operations management (ITOM): Combines discovery, CMDB, and ViVID to deliver integrated ITOM capabilities. Supports SACM and enables unified visibility across infrastructure and services.
- Managed service provider (MSP) support: Provides tools for MSPs to deliver Virima’s capabilities to their clients, including multi-tenant support, secure access, and service offerings such as CMDB-as-a-Service.
Virima Pricing Bundles
Virima offers three primary pricing bundles designed to meet a range of IT management needs: Discovery, ITAM, and MSP. These bundles can be purchased individually or combined to create a custom solution. Annual subscriptions start at $15,000 USD.
Discovery
The Discovery bundle focuses on visibility into IT environments through automated discovery and mapping tools. It includes an ITIL-compliant CMDB, agentless and agent-based discovery, and support for hybrid environments including Windows, Mac, and Linux. Key capabilities include service mapping, cloud discovery, application dependency mapping, and network topology visualization. The bundle also supports business rule/runbook automation, ITSM integrations, API integration, and reporting via dashboards.
ITAM (IT Asset Management)
The ITAM bundle provides native integration with Virima Discovery and CMDB to support lifecycle management of IT assets. Features include hardware and software asset management, software usage metering, license and certificate management, contract and vendor management, and IT finance and procurement tracking. The bundle is also equipped with automation capabilities, API integrations, and reporting tools.
MSP (Managed Service Provider)
Designed for service providers, the MSP bundle includes a dedicated multi-tenant environment and access to all Discovery and ITAM features. It adds MSP-specific functionality like client-specific self-service portals, a single login/admin portal, CMDB-as-a-Service, and more flexible subscription and billing options. It supports ITSM integrations, runbook automation, visual impact display (ViVID), and private hosting options.
Virima Limitations
Virima provides capabilities across IT asset, service, and operations management, but there are some limitations that users should consider. These limitations were reported by users on Capterra:
- Clunky user interface: Some UI elements are hard to navigate. Column widths can’t be customized, and overall design could use refinement.
- Non-WYSIWYG forms: Form editing isn’t visual, requiring manual adjustments to get content in the right place.
- Slow and variable scan performance: Discovery scans can be slow and inconsistent in duration, particularly in complex setups.
- Limited UI-based administration: Backend and database tasks can’t be performed directly through the application interface.
- Self-contained system design: Features like sending alerts or emails to external addresses require extra setup and aren’t enabled by default.
- Integration issues with non-windows systems: Some configuration challenges may arise with non-Windows environments, though support is generally responsive.
- No support for legacy Intermec scanners: Due to vendor restrictions, legacy Intermec devices can’t be monitored.
- Interface not optimized for all devices: While mobile access is available, the browser-based interface takes time to get used to on smaller screens.
- Rapid feature releases can introduce instability: Frequent updates bring new functionality but may also cause occasional instability.
- Smaller market presence: Virima has a relatively low profile in the IT management space, which may be a concern for some organizations.
Notable Virima Alternatives
Discovery and Dependency Mapping Tools
1. Faddom

Faddom is an agentless application dependency mapping platform that maps on-premises and cloud infrastructure in real time and automatically groups discovered servers into business applications. It uses a passive, read-only approach that does not require installing agents, supplying server credentials, or changing firewall rules, and it can run offline with all data staying inside the customer’s environment. The platform applies AI-driven correlation to turn raw network traffic into application and dependency maps, producing a first map within roughly an hour of deployment. It is positioned as an operational context layer for understanding, operating, and securing hybrid and multi-cloud IT estates, spanning discovery, change management, migration, security, audit, and cost use cases. The result is presented as a single, continuously updated view of servers, applications, and the dependencies that connect them.

Key features include:
- Agentless real-time mapping: Faddom discovers and maps servers and applications passively, without agents, stored credentials, or firewall changes. The deployment is lightweight, can operate offline, and keeps all collected data within the customer’s environment, which suits read-only and security-sensitive use. Maps update continuously so the view of the environment stays current as it changes.
- Automatic application grouping: The platform connects to on-premises, cloud, and virtualized data sources and automatically groups discovered servers into the business applications they support. This produces an interactive view of how applications and infrastructure relate across hybrid and multi-cloud environments. It removes the manual effort of building these groupings by hand from spreadsheets.
- AI-driven correlation and analysis: Faddom AI analyzes raw network data and converts it into real-time application and dependency mapping. It is intended to provide accurate documentation and operational context for hybrid topologies. The same analysis feeds the platform’s discovery, change, migration, and security views.
- Change management and impact analysis: Faddom tracks changes across the environment and visualizes dependencies so teams can assess the impact of a change before it is made. Continuous, real-time visibility is used to reduce risk during maintenance and transformation work. Maps reflect the current state of communication flows between systems.
- Migration and cost planning: The platform supports migration through wave-based planning intended to minimize disruption and keep dependencies intact during moves. It also surfaces resource usage to help identify optimization and cost-saving opportunities. These views are built from the same dependency data used elsewhere in the product.
- Security, audit, and documentation: Faddom detects vulnerabilities and surfaces threats with real-time insights, and it tracks items such as SSL certificates and external traffic. It is also used to maintain accurate IT asset documentation for audits, compliance, and governance. The output serves as a continuously updated single source of truth across teams.
Limitations (as reported by users on G2):
- Learning curve with terminology and breadth: Some users note that the platform’s terminology and the range of available features take time to learn, particularly during initial onboarding. The breadth of functionality can feel like a lot to absorb at first.
- Reporting and export refinement: A few reviewers would like more polished exportable reports and executive-style dashboards, citing constraints when exporting certain lists. They describe reporting as an area with room for improvement rather than a core gap.
- Map readability in large environments: In very large or highly complex estates, some users report that dependency maps can become dense and may need manual tidying to stay clear. They note this is more about presentation than data accuracy.
2. Device42

Device42, now part of Freshworks, is a discovery and dependency mapping platform that shows how applications and infrastructure connect across hybrid and multi-cloud environments. It automatically discovers assets and the communication patterns between them, then organizes that information into application and service views for incident response, change management, compliance, and migration. The product builds business-service models and impact views that illustrate how a change or outage on one device ripples across connected services. It also identifies legacy systems and their connections to active applications to support modernization decisions. Device42 keeps dependency documentation continuously up to date so it can be used as an ongoing reference rather than a point-in-time snapshot.

Source: Device42
Key features include:
- Automated service discovery: Device42 discovers the environment and analyzes communication patterns to identify inter-service dependencies across on-premises, cloud, and hybrid systems. It recognizes active services and the ports in use, and can build dependency views without configuring costly span ports. The result is a detailed view of services, ports, and connections across different systems.
- Application Groups: The platform automatically maps the environment by grouping assets based on real communication patterns. Application Group Calculation Rules let teams define what belongs in a group using criteria such as service type, server inclusion, and start or end points. Users can set an application’s starting point, let Device42 discover related resources, track changes over time with a timeline view, and export the results.
- Business Services: Business Services provide a visual representation of how components, devices, and resources combine to form critical applications. They can be built manually or from an Application Group, with the ability to add or remove devices, define connections, and customize layouts. Teams can attach metadata such as application type, owners, SLAs, and disaster-recovery details, then print or export the charts.
- Impact Charts and Impact Lists: Auto-generated diagrams illustrate relationships between services and the ripple effects of a change. Impact Lists show which services are influenced by an initiating device and how disruptions propagate upstream and downstream. They also indicate the organizational groups that rely on a given device.
- Discovery for migration and incident work: Dependency views support migration planning by revealing the components connected to an application before a move. The same data helps trace incidents to their source to reduce mean time to resolution. It also keeps documentation current for audits and helps identify legacy or redundant systems.
Limitations (as reported by users on G2):
- Add-on based pricing: Some users note that certain capabilities are licensed as separate add-ons rather than included in the base product, and a few describe the cost as high for smaller requirements. This can make scoping a deployment less straightforward.
- Setup complexity and learning curve: Reviewers report that initial setup and navigation can feel complex, especially for smaller teams, and that auto-discovery configuration can be challenging in complex environments. New users may need time before they are productive.
- Performance at scale: Several users mention that the single-appliance architecture can become heavily loaded under high volumes of API calls or activity, with occasional slowness on large datasets. This mainly affects larger or busier deployments.
- Interface and visualization: Some reviewers describe the interface as dated and note that topology diagrams could be more presentable, including the inability to download all diagrams at once. These are described as usability rather than functional gaps.
- Reporting gaps: A few users point to limits in exportable reporting, such as the inability to export certain sub-component change details that are visible in the application. They work around this with the API in some cases.
3. Lansweeper

Lansweeper is a technology asset discovery and inventory platform that aims to give IT and security teams a single, accurate view of every asset across IT, OT, IoT, and cloud environments. It uses agentless deep-scan discovery to find and catalog connected devices, then consolidates hardware, software, and user data into a centralized inventory enriched with configuration, lifecycle, and vulnerability information. The platform is built primarily as a source of asset data rather than a full ITSM or CMDB system, and it feeds that data into other tools through integrations and APIs. It includes dashboards, reporting, and dynamically generated diagrams that show relationships such as network topologies and virtual environments. Lansweeper positions itself as the trusted data foundation that other IT, security, and finance systems draw on.
Key features include:
- Agentless network discovery: Lansweeper automatically discovers and catalogs every connected asset, whether known or unknown and managed or unmanaged, using standard scanning protocols. Discovery spans IT devices, operational technology, and cloud and virtual environments across providers. An optional agent is available for off-network or work-from-home scenarios, and discovery connectors import data from systems such as SCCM and Intune.
- Asset inventory and normalization: The platform consolidates hardware, software, and user data into a single, centralized inventory. It reconciles and normalizes details such as software titles, versions, vendors, models, and firmware, and stores asset profiles with configurations, installed software, and ownership. Data federation reconciles information across multiple distributed installations into one view.
- Insights and reporting: Lansweeper provides BI dashboards and analytics, vulnerability insights tied to discovered software and assets, and lifecycle insights that flag items reaching end of life. It generates dynamically created diagrams of network topologies and virtual environments on top of the inventory. Reports and insights can be exported to formats such as Excel, CSV, and PDF.
- Software asset management and warranty tracking: The software asset management capability supports license optimization and compliance. The platform also collects warranty status for physical devices automatically. These functions draw on the same continuously updated inventory.
- Orchestration and integrations: Lansweeper automates routine workflows and connects to other systems through an open GraphQL API, webhooks, and certified integrations with tools such as ServiceNow, Jira Service Management, and Freshservice. An MCP server exposes validated asset data to AI agents through a structured interface. The aim is to push trusted asset data into the systems that take action.
- Administration and security: The platform offers role-based access control, single sign-on, multi-factor authentication, and asset-level scoping to govern who can see and do what. Hosting can be chosen in EU or US regions for data residency. These controls apply across the platform.
Limitations (as reported by users on G2):
- Custom reporting requires SQL: In the on-premises product, building custom reports often requires knowledge of the underlying database tables and SQL queries. Users without that background tend to be limited to the built-in reports.
- Cloud and on-premises disparity: Several reviewers note that newer development has focused on the cloud product, leaving feature gaps with the on-premises version, and some raise data-residency questions about cloud hosting. Teams committed to on-premises deployments feel this most.
- Pricing and tier structure: Users report that pricing has increased over time and that the free tier’s small asset allowance jumps to a much larger paid tier, which is awkward for small deployments that only slightly exceed the free limit. This affects budgeting for smaller environments.
- Interface density: Some reviewers describe the interface as cluttered or dated, with a large amount of information presented at once and administration that is not always intuitive. They note this is a usability concern rather than a data issue.
- Remote access and data freshness: A few users mention limitations in remote-connection features, occasional delays in inventory refresh, and weaker coverage for some platforms such as Mac. These tend to surface in distributed or mixed environments.
CMDB and ITSM Platforms
4. ServiceNow CMDB

ServiceNow Configuration Management Database (CMDB) is a centralized system of record for configuration item (CI) data across the enterprise. It is designed to give full visibility into infrastructure and services and to share accurate, consistent data across the wider ServiceNow platform. The CMDB brings together data from multiple IT systems, normalizes it, and exposes the relationships between configuration items for impact analysis and operational planning. It includes tooling to assess and maintain data accuracy so the records can support automated and AI-driven decisions. As part of the ServiceNow platform, it is most often adopted by organizations already standardizing on ServiceNow as their system of record.

Source: ServiceNow
Key features include:
- Single system of record: The CMDB is intended to be the trusted source for all configuration item data, shared across the enterprise to improve efficiency. It provides visibility into infrastructure and services from one place. Other ServiceNow workflows reference this data for context.
- CMDB Workspace: A central workspace lets teams explore, validate, and manage CI data while tracking activity and deriving insights. It is used to help ensure accuracy and to give administrators a focused place to work with the data. Activity tracking supports ongoing data governance.
- Service Graph Connectors: Certified connectors integrate and normalize external data from key IT systems into the CMDB. They are intended to simplify importing and standardizing data from multiple sources. This reduces the manual effort of populating and maintaining records.
- Data acquisition and population: The platform curates data from multiple sources and presents a 360-degree view of automatically populated CMDB data. It populates and refreshes context so teams can understand risk and impact. This is positioned as an alternative to manual-only maintenance.
- Visualization and reporting: The CMDB displays business context and technical CI relationships from a unified map to support impact analysis and operational planning. Reports illustrate both technical and business relationships between CIs. These views help teams assess how components and services connect.
- Data accuracy and health: Built-in capabilities continuously assess data accuracy and help curate trusted data sets. The intent is to enable reliable reporting and trusted AI outcomes from the underlying records. Health checks support audit and validation work.
Limitations (as reported by users on PeerSpot):
- Significant configuration effort: Reviewers note that the CMDB functions largely as a platform out of the box and that substantial development and a dedicated project are needed to make it robust. Teams get out of it what they invest in configuration.
- Cost: Several users describe the price as falling on the higher end relative to some alternatives. This can be a consideration for organizations weighing total cost.
- Query performance at scale: Some reviewers report that running queries against the CMDB can be slow in larger environments. Performance is mentioned as an area for improvement.
- Ongoing data maintenance: Users note that keeping data accurate still involves considerable ongoing effort, sometimes described as “manual debt.” Data quality depends on sustained upkeep.
- Specific feature gaps: Reviewers cite gaps such as not automatically surfacing the applications associated with a selected CI, along with requests for enhanced customization. These are described as targeted improvements rather than broad shortcomings.
5. BMC Helix CMDB

BMC Helix CMDB is a service-aware configuration management database that provides a single, business-aware reference for an organization’s assets and services. It consolidates and federates data from multiple sources into a definitive production data set and maintains accurate models for large numbers of configuration items across on-premises and cloud services. The product reconciles and normalizes incoming data in real time and graphically visualizes relationships and dependencies for impact analysis and change planning. It is designed to feed configuration and dependency context into related processes such as change management and the service desk. BMC positions it as the data foundation for IT service management within the broader BMC Helix suite.

Source: BMC
Key features include:
- Single source of reference: The CMDB maintains accurate data and service models for very large numbers of configuration items, including on-premises and cloud services. It tracks hardware, software, and cloud service configurations and the relationships among them. The goal is one definitive, business-aware reference for assets and services.
- Data reconciliation and federation: The platform automatically reconciles and normalizes data from multiple sources in real time to produce a single production data set. It can import and federate data from other sources using a rich set of APIs, and auto-populate and update records with BMC Helix Discovery, BMC Helix Client Management, and other out-of-the-box connectors. This is intended to keep records current with limited manual effort.
- Service-centric relationship mapping: BMC Helix CMDB captures the physical and logical dependencies between IT components and business services. It graphically visualizes those relationships and dependencies to make them easier to understand. The mapping supports impact analysis across the environment.
- Change management support: The CMDB provides insight and context for the configuration items and services affected by a change, supporting more effective change advisory boards with accurate configuration and dependency data. It helps teams understand the impact of a change on other infrastructure, applications, or services and detect conflicts when multiple changes are scheduled together. This connects configuration data to change decisions.
- Data quality and governance: Predefined KPIs let teams measure the success of their configuration management process or policy. Granular role-based access can be defined for all items and attributes. These controls support governance and data quality.
- Service desk support: The CMDB surfaces the services affected by a ticket and provides detailed configuration context for the items being troubleshooted. It can automatically route tickets to the optimal resolver based on CMDB data. This ties configuration data into incident handling.
Limitations (as reported by users on PeerSpot):
- Cost: Some reviewers note that the CMDB is more expensive than certain competing products. This is a factor for organizations comparing options on price.
- Interface and usability: Users describe the interface and the layout for viewing configuration items and their relationships as areas that can be confusing, with recent improvements focused on the interface. They frame this as a usability concern.
- Administration complexity: Reviewers report that customization and tracking different jobs can be complex, sometimes requiring multiple windows and lacking a single central dashboard. This adds overhead for administrators.
- Data de-duplication: Some users would like stronger backend controls to ensure unique collections and avoid duplicate services. They cite this as an area for refinement.
- Implementation effort: Deployments and upgrades are described as requiring significant planning, resources, and expertise. This extends timelines beyond licensing alone.
6. ManageEngine ServiceDesk Plus

ManageEngine ServiceDesk Plus is a service management platform that combines IT service management, IT asset management, and a CMDB with enterprise service management capabilities for departments such as HR, facilities, and finance. It is available both on-premises and in the cloud, with the option to migrate between the two models, and it integrates closely with ManageEngine’s wider product suite. The platform follows the ITIL framework and includes dedicated modules for incident, problem, change, and release management, along with a self-service portal, knowledge base, and SLA management. It also embeds AI capabilities, using a mix of proprietary technology and third-party services such as ChatGPT and Microsoft Copilot, across ticketing and support workflows. ServiceDesk Plus is offered in tiered editions aimed at organizations that need more than basic ticketing.
Key features include:
- Unified ITSM, ITAM, and CMDB: ServiceDesk Plus combines service management, asset management, and a CMDB in one platform, extended to non-IT functions through enterprise service management. Its CMDB tracks configuration items and maps their relationships and dependencies to analyze the impact of changes and outages. It is available on-premises and in the cloud, with migration supported between the models.
- ITIL-aligned service management: The platform is ITIL-certified for 14 practices and provides modules for incident, problem, change, request, and release management. It includes SLA management with multi-level escalations, a self-service portal, and a knowledge base. These cover the full lifecycle of IT tickets.
- Embedded AI: A machine-learning prediction engine handles ticket triage, routing, assignment, and sentiment analysis. The Zia virtual support agent handles end-user requests through text and voice, and generative AI features powered by ChatGPT and Microsoft Copilot support knowledge access, response generation, and request summarization. These capabilities are offered across editions.
- Low-code customization and multi-instance model: Teams can build and deploy custom modules, forms, configurations, and reports using low-code tools. A multi-instance model provides separate service desk instances with clear data and process segregation for multiple departments. This supports enterprise service management across business functions.
- Native integrations: ServiceDesk Plus integrates deeply with ManageEngine’s product suite, such as Endpoint Central, Asset Explorer, and OpManager, to provide a connected view of IT management operations. It also supports third-party integrations through its APIs. The intent is end-to-end visibility from one platform.
- Asset and service management: The platform discovers and tracks hardware and software assets, supports license compliance, and manages purchases and contracts. Asset data is linked to the CMDB and to tickets for context during incidents and changes. Reporting and live dashboards reflect service desk performance.
Limitations (as reported by users on G2):
- Setup and customization complexity: Reviewers report that initial setup and workflow customization can be time-consuming given the number of settings, and that advanced configuration and automation often require scripting and training. The flexibility comes with a steeper learning curve.
- Interface and performance: Some users describe the interface as feeling like older web applications and note that it can feel heavy in large environments, with hosted or on-premises instances slowing down at times. These are raised as usability and performance concerns.
- Support responsiveness: Several reviewers mention that customer support responses can be slow, with some relying on local partners to bridge the gap. Experiences vary across users.
- Reporting limits: Users note that standard reports can be limited and that more advanced or custom reporting may require the separate Analytics Plus product. This adds steps for teams needing detailed analytics.
- Licensing and upgrades: Reviewers point to technician-based licensing that some find expensive or confusing, and note that major upgrades can change the interface enough to require relearning. These affect cost planning and change management.
Conclusion
Choosing the right IT management platform depends on an organization’s infrastructure complexity, compliance requirements, and integration needs. The most effective solutions offer continuous visibility, minimize manual effort, and support key functions such as change management, incident response, and security audits.
Platforms that deliver accurate discovery, seamless ITSM integration, and real-time dependency mapping without relying on agents stand out by offering faster implementation, lower overhead, and greater clarity in dynamic IT environments. This lightweight and scalable approach enables organizations to enhance service reliability, mitigate risks, and maintain a comprehensive understanding of their entire infrastructure.


