What Is WhatsUp Gold?
WhatsUp Gold is network monitoring software developed by Progress. It provides real-time visibility into the status and performance of various network devices and applications. This enables IT professionals to monitor, identify, and troubleshoot network issues.
Its functionalities include alerting, mapping, and reporting, which are crucial for maintaining network health. Users can customize dashboards to display the most relevant data. The software supports device discovery using network layers 2 and 3, allowing users to map out their network infrastructure automatically.
With its user interface, WhatsUp Gold simplifies network management tasks. The software includes an array of plugins to extend its functionality, catering to diverse monitoring needs. Integration capabilities with third-party tools further enhance its utility in business environments requiring network transparency and efficiency.
WhatsUp Gold Limitations
While WhatsUp Gold offers extensive network monitoring features, there are several limitations that can impact its usability and performance, as reported by users on the G2 platform:
- Inefficient device scanning: Adding a single machine requires a complete network rescan, which is slow and re-enables previously disabled monitors.
- Complex interface: The user interface is complex and unintuitive, with users reporting frequent crashes, especially in VMware environments.
- Limited API functionality: The APIs support only a small fraction of what can be done via the web interface, and many API endpoints are undocumented.
- Poor alerting integration: Lacks native webhook support, requiring the use of insecure PowerShell scripts with embedded login credentials. Editing alert policies via the API is not possible.
- Performance issues: Generating graphs is slow due to Java-based data fetching, especially when compared to faster alternatives like cacti.
- Inconvenient user management: Administering user views is cumbersome, requiring multiple logins to adjust dashboards and permissions.
- Lack of anonymous view: No option to provide read-only, anonymous access to dashboards for stakeholders, making data sharing difficult without risking changes to the setup.
- Clunky web interface: The web interface often needs to be refreshed and lacks the efficiency of a traditional “fat-client” application.
Notable WhatsUp Gold Alternatives
1. Faddom

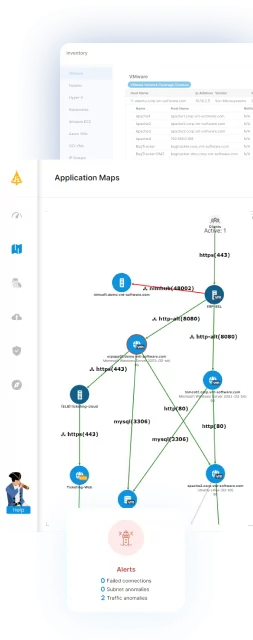
Faddom is an agentless, real-time application dependency mapping tool that offers fast deployment (under 60 minutes) and scalability for both on-premise and cloud environments. Its passive approach minimizes network load, making it ideal for complex infrastructures, while helping IT teams optimize resources, enhance security, and support IT governance.
Key features of Faddom:
- Agentless mapping: Provides detailed insights into infrastructure and application dependencies without the need for agents.
- Scalability: Supports both small businesses and large enterprises by scaling its mapping capabilities as needed.
- Security: Ensures a secure deployment with minimal exposure to vulnerabilities, as it does not rely on agents or active network scanning.
- Hybrid environment support: Maps dependencies across on-premise, hybrid, and cloud infrastructures.
Learn more about Faddom for application mapping or start a free trial to the right

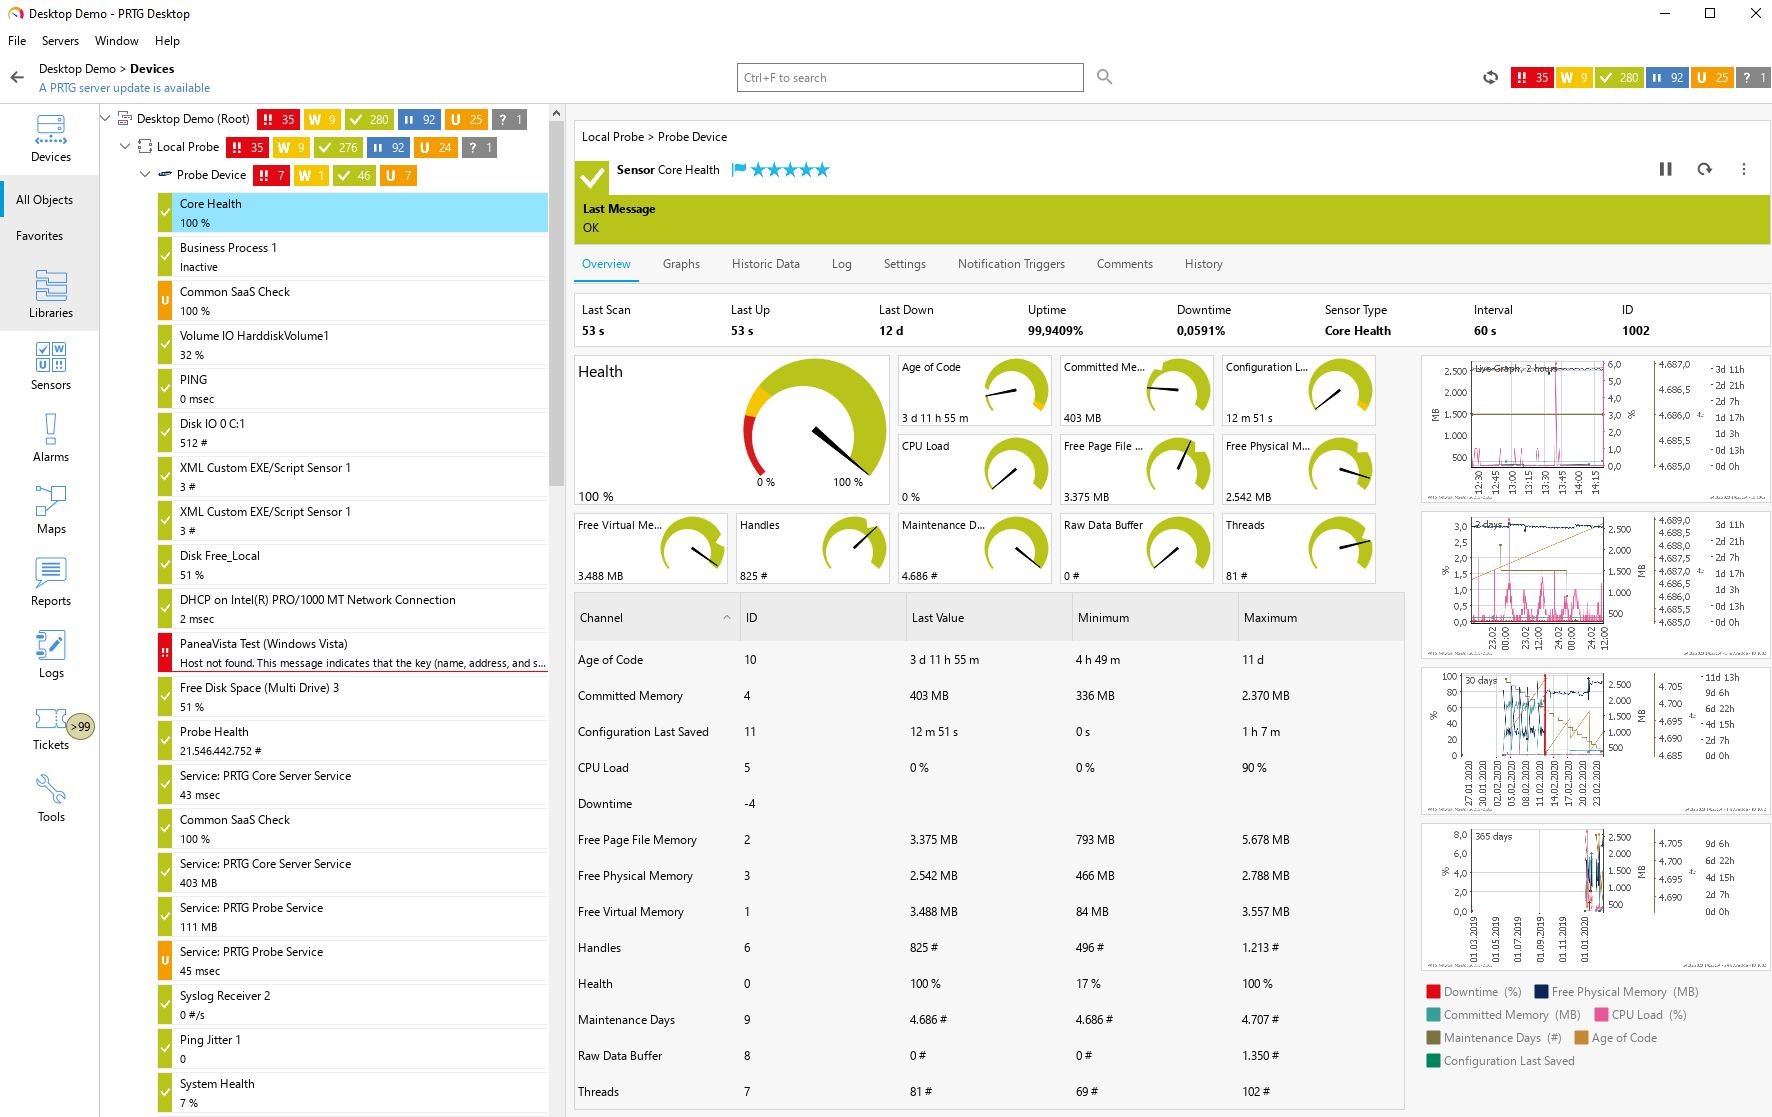
2. PRTG
PRTG Network Monitor, developed by Paessler, is a monitoring solution that allows IT professionals to keep track of their IT infrastructure. It monitors systems, devices, traffic, and applications, providing visibility into network performance.
Key features of PRTG Network Monitor:
- Network monitoring: Monitors all systems, devices, and traffic across your IT infrastructure, providing real-time insights.
- Database monitoring: Uses custom PRTG sensors and SQL queries to monitor specific datasets from databases.
- Application monitoring: Tracks all running applications, providing detailed statistics.
- Cloud monitoring: Centrally monitors and manages cloud services.
- Server monitoring: Keeps tabs on the availability, accessibility, and capacity of all types of servers.
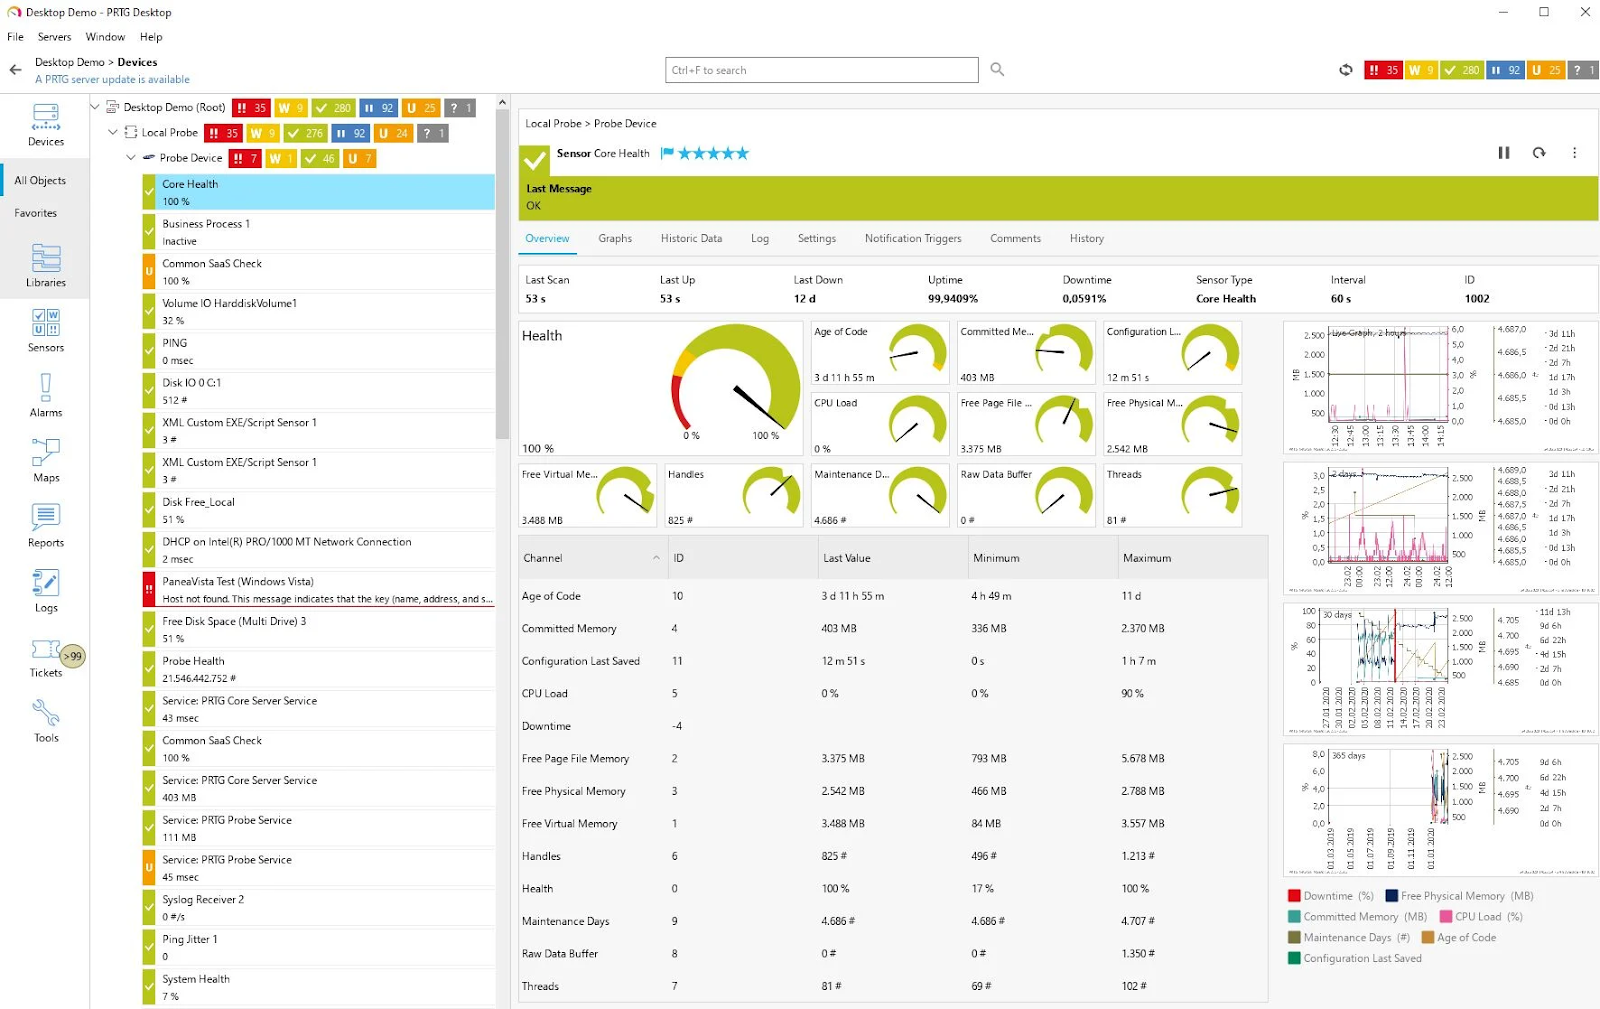
Source: Paessler
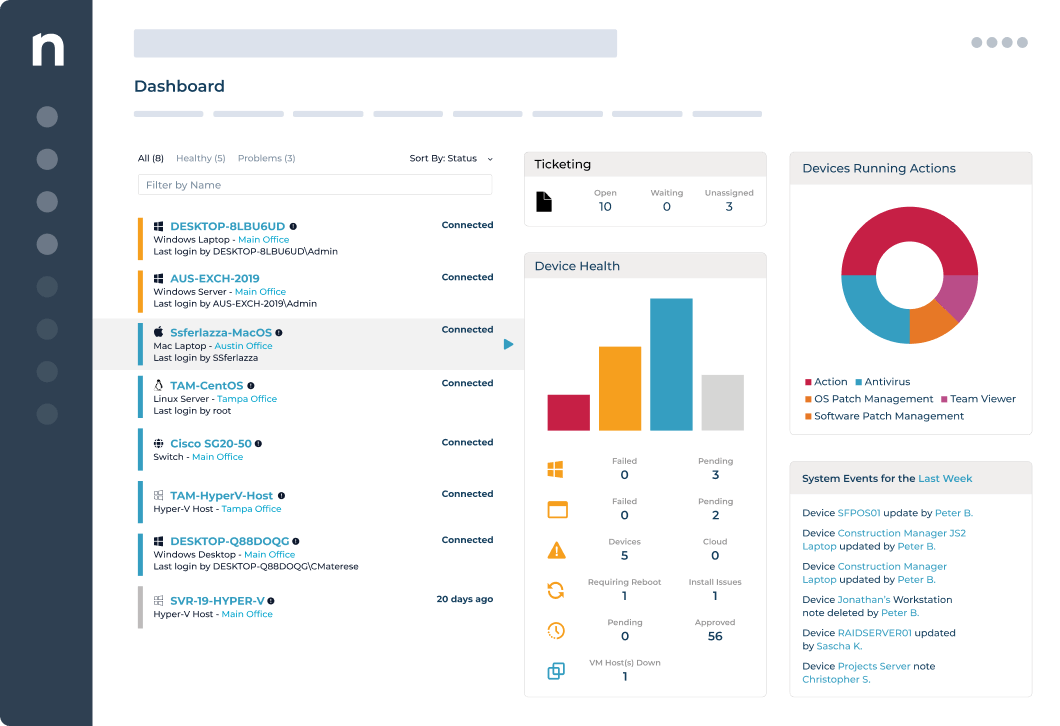
3. NinjaOne
NinjaOne is a unified IT management platform that provides centralized control and visibility over IT assets for tech companies. It enables IT teams to manage, automate, and secure distributed endpoints, helping improve support outcomes, enhance productivity, and protect critical data.
Key features of NinjaOne:
- Centralized device management: Provides visibility and control over IT assets, allowing IT teams to manage business networks, servers, and end-user devices from a single platform, regardless of location.
- Remote support: Enables IT teams to support end-users and their devices remotely, minimizing downtime and improving productivity for distributed workforces.
- Automation: Automates endpoint management tasks such as new device setup, patch deployment, vulnerability management, and application installation.
- Patch management: Automatically patches and hardens endpoints to reduce vulnerabilities.
- Data protection: Protects critical business data through automated backup and restore capabilities.

Source: NinjaOne
4. ManageEngine OpManager

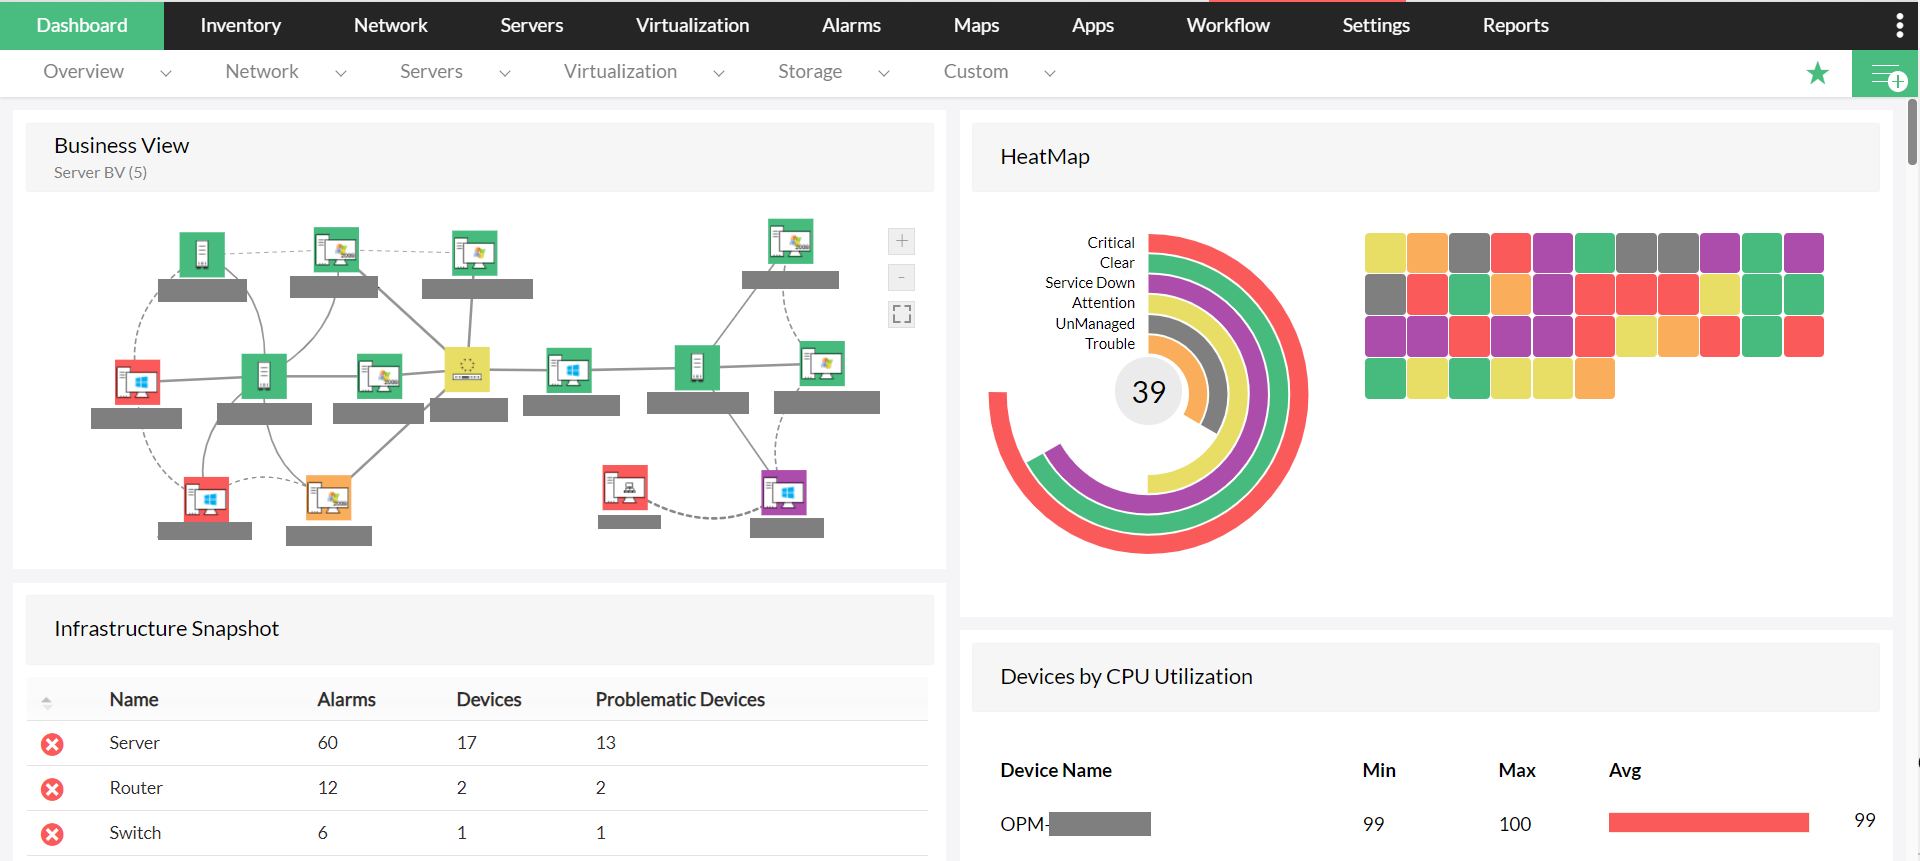
ManageEngine OpManager is a network monitoring tool that provides visibility into the performance and health of network devices and servers. It monitors routers, switches, firewalls, wireless networks, servers, virtual machines, and storage devices, offering insights to help ensure performance.
Key features of ManageEngine OpManager:
- Network monitoring: Provides real-time monitoring of device health, availability, and performance for any IP-based device.
- Server monitoring: Monitors physical and virtual servers (VMware, Hyper-V, Citrix, Nutanix) to ensure uptime and performance.
- Wireless network monitoring: Tracks wireless access points, routers, switches, and WiFi systems, offering insights into traffic and signal strength.
- WAN monitoring: Uses Cisco IPSLA technology to monitor WAN link availability and troubleshoot outages and performance issues.
- Storage monitoring: Monitors storage devices like fiber channel switches, storage arrays, and tape libraries, tracking capacity and growth trends.

Source: ManageEngine
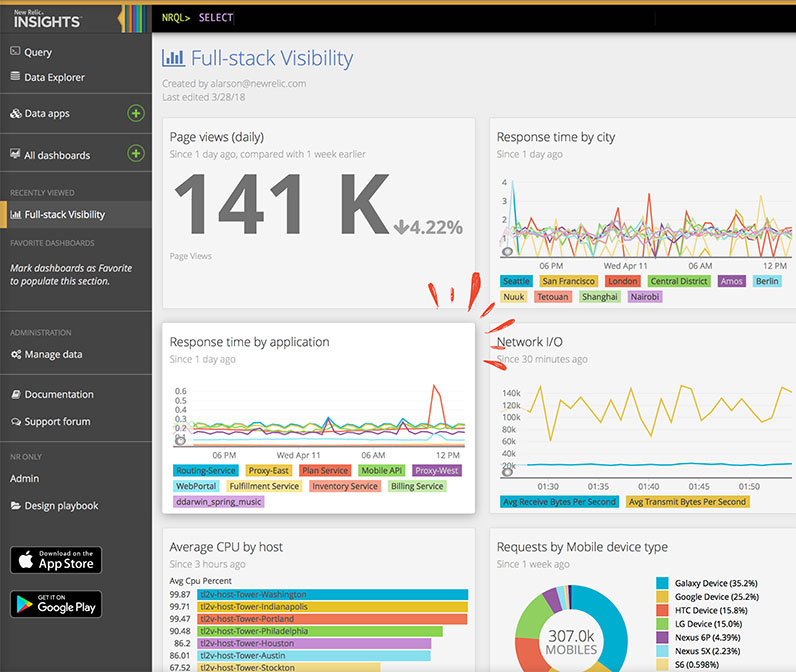
5. New Relic

New Relic is an observability platform that helps organizations monitor their technology stack in a unified view. By integrating infrastructure and application performance monitoring, New Relic enables IT teams to pinpoint issues, reduce downtime, and optimize resource usage.
Key features of New Relic:
- Unified infrastructure and APM monitoring: Monitors hosts, containers, VMs, and application performance metrics in one platform to detect under-provisioned resources.
- Real-time system health monitoring: Shows the status of hosts, events, and alerts in a high-density overview.
- Change tracking and impact analysis: Tracks application deployments and infrastructure changes to understand their impact on system performance.
- Dynamic performance correlation: Correlates drops in performance with real-time visualizations of host and application metrics.
- Automated root cause detection: Offers an automap feature to visualize entity relationships and uncover the sources of issues.
Source: New Relic
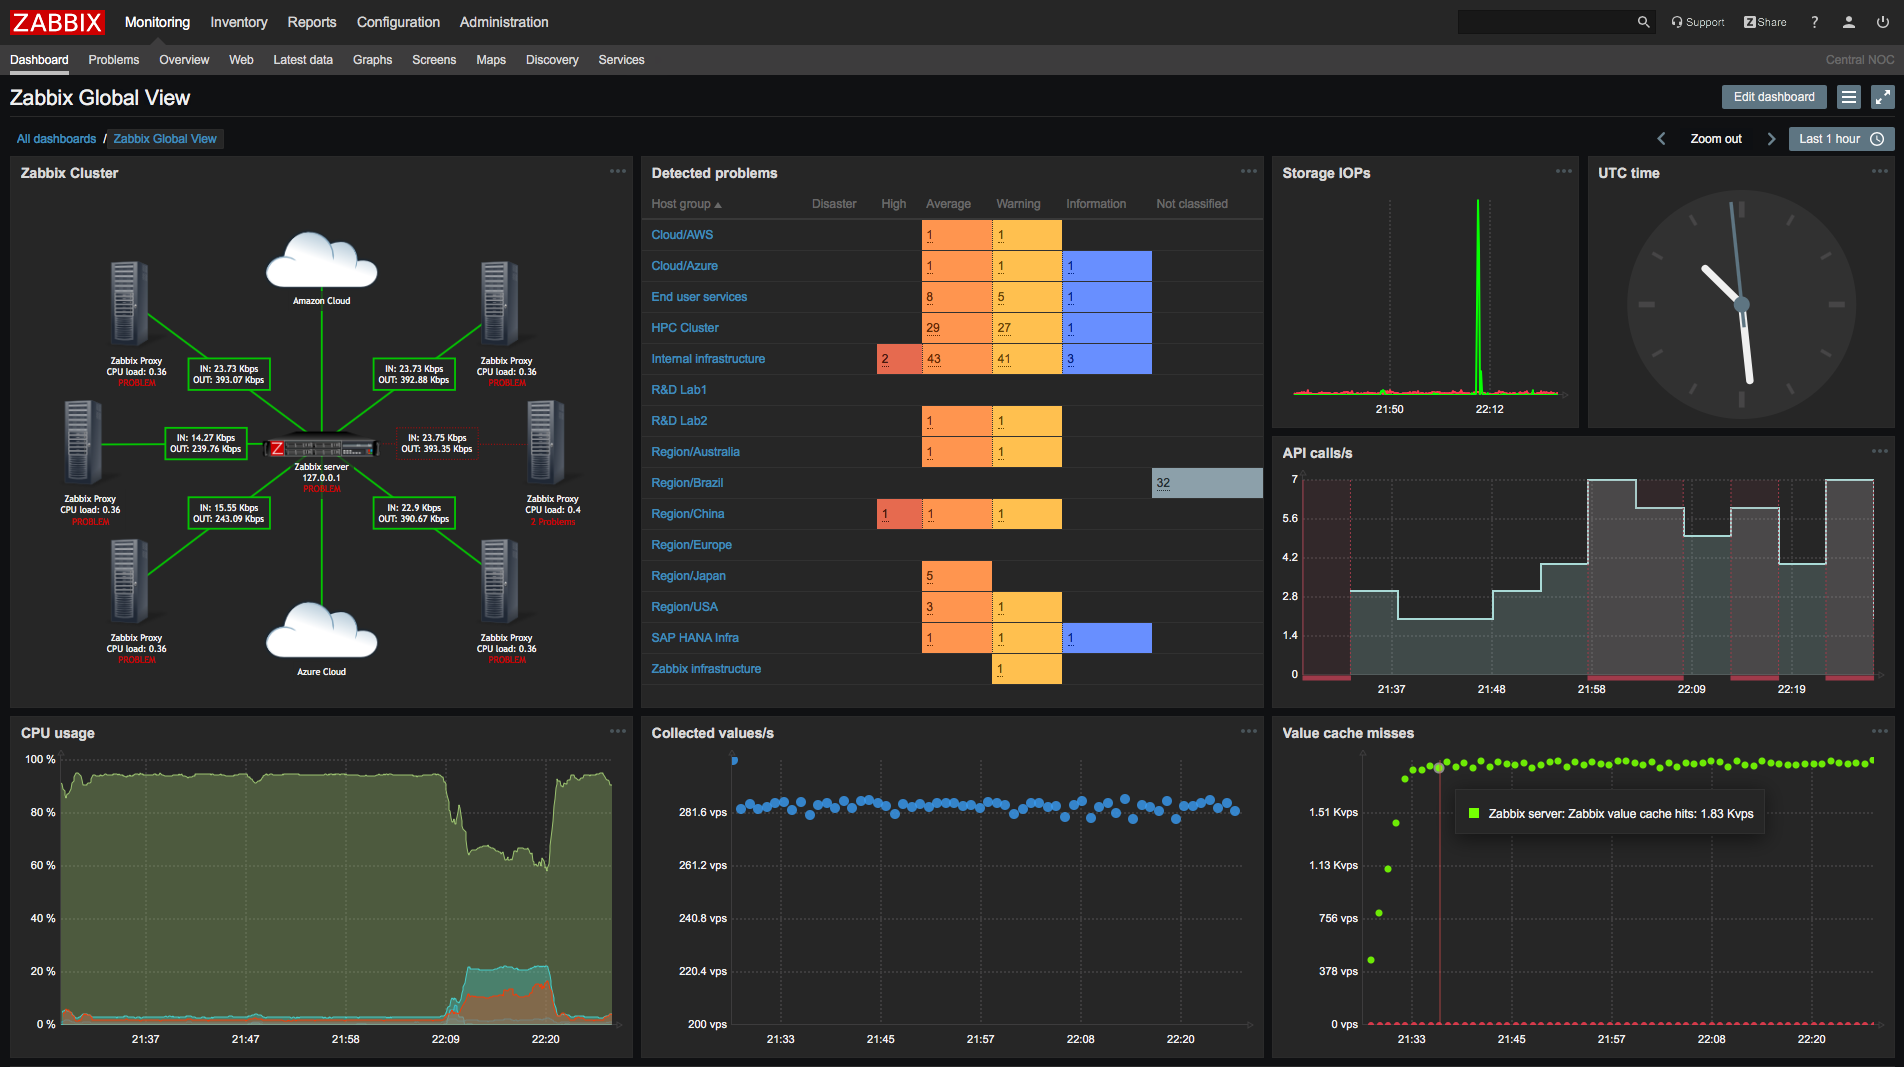
6. Zabbix

Zabbix is an open-source IT infrastructure monitoring tool that enables organizations to monitor, collect, and analyze data from a variety of sources, including network devices, cloud services, databases, and applications.
Available under the AGPL-3.0 license, Zabbix has over 4K stars on GitHub.
Key features of Zabbix:
- Flexible metric collection: Collects metrics from any source, including network devices, cloud services, virtual machines, operating systems, log files, databases, applications, and IoT sensors, with support for industry-standard protocols and APIs.
- Real-time problem detection: Uses thresholds, anomaly detection, machine learning, and trend prediction to detect and classify problems.
- Alerting: Sends alerts through messaging channels such as email, SMS, Slack, MS Teams, and PagerDuty, with customizable escalation scenarios and auto-remediation options.
- Customizable dashboards: Offers widget-based dashboards with drag-and-drop functionality, displaying real-time data, metrics, maps, and SLA information.
- Data visualization: Provides a variety of visualization tools, including graphs, geo-maps, infrastructure maps, and scheduled reports.

Source: Zabbix
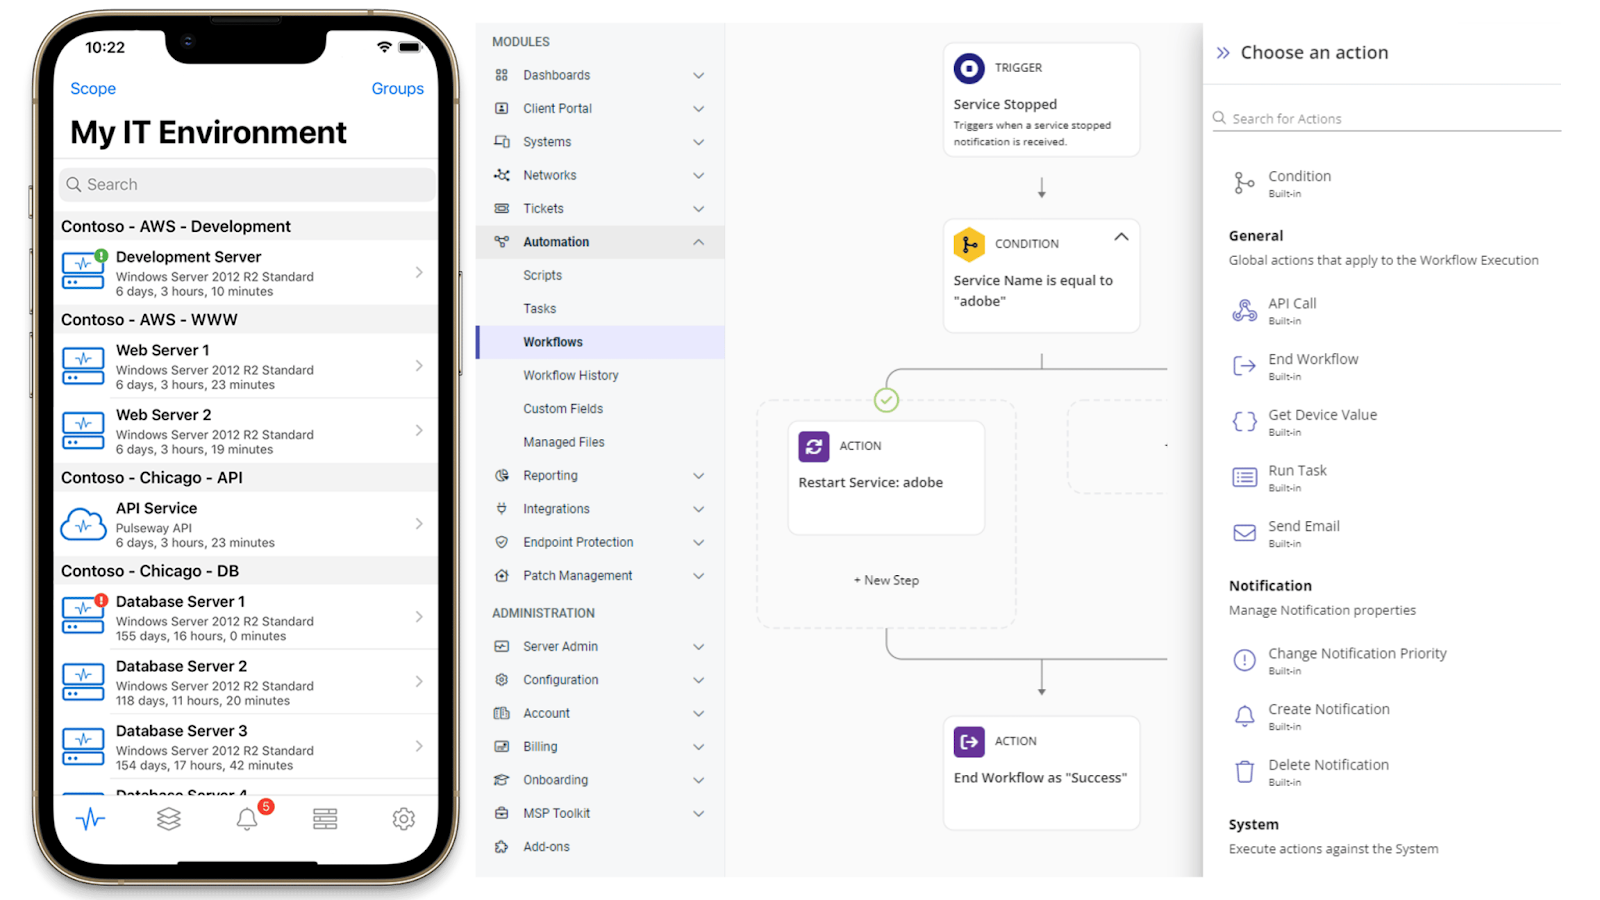
7. Pulseway

Pulseway is a remote monitoring and management (RMM) platform that enables IT departments and MSPs to manage, patch, and support all their endpoints from a single interface. It provides real-time visibility and control over devices, allowing teams to automate routine tasks, deploy patches, and enhance security across their IT infrastructure.
Key features of Pulseway:
- Remote monitoring & management: Offers real-time endpoint monitoring and control, giving MSPs and IT departments visibility into device health and performance across their networks.
- Patch management: Automates the identification, evaluation, and deployment of patches for improved endpoint security and compliance.
- Software deployment: Simplifies the process of deploying and managing software applications at scale.
- Monitoring & alerting: Detects changes in endpoint health and triggers context-rich alerts and tickets to enable proactive issue management.
- Scripting & automation: Allows IT teams to automate common tasks on-demand, on a schedule, or in response to device events.
Source: Pulseway
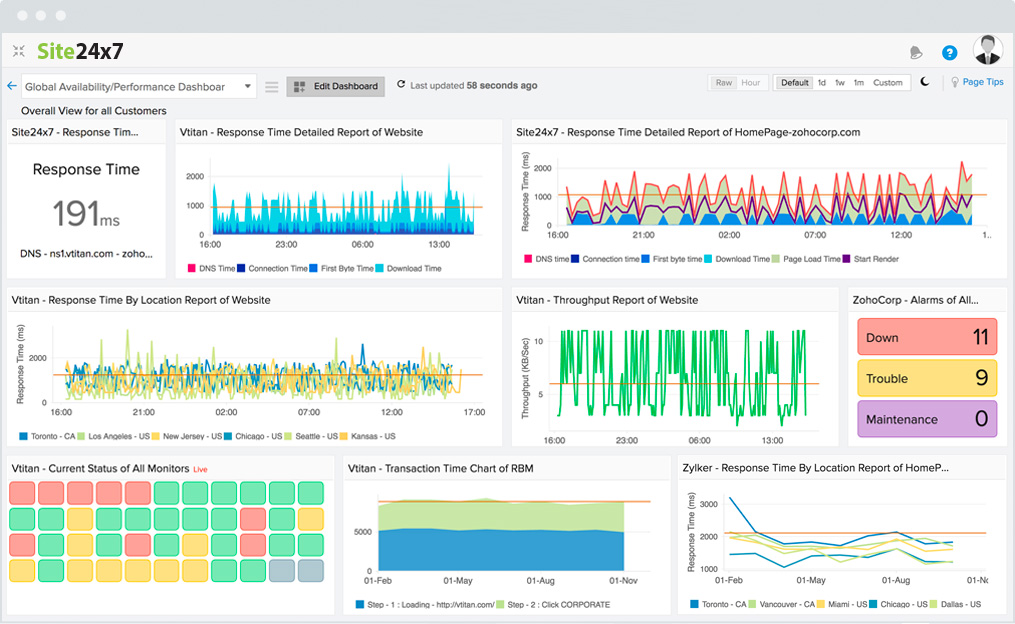
8. Site 24×7

Site24x7 is an AI-powered observability platform for DevOps and IT operations teams to monitor and optimize their IT infrastructure. It offers an all-in-one monitoring solution that covers cloud resources, servers, applications, websites, and networks.
Key features of Site24x7:
- Cloud monitoring: Provides visibility into cloud workloads and app performance on platforms like AWS, Azure, GCP, and VMware.
- Server monitoring: Monitors server health and performance across Windows, Linux, FreeBSD, and virtualization platforms with root cause analysis.
- Application performance monitoring: Tracks application errors and performance for Java, .NET, Ruby, PHP, Node.js, and mobile platforms.
- Website monitoring: Monitors internet services, REST APIs, and web services from over 130 global locations.
- Real user monitoring: Analyzes real user experiences by segmenting performance based on browser, platform, location, and ISP.
Source: Site24x7
9. Atera

Atera is an IT management platform powered by Action AI™, used to manage, patch, and secure every endpoint. It provides remote monitoring and management (RMM), helpdesk ticketing, patch management, and network discovery capabilities.
Key features of Atera:
- Remote monitoring and management: Monitors, identifies, and helps resolve issues across unlimited devices from any location, at a fixed cost.
- AI Copilot: Leverages AI to analyze, summarize, and respond to issues quickly, assisting technicians in resolving problems efficiently.
- AI Autopilot: Provides 24/7 AI-powered support, handling Tier-1 support tasks automatically.
- Helpdesk and ticketing: Automates workflows and simplifies ticket management with AI to improve response times and customer satisfaction.
- Remote access: Allows users to access and troubleshoot devices tools like AnyDesk, Splashtop, TeamViewer, or ScreenConnect.
Source: Atera
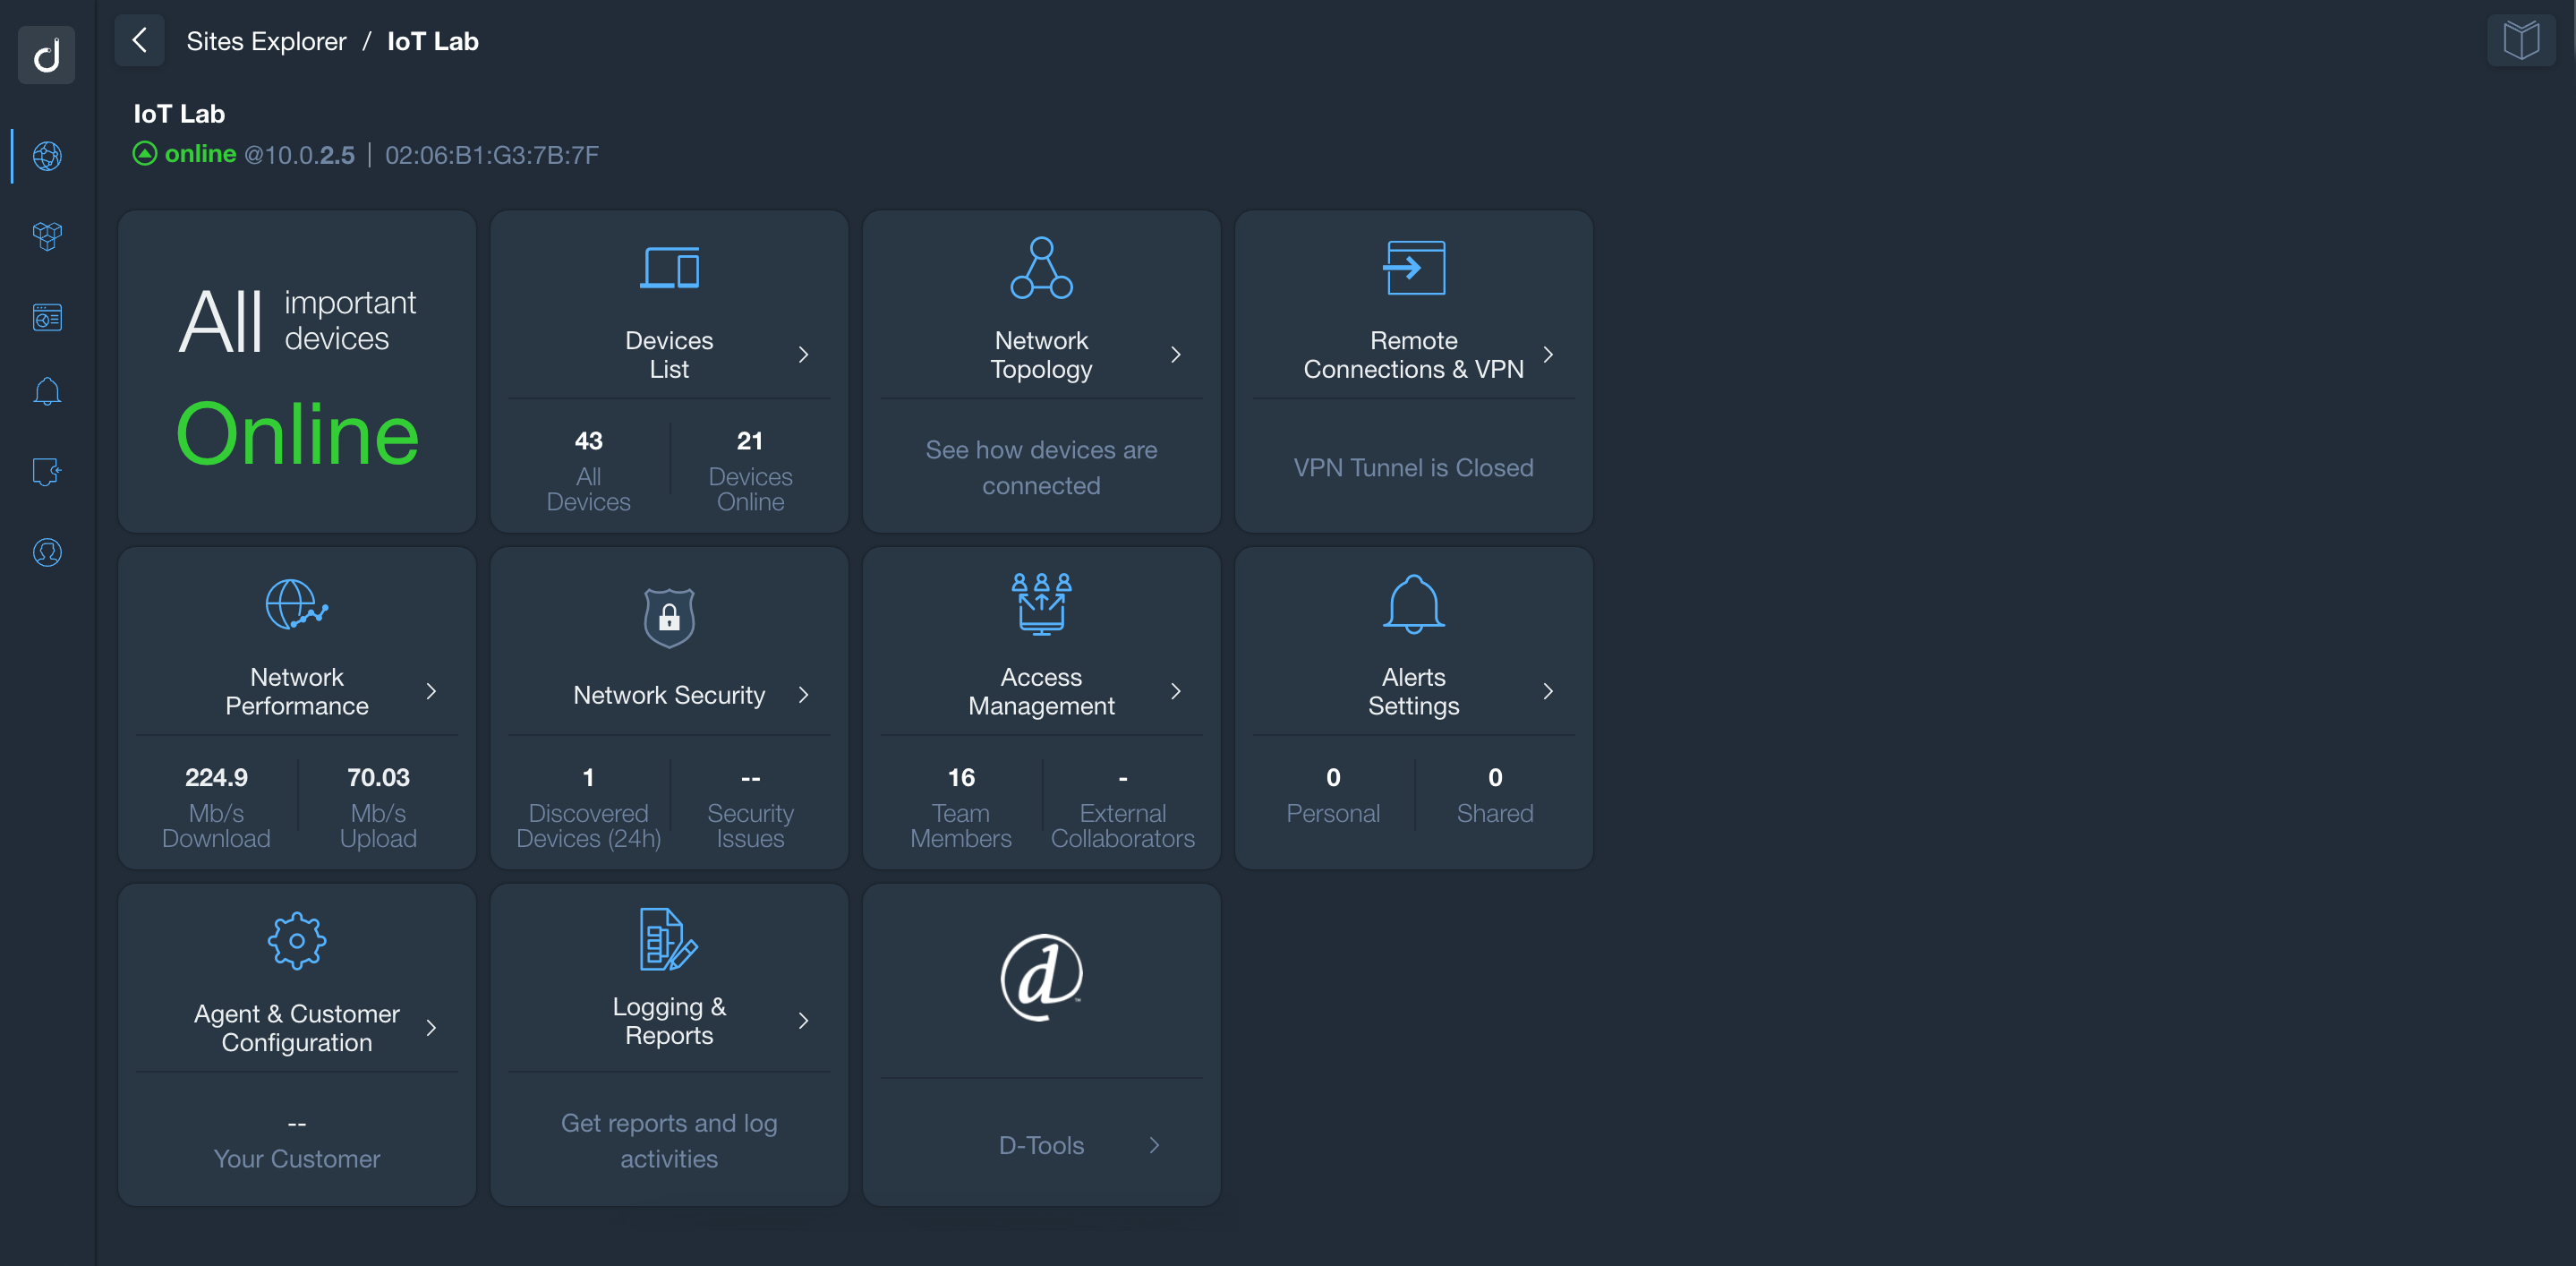
10. Domotz
Domotz is a cloud-based network monitoring platform for MSPs, system integrators, IT professionals, and security teams to gain visibility and control over their digital assets. It enables users to monitor networks and IT infrastructures remotely from a unified dashboard.
Key features of Domotz:
- Inventory & asset identification: Automatically discovers and identifies all devices in a network with real-time updates. Associates devices with their respective managed switches.
- Management & maintenance: Helps manage network configurations with versioning and backups, enabling secure remote troubleshooting via HTTP, HTTPS, VPN, and RDP.
- Monitoring & visibility: Monitors network performance, device statistics, response times, and SNMP metrics in real time. Visualizes network topologies automatically and lets users set up customizable scripts for deeper monitoring of critical devices.
- Security & awareness: Improves network security with automated scans for new devices, external port scanning, and real-time alerts for potential vulnerabilities. Integrates with identity management tools for secure access, supporting 2FA and SSO/SAML.
- Dynamic dashboards: Allows users to customize dashboards to visualize key metrics, monitor selected devices or sensors, and track performance across WAN and LAN networks.

Source: Domotz
Conclusion
Network monitoring solutions are essential for maintaining the health and performance of IT infrastructures. These tools offer critical features such as real-time visibility, alerting, and device management, which help organizations proactively identify and resolve network issues. With the ability to monitor diverse systems, optimize resources, and enhance security, businesses can ensure that their networks remain stable, efficient, and secure, enabling smoother operations and minimizing downtime.
While many tools offer comprehensive features, the most effective solutions are those that offer deep visibility, ease of use, and scalability, making them ideal for organizations with complex environments. Tools like Faddom, which emphasize minimal resource impact and robust security, provide a solid foundation for optimizing IT infrastructure and reducing disruptions.
Learn more about Faddom for application mapping or start a free trial to the right

