Introducing Zabbix and PRTG
Zabbix and PRTG are network monitoring solutions, but Zabbix is an open-source, scalable, and customizable platform for complex, enterprise-level environments, while PRTG is a commercial, all-in-one solution favored by small-to-medium businesses for its ease of use and agentless monitoring on Windows platforms.
Key differences include:
- Licensing and cost: Zabbix is open-source and free to use, offering cost savings, whereas PRTG follows a commercial model with a free version that has limitations, requiring paid licenses for full functionality.
- Ease of use & complexity: PRTG is known for its user-friendly interface and simple setup, making it suitable for users with less technical background. Zabbix, with its powerful features and configuration options, has a steeper learning curve but offers more flexibility for complex scenarios.
- Customization & flexibility: Zabbix provides extensive customization and fine-tuning of monitoring parameters, making it highly adaptable for specific and complex needs. PRTG is a comprehensive package but may have limitations in scenarios requiring highly customized monitoring.
- Monitoring method: Zabbix primarily uses agents installed on target systems for detailed monitoring but can also perform limited functions without them. PRTG is largely agentless, relying on standard protocols like SNMP and HTTP to monitor devices.
- Operating system support: Zabbix runs on various operating systems, including Linux, Mac OS, and Solaris, offering broader platform compatibility. PRTG’s core and probes are Windows-based, although it can monitor cloud-based resources.
- Scalability: Zabbix is known for its high scalability to handle very large enterprise environments with millions of metrics. PRTG also scales but requires more careful planning as the number of sensors increases.
When to choose Zabbix:
You need an open-source solution to minimize costs. You require highly granular and customizable monitoring for complex systems. You have a larger enterprise environment and need enterprise-level scalability. Your IT team has the technical expertise to manage a powerful, feature-rich system.
When to choose PRTG:
You prefer an easy-to-use, all-in-one monitoring solution with a gentle learning curve. You are monitoring an IT infrastructure predominantly on Windows systems. You need agentless monitoring for simplicity and quicker setup. You are a small-to-medium-sized business prioritizing convenience and comprehensive out-of-the-box features.
Table of Contents
ToggleZabbix vs. PRTG: Key Differences
1. Licensing and Costs
Zabbix is a completely open-source platform, available at no cost regardless of the number of monitored devices, metrics, or users. This makes it attractive for organizations seeking to implement monitoring without incurring licensing fees. Although the software is free, operational costs may arise from deployment, training, and ongoing administration, especially in larger environments.
Organizations that require technical assistance can purchase commercial support from Zabbix LLC or certified partners. This offers access to expert help, updates, and troubleshooting while maintaining the benefits of an open and customizable system.
PRTG follows a commercial licensing model, where pricing is based on the number of sensors in use. A sensor is defined as one aspect of monitoring on a device (e.g., CPU load, memory usage, or disk I/O). The free version supports up to 100 sensors, which is enough for small networks. For larger deployments, licenses must be purchased in increments (e.g., 500, 1000, 2500 sensors, etc.) with pricing increasing accordingly.
Each license includes vendor support, updates, and access to the full feature set. This model suits organizations looking for a plug-and-play experience with guaranteed vendor support, but the cost can grow rapidly in sensor-heavy environments. Over time, the total cost of ownership may be significantly higher than Zabbix, especially in large or complex infrastructures.
2. Ease of Use and Complexity
Zabbix has historically had a reputation for being complex and technical, but this has changed significantly in recent versions. The interface is now more modern and visually polished, offering dashboards, maps, graphs, and widgets to present monitoring data in a user-friendly way. Despite these improvements, Zabbix still requires a learning curve, especially for users new to monitoring systems.
Configuration of hosts, items, triggers, and user permissions involves many layers and dependencies. However, for experienced users and administrators, Zabbix’s UI offers a high level of control. The system’s layout is logically organized, and nearly every element can be customized.
PRTG’s user interface is designed for simplicity and ease of use. The web-based dashboard includes drag-and-drop components, dynamic visualizations, and intuitive navigation. A setup wizard guides users through initial configuration, and many sensors can be deployed with minimal input.
For users with limited technical knowledge, PRTG’s interface is accessible, enabling them to deploy and manage monitoring without deep expertise. The mobile app provides additional convenience, allowing administrators to monitor systems, receive alerts, and acknowledge alarms from their smartphones or tablets.
3. Customization & Flexibility
Zabbix provides deep customization across all layers of the monitoring stack. Users can define custom items, triggers, graphs, and templates, tailoring them to specific devices, applications, or business logic.
Advanced features like user macros, calculated items, and low-level discovery rules allow Zabbix to dynamically adapt to complex, changing environments. Integration with external systems is highly flexible through APIs, scripts, and webhooks, supporting advanced use cases like automated incident response or custom dashboards.
PRTG supports customization primarily through sensor configuration and threshold settings. While users can define custom sensors using scripting (e.g., PowerShell, Python), the system favors prebuilt templates and GUI-based configuration. This makes customization more accessible but limits its depth.
PRTG’s flexibility is useful for typical infrastructure monitoring needs but may fall short for highly specialized or dynamic environments requiring programmatic control or integration with external automation tools.
4. Monitoring Method
Zabbix supports both agent-based and agentless monitoring. The agent-based method provides detailed performance data and supports custom scripts and user parameters for extended monitoring.
Agentless options include SNMP, IPMI, JMX, HTTP, SSH, and more, which are useful for devices where agents can’t be installed. This hybrid approach gives Zabbix flexibility to cover diverse infrastructure setups with granular control.
PRTG primarily uses agentless monitoring, relying on standard protocols like SNMP, WMI, HTTP, and NetFlow. This simplifies deployment, especially in Windows-heavy environments, but can limit access to low-level system data that agents typically provide.
While PRTG does support custom scripts for deeper insight, the absence of a native agent means some advanced monitoring scenarios may require workarounds or external tools.
5. Operating System Support
Zabbix is platform-agnostic and supports multiple operating systems for both servers and agents, including Linux, BSD, Solaris, Windows, and macOS. This broad compatibility makes it a strong choice for heterogeneous environments. Its web interface is also browser-agnostic and accessible from most modern browsers.
PRTG is built around the Windows ecosystem. Its core server and probes must run on Windows, although it can monitor devices running other operating systems via protocols like SNMP and SSH. While this simplifies Windows-based deployments, it limits native support for non-Windows environments.
6. Scalability
Zabbix employs a distributed, client-server architecture that is highly scalable. The main server handles central configuration and data processing, while Zabbix agents collect metrics from monitored devices. For larger or distributed environments, proxy servers can be deployed to offload data collection and buffering. This reduces the load on the main server and supports high-latency or remote locations. The result is a system that scales horizontally and can support thousands of monitored hosts and millions of metrics with the appropriate hardware and tuning.
This architecture makes Zabbix suitable for large enterprises, service providers, and multi-site organizations that need centralized monitoring across complex infrastructure. High availability setups are also supported, including failover configurations and redundancy for critical components.
PRTG uses an all-in-one architecture where the core server manages the UI, database, and monitoring engine. This design simplifies deployment but introduces limitations at scale. For extended reach, PRTG supports Remote Probes, which collect data from different networks or geographical locations and send it back to the main server. While this improves flexibility, it doesn’t match the scalability or architectural separation offered by Zabbix.
In small and medium environments, PRTG performs well, offering quick deployment and minimal management overhead. However, in larger environments or high-throughput scenarios, performance bottlenecks may arise, and scaling may require adding more servers or distributing sensors more strategically.
PRTG vs. Zabbix: How to Choose?
Choosing between Zabbix and PRTG depends on your organization’s size, technical expertise, and specific monitoring needs. Both tools can deliver visibility, but their design philosophies and operational models suit different use cases.
Ease of deployment and maintenance:
- PRTG: Suitable for teams needing rapid setup and minimal configuration. Its wizard-driven interface and preconfigured sensors make it accessible for users with limited monitoring experience.
- Zabbix: Requires more upfront planning and technical knowledge. Best suited for teams comfortable with manual configuration and tuning.
Customization and flexibility:
- Zabbix: Offers customization with support for complex triggers, macros, templates, and integrations. Preferred in environments where monitoring logic must align closely with business processes.
- PRTG: More limited in customization depth but provides quick value with default templates and built-in sensors.
Scalability and architecture:
- Zabbix: Scales efficiently using proxies and distributed architecture. Fits large enterprises or multi-site organizations with thousands of monitored assets.
- PRTG: Works well for small to medium-sized environments. Remote Probes can extend coverage, but high-scale deployments may require significant hardware and license management.
Cost and licensing model:
- Zabbix: Completely free and open-source, with optional paid support. Suitable for budget-conscious teams or those preferring open tooling.
- PRTG: Commercial with tiered sensor-based licensing. Offers built-in support but can become costly as the number of metrics grows.
Integration ecosystem:
- Zabbix: Supports wide integration through APIs, scripts, and plugins. Better for organizations with complex workflows and automation pipelines.
- PRTG: Focuses on popular integrations and ease of use. May require custom workarounds for niche systems or advanced data flows.
Team expertise and staffing:
- PRTG: Better fit for smaller IT teams or organizations without dedicated monitoring experts.
- Zabbix: Fits teams with experience in infrastructure, scripting, and performance tuning who can maintain and extend the system.
The right choice often comes down to trade-offs between simplicity and power. PRTG excels when ease of use is a priority, while Zabbix offers greater control and extensibility for demanding environments.
Related content: Read our guide to Zabbix alternatives
Faddom Application Dependency Mapping: the Missing Piece of Network Monitoring
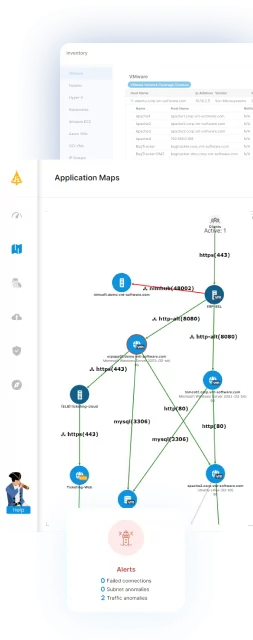
Both Zabbix and PRTG are effective in monitoring performance and infrastructure health, but they do not provide complete visibility into the interconnection of servers and applications. Faddom addresses this issue with automated, agentless application dependency mapping, which reveals every connection and communication path across hybrid and multicloud environments. This context helps teams understand the real impact of outages, prevent misconfigurations, and avoid disruptions caused by hidden dependencies that traditional monitoring tools cannot uncover.
Faddom seamlessly integrates with Zabbix, enhancing dashboards with real dependency maps that illustrate both upstream and downstream relationships. By combining monitoring metrics with accurate application topology, organizations can improve root-cause analysis, accelerate troubleshooting, and make more informed decisions when planning changes, scaling infrastructure, or migrating workloads.
To discover how Faddom can complete your monitoring stack, please fill out the form on the right to book a demo.


