What Is Zabbix?
Zabbix is an open-source monitoring tool designed for tracking the status and performance of a wide range of IT components, including networks, servers, virtual machines, and cloud services. It provides real-time monitoring, alerting, and customizable dashboards, making it suitable for both small and large environments.
Zabbix supports various data collection methods such as SNMP, IPMI, and agent-based monitoring, which makes it highly adaptable to different infrastructure needs. Zabbix enables teams to automate monitoring tasks and respond proactively to outages or performance degradation.
Popular Zabbix alternatives include commercial tools like Datadog, Nagios, PRTG, and SolarWinds, and open-source options like Prometheus and LibreNMS. The best alternative depends on your needs, such as your budget (open-source vs. paid), the complexity of your environment, and the types of monitoring you require, such as network, server, or application monitoring.
Why Look for Zabbix Alternatives?
While Zabbix offers extensive flexibility and monitoring features, many users encounter significant hurdles that impact usability and efficiency:
- Time-consuming and complex setup process: Zabbix often requires manual configuration, custom scripting, and detailed planning before it becomes operational, which can be a major drawback for teams looking for quick deployment or low-maintenance tools.
- Steep learning curve: New users often find the platform unintuitive, requiring extensive documentation review or community support just to understand basic functionality. This makes onboarding slow and adds friction for teams without prior monitoring experience.
- Limited automation compared to newer solutions: Tasks like auto-discovery and integration with cloud services usually need to be scripted manually. This lack of built-in automation increases the workload and slows down the ability to adapt to dynamic environments.
- Latency: Some users also report delays in real-time data visibility, which can be critical in environments where rapid response is essential. In addition, monitoring modern web applications and APIs often requires significant customization, as Zabbix lacks native support for these use cases.
For teams dealing with slow workflows, manual configurations, or poor fit for modern infrastructure, these challenges can outweigh the benefits, prompting the search for more user-friendly and automation-ready alternatives.
Notable Zabbix Alternatives
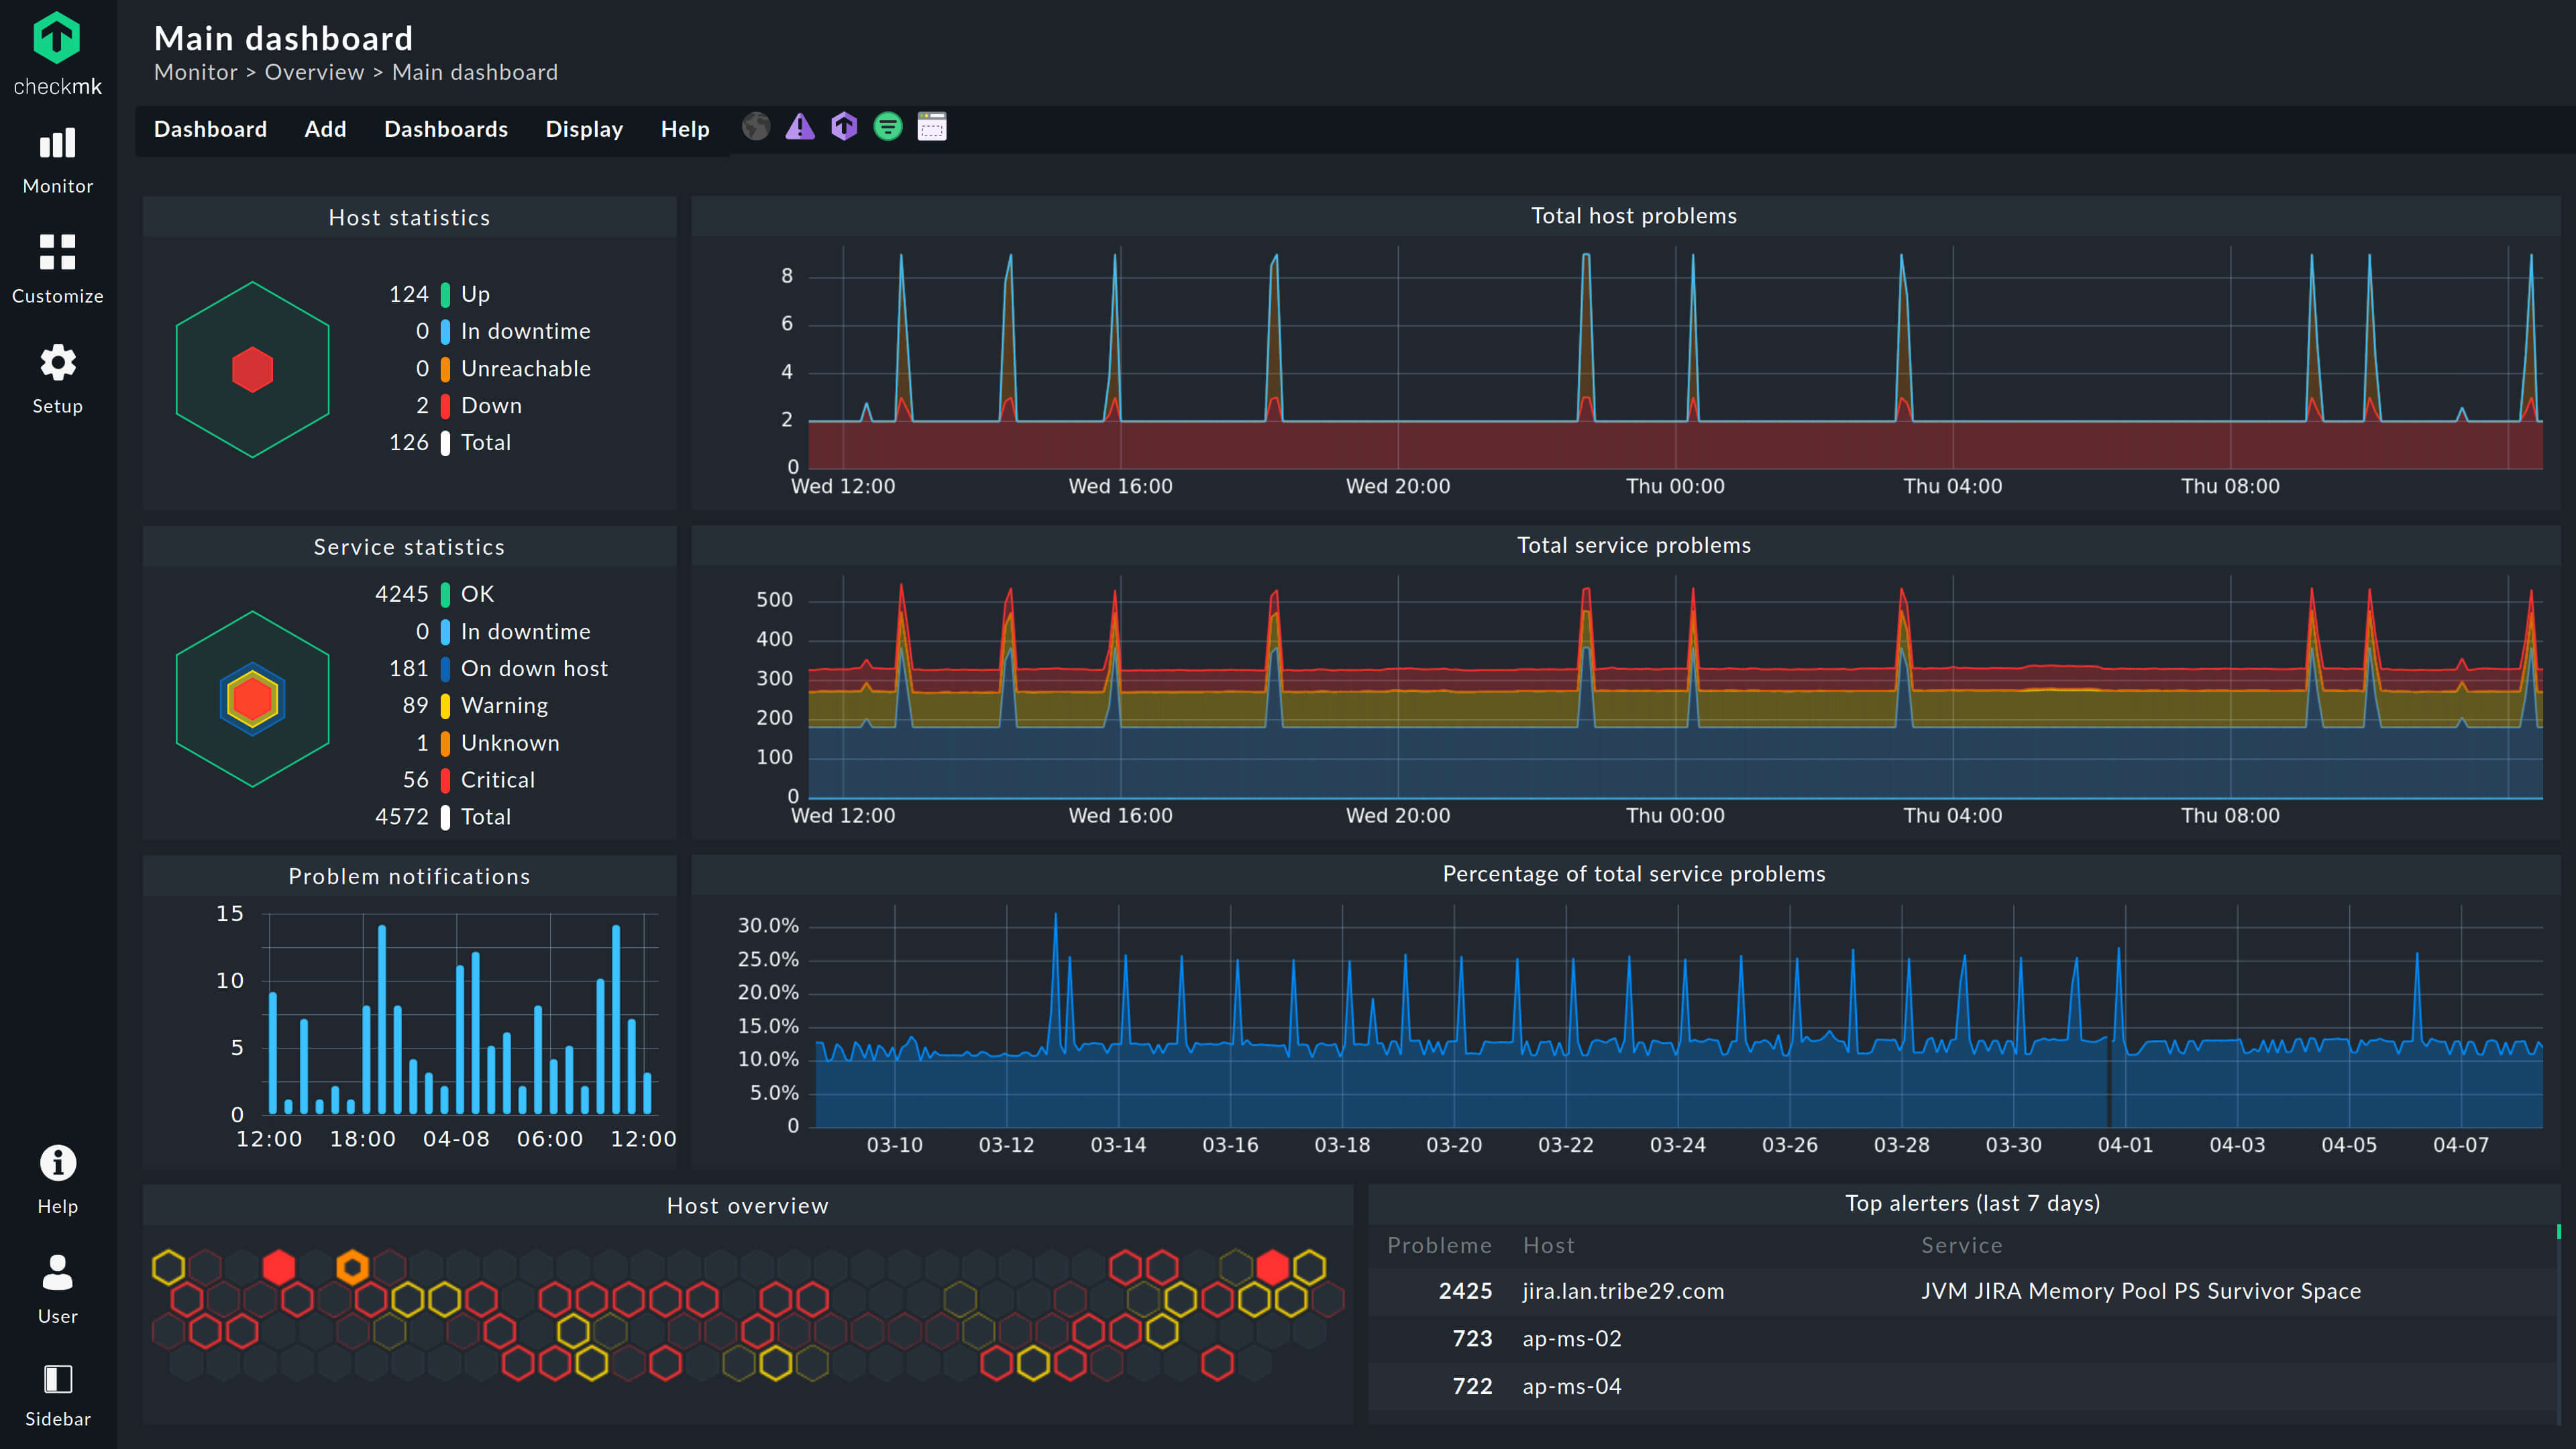
1. Checkmk

Checkmk offers a monitoring solution that focuses on automation, application-level visibility, and ease of deployment. With version 2.4, it extends beyond traditional infrastructure monitoring by integrating OpenTelemetry for application insights, synthetic monitoring for real user perspective testing, and simplified cloud setup with Quick Setup.
Key features include:
- OpenTelemetry integration: Collects application performance metrics and maps them to hosts for root cause analysis.
- Synthetic monitoring: Runs automated end-to-end tests from the user’s perspective to validate both availability and functionality.
- KPI monitoring: Tracks critical steps and keywords in synthetic tests, turning them into service indicators.
- Quick setup for cloud monitoring: Simplifies onboarding for AWS, Azure, and GCP resources with guided configuration and validation.
- Dynamic host management: Automatically adapts monitoring to infrastructure changes in Kubernetes, VMs, or cloud workloads.
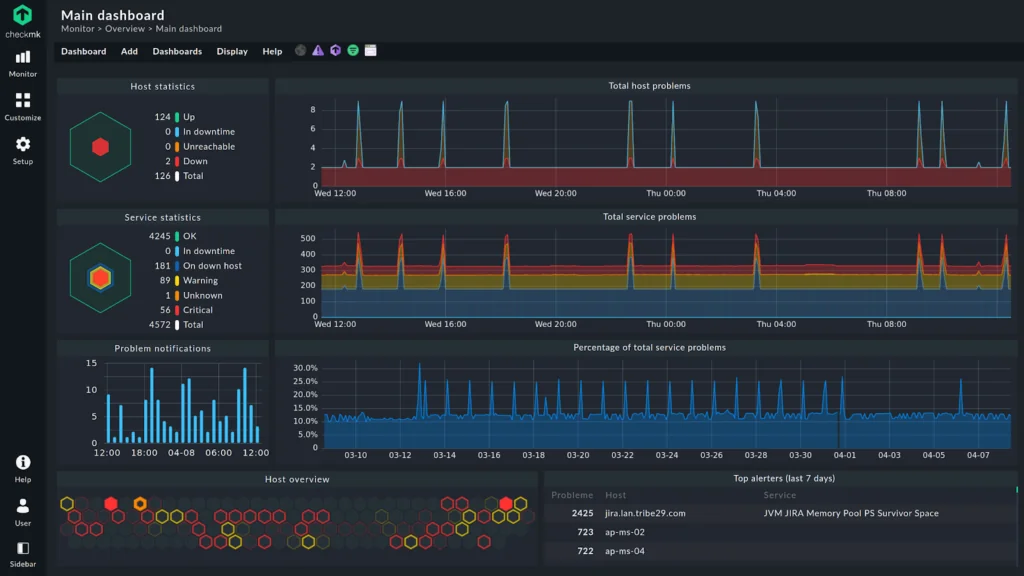
Source: Checkmk
2. Paessler PRTG
Paessler PRTG is a monitoring platform that gives IT teams visibility into their infrastructure. It covers networks, servers, applications, databases, and cloud services. With customizable dashboards, real-time alerts, and support for diverse monitoring methods like SNMP and SQL queries, PRTG helps teams detect issues early and analyze performance.
Key features include:
- Network monitoring: Tracks availability, traffic, and performance across all connected systems and devices.
- Database monitoring: Uses configurable sensors and SQL queries to monitor specific datasets and performance metrics.
- Application monitoring: Provides statistics and health checks for business-critical applications.
- Cloud monitoring: Centralizes monitoring of cloud services to ensure uptime and performance across providers.
- Server monitoring: Monitors servers in real time for availability, capacity, and reliability.
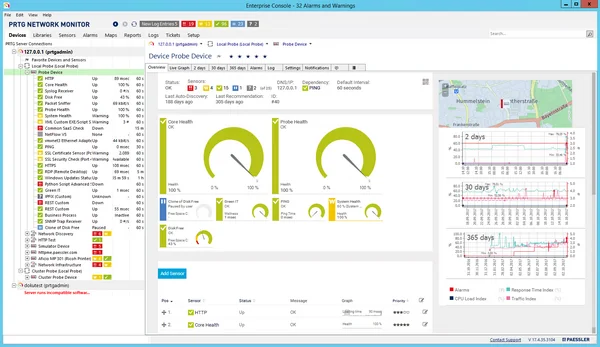
Source: Paessler
Related content: Read our guide to Zabbix vs PRTG
3. Datadog

Datadog provides a unified approach to monitoring networks across cloud, hybrid, and on-premises environments. Its Network Monitoring solution consolidates traffic visibility, device metrics, and application-level data into a single view, allowing teams to troubleshoot faster and reduce mean time to resolution.
Key features include:
- Cloud network monitoring (CNM): Tracks traffic between cloud-native microservices and monitors connectivity performance across cloud and on-prem endpoints.
- Network device monitoring (NDM): Provides unified visibility into physical and virtual devices with broad vendor support.
- Hop-by-hop traffic view: Visualizes packet paths across hybrid and wide area networks, highlighting latency and packet loss.
- Service-to-service monitoring: Correlates inter-application traffic with underlying infrastructure for faster troubleshooting.
- Hybrid and multi-cloud coverage: Monitors endpoints across cloud, on-premises, containers, VMs, and serverless environments.

Source: Datadog
Related content: Read our guide to Zabbix vs Datadog (coming soon)
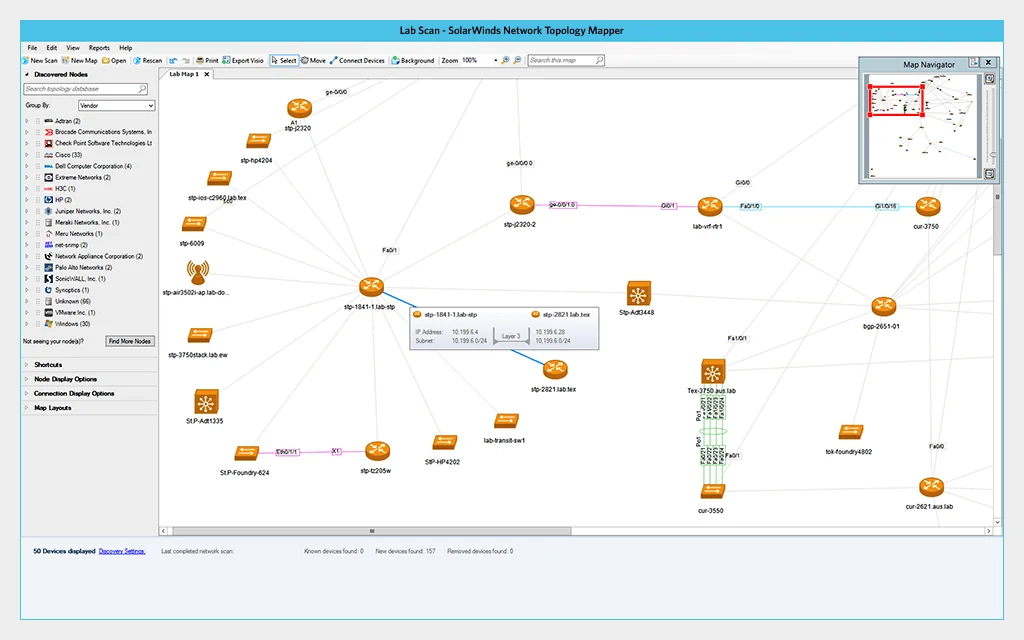
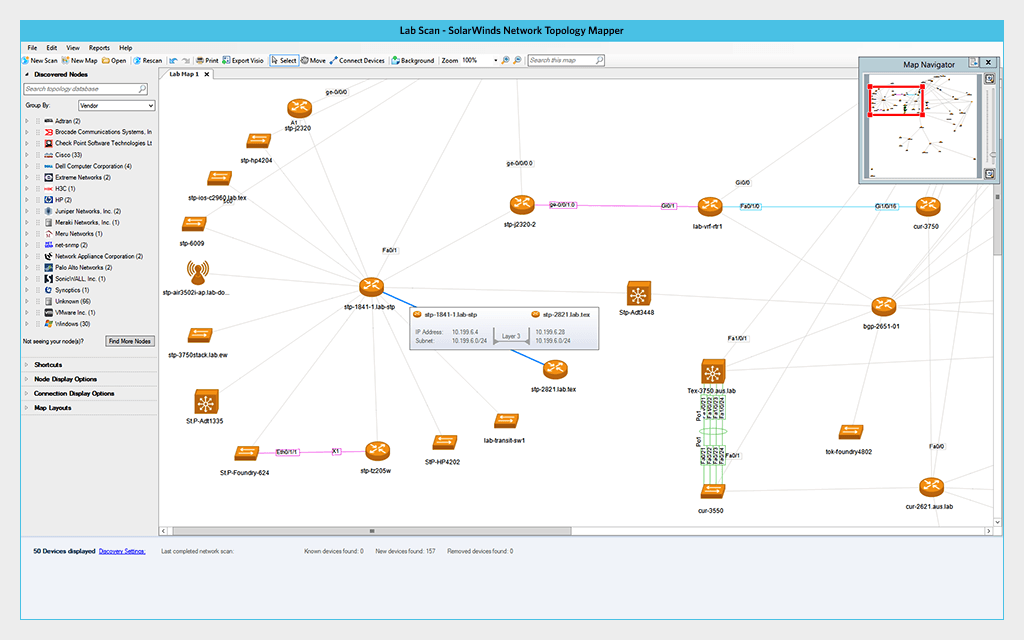
4. SolarWinds Network Performance Monitor

SolarWinds Network Performance Monitor provides visibility into hybrid IT environments, enabling detection and resolution of network issues before they disrupt operations. Built on Orion modules and enabled by AIOps, it combines monitoring, mapping, and performance analysis to optimize uptime and resilience.
Key features include:
- Availability monitoring: Continuously tracks network performance to detect and resolve issues before they affect operations.
- NetPath™ visualization: Provides end-to-end visibility of critical network paths for faster root cause attribution.
- Mapping: Automatically generates maps of on-premises and hybrid networks for simplified monitoring and management.
- PerfStack™ analysis: Correlates performance metrics for detailed troubleshooting and optimization.
- Alerting: Supports anomaly detection and AI-powered alerts to reduce response times.
Source: SolarWinds
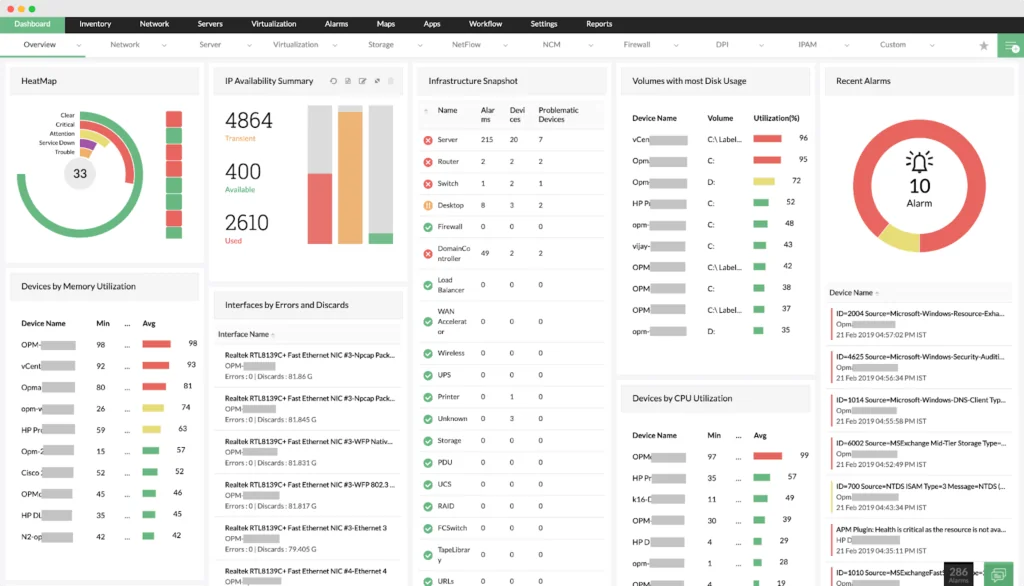
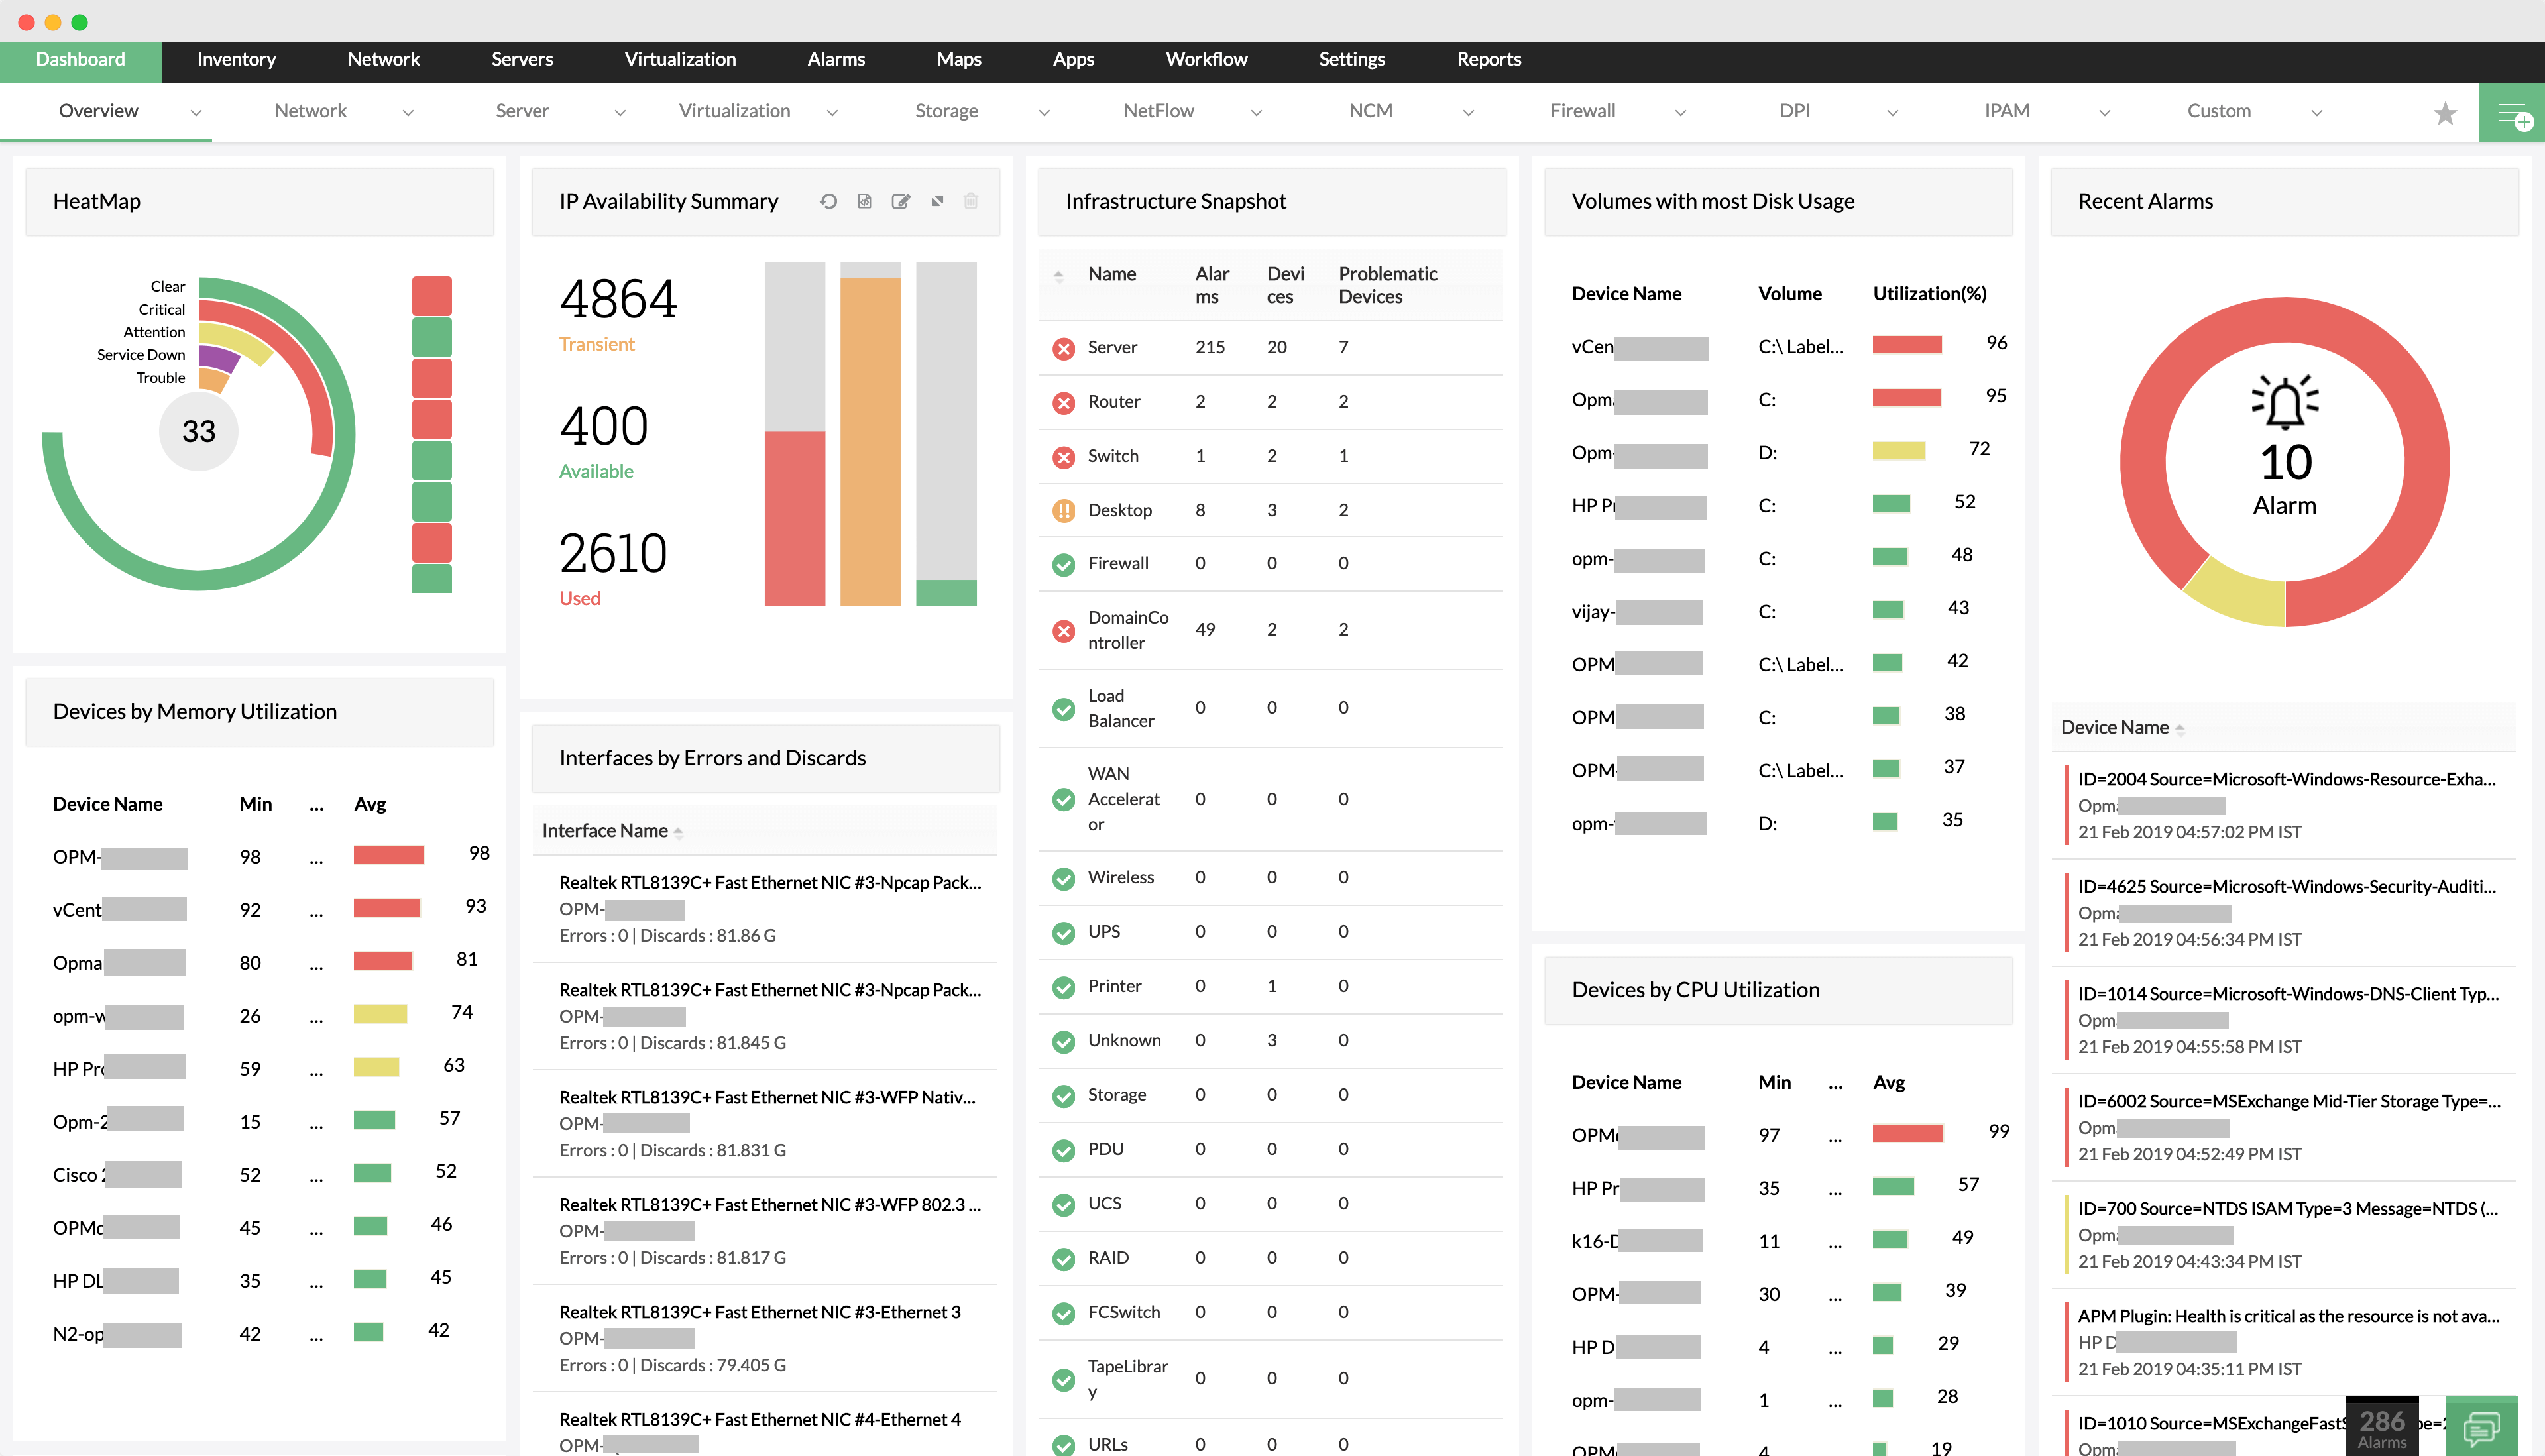
5. ManageEngine OpManager

ManageEngine OpManager is an integrated network and server monitoring solution that gives IT teams visibility into performance, availability, and health across devices, servers, applications, and storage systems. It eliminates the need for multiple monitoring tools by consolidating data into one platform, enabling faster troubleshooting and root cause analysis.
Key features include:
- Network monitoring: Monitors the health and performance of all IP-based devices in real time.
- Server monitoring: Tracks physical and virtual servers, including VMware, Hyper-V, Citrix, Xen, and Nutanix HCI.
- Wireless monitoring: Provides detailed stats on WiFi access points, routers, switches, and wireless traffic.
- WAN monitoring: Uses Cisco IPSLA technology to monitor WAN availability and troubleshoot performance issues.
- Cisco ACI monitoring: Discovers and monitors the entire Cisco ACI infrastructure, including fabrics, tenants, and endpoint groups.
Source: ManageEngine
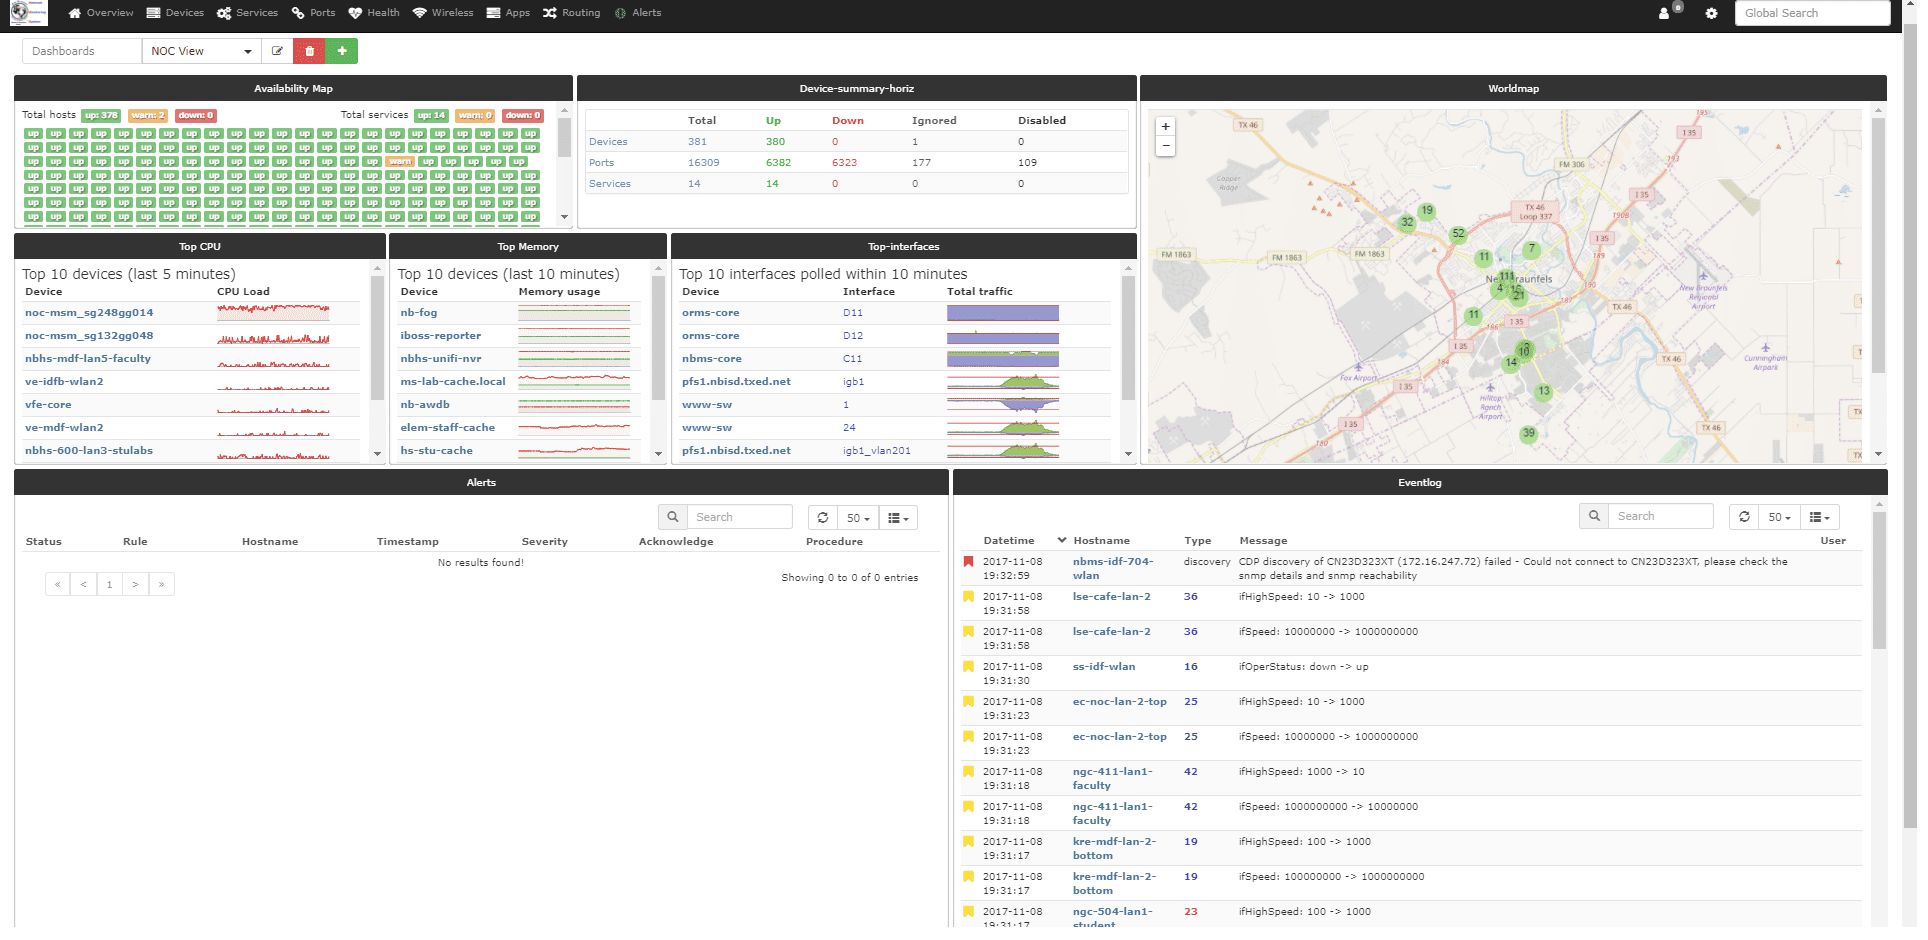
6. LibreNMS

LibreNMS is an open-source network monitoring platform for flexibility, scalability, and ease of use. It supports a range of devices and protocols, making it suitable for diverse IT environments. With automatic network discovery, distributed polling, customizable alerting, and a full API, LibreNMS enables teams to monitor performance, track usage, and automate workflows.
Key features include:
- Automatic discovery: Identifies network devices and topology using CDP, FDP, LLDP, OSPF, BGP, SNMP, and ARP.
- Customizable alerting: Flexible notification system with support for email, IRC, Slack, and other channels.
- API access: Full-featured API to manage configurations, retrieve data, and generate graphs.
- Billing system: Creates bandwidth usage or transfer-based billing for monitored ports.
- Automatic updates: Keeps the system current with the latest bug fixes and features.

Source: LibreNMS
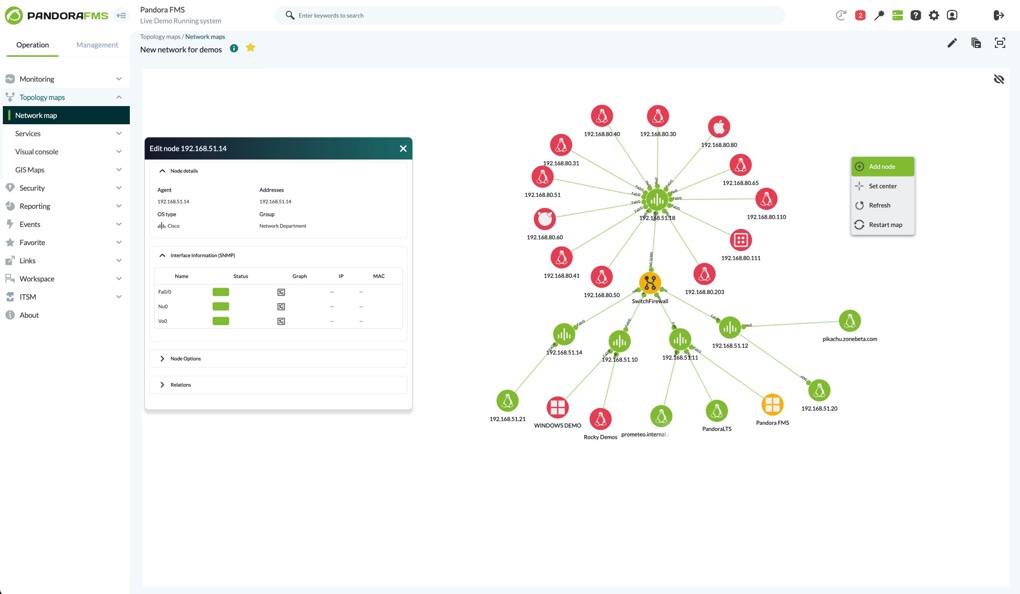
7. Pandora FMS
Pandora FMS is a monitoring and observability platform that aims to cover the full spectrum of IT operations. Beyond traditional infrastructure monitoring, it extends into areas like configuration management, IT service management, remote control, security (SIEM), and log analysis.
Key features include:
- Network monitoring: Automatically discovers devices and visualizes complete topologies with interactive maps.
- Server monitoring: Supports heterogeneous environments, including IBM-i, Unix, Windows, Linux, and Android.
- Application monitoring: Provides tailored monitoring for diverse applications and data sources to prevent user impact.
- Cloud monitoring: Consolidates visibility across SaaS, PaaS, and IaaS platforms, including AWS, Azure, and Google Cloud.
- UX monitoring: Measures application performance step by step to track real user experience.

Source: Pandora
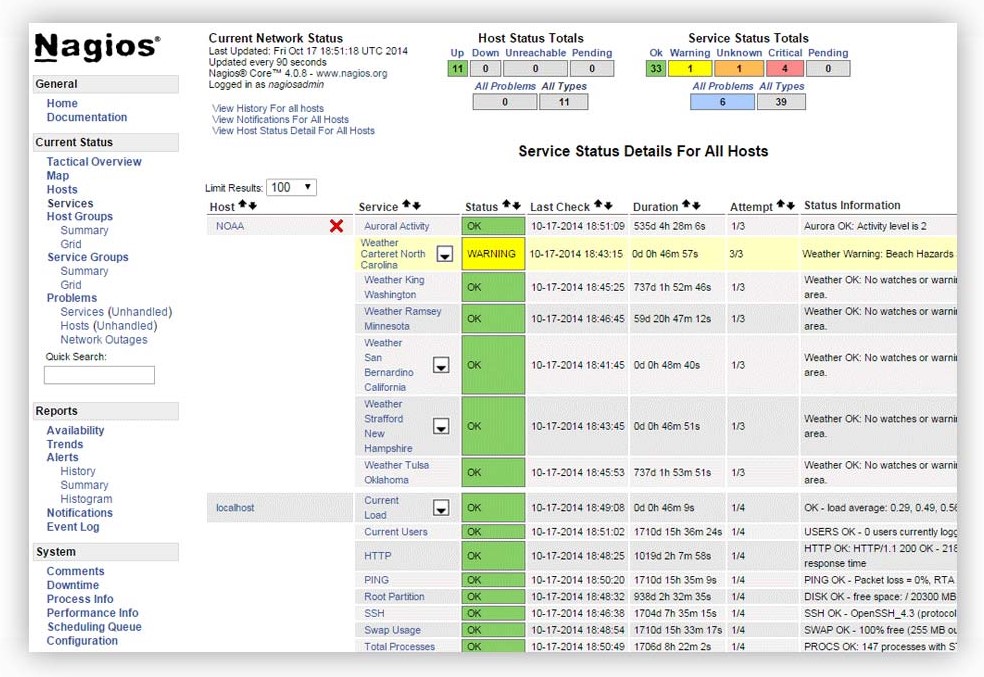
8. Nagios Core

Nagios Core is an open-source monitoring engine for its stability, flexibility, and scalability. It serves as the foundation for monitoring websites, servers, network devices, applications, and key infrastructure metrics. When combined with the official Nagios Plugins and community add-ons, it delivers a monitoring platform capable of handling small to large environments.
Key features include:
- Core monitoring engine: Provides open-source monitoring for services, devices, and applications across IT environments.
- Nagios plugins: Official plugins that extend monitoring capabilities for systems, databases, and infrastructure.
- Windows and cross-platform agents: Includes NSClient++ for Windows, NCPA for multi-platform monitoring, and NRPE/NSCA for Linux/Unix and passive checks.
- Scalability add-ons: Mod Gearman and NCAP support large-scale distributed monitoring.
- Database integration (NDOUtils): Enables dashboards, reporting, and multi-user access.

Source: Nagios
Considerations for Selecting a Zabbix Alternative
When evaluating alternatives to Zabbix, it’s important to look beyond core monitoring features and assess how well a solution fits your operational environment, team expertise, and growth plans. Each platform has strengths that suit different use cases, so aligning your selection criteria with your specific needs can significantly reduce future maintenance and configuration overhead.
Key considerations include:
- Deployment complexity: Assess how quickly the solution can be deployed and configured. Tools with guided setup or auto-discovery features reduce time to value.
- Ease of use and learning curve: Look for intuitive interfaces and streamlined workflows, especially if your team has limited experience with monitoring platforms.
- Automation and integration capabilities: Prioritize solutions with built-in support for auto-discovery, configuration management tools, and third-party integrations (e.g., cloud APIs, ITSM systems).
- Support for modern infrastructure: Ensure compatibility with containers, orchestration platforms (like Kubernetes), serverless environments, and cloud-native services.
- Customization vs. maintenance overhead: Some platforms allow deep customization but at the cost of more manual effort. Balance flexibility with maintainability.
- Alerting and notification system: Evaluate how configurable and intelligent the alerting mechanisms are; support for anomaly detection or AI-driven alerts can reduce noise.
- Performance and scalability: Consider how well the solution handles large, distributed environments and whether performance degrades as data volume grows.
- Community and vendor support: Strong documentation, an active user community, and responsive vendor support can accelerate problem resolution and learning.
- Cost structure: Open-source tools may appear free but can incur costs in maintenance, training, and integrations. SaaS platforms may offer lower overhead with predictable pricing.
- Security and compliance features: For regulated industries, built-in features for auditing, encryption, and access control may be critical.
Faddom Application Dependency Mapping: The Missing Piece of Network Tracking Solutions
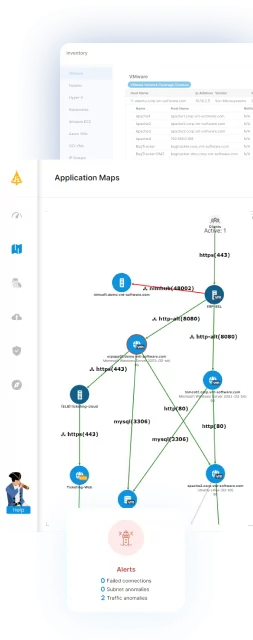
Most Zabbix alternatives focus on metrics, thresholds, and alerts, but they still leave a critical gap: understanding how every server and application depends on everything else. Without that context, teams can identify that something is down without clearly understanding what it breaks, which slows root cause analysis and makes change planning risky in complex, hybrid environments.
Faddom fills that gap. It is an agentless application dependency mapping platform that automatically discovers and visualizes real traffic flows between business applications and servers across on-premises, cloud, and hybrid environments. Instead of guessing how an incident in one system might impact others, IT teams get a living map of dependencies they can rely on during troubleshooting, migrations, and planned changes. Faddom can also integrate with tools like Zabbix, enriching existing tracking with the missing architectural context behind every alert.
To explore how dependency mapping can enhance your monitoring stack, schedule a demo by completing the form on the right!
