

Notable Solarwinds Alternatives and Competitors
Solarwinds Observability and Monitoring Alternatives
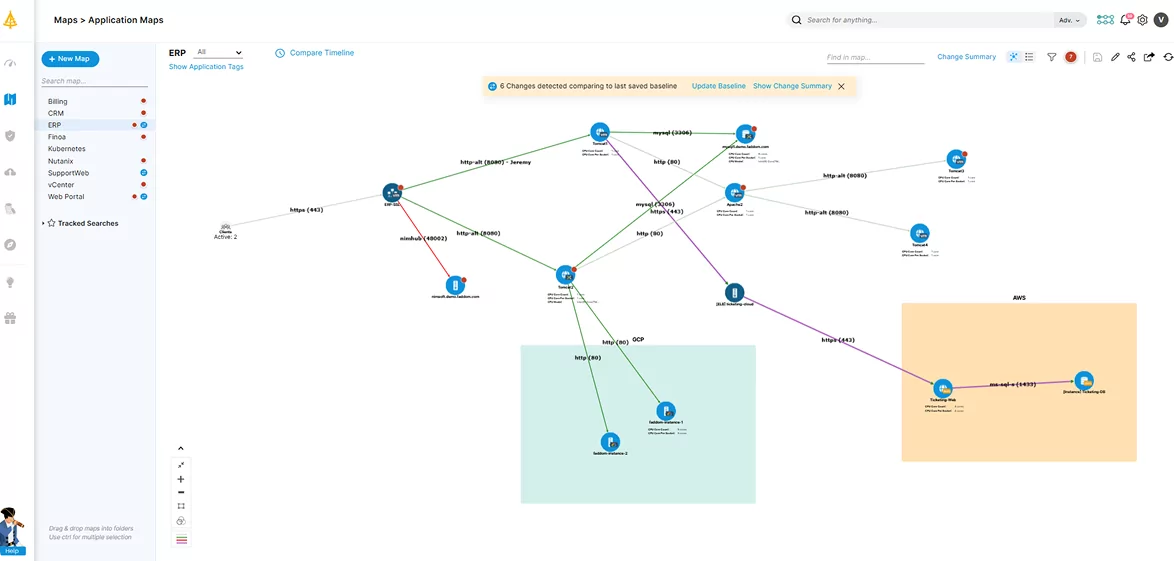
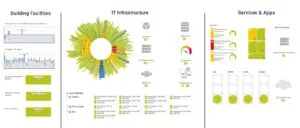
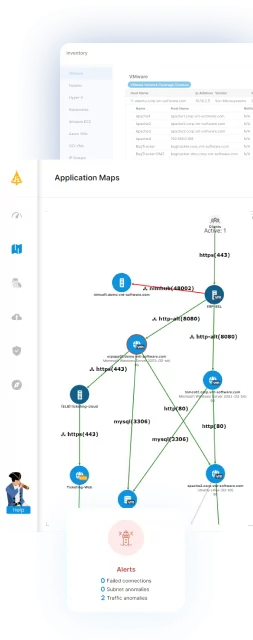
1. Faddom

2. New Relic Network Performance Monitoring
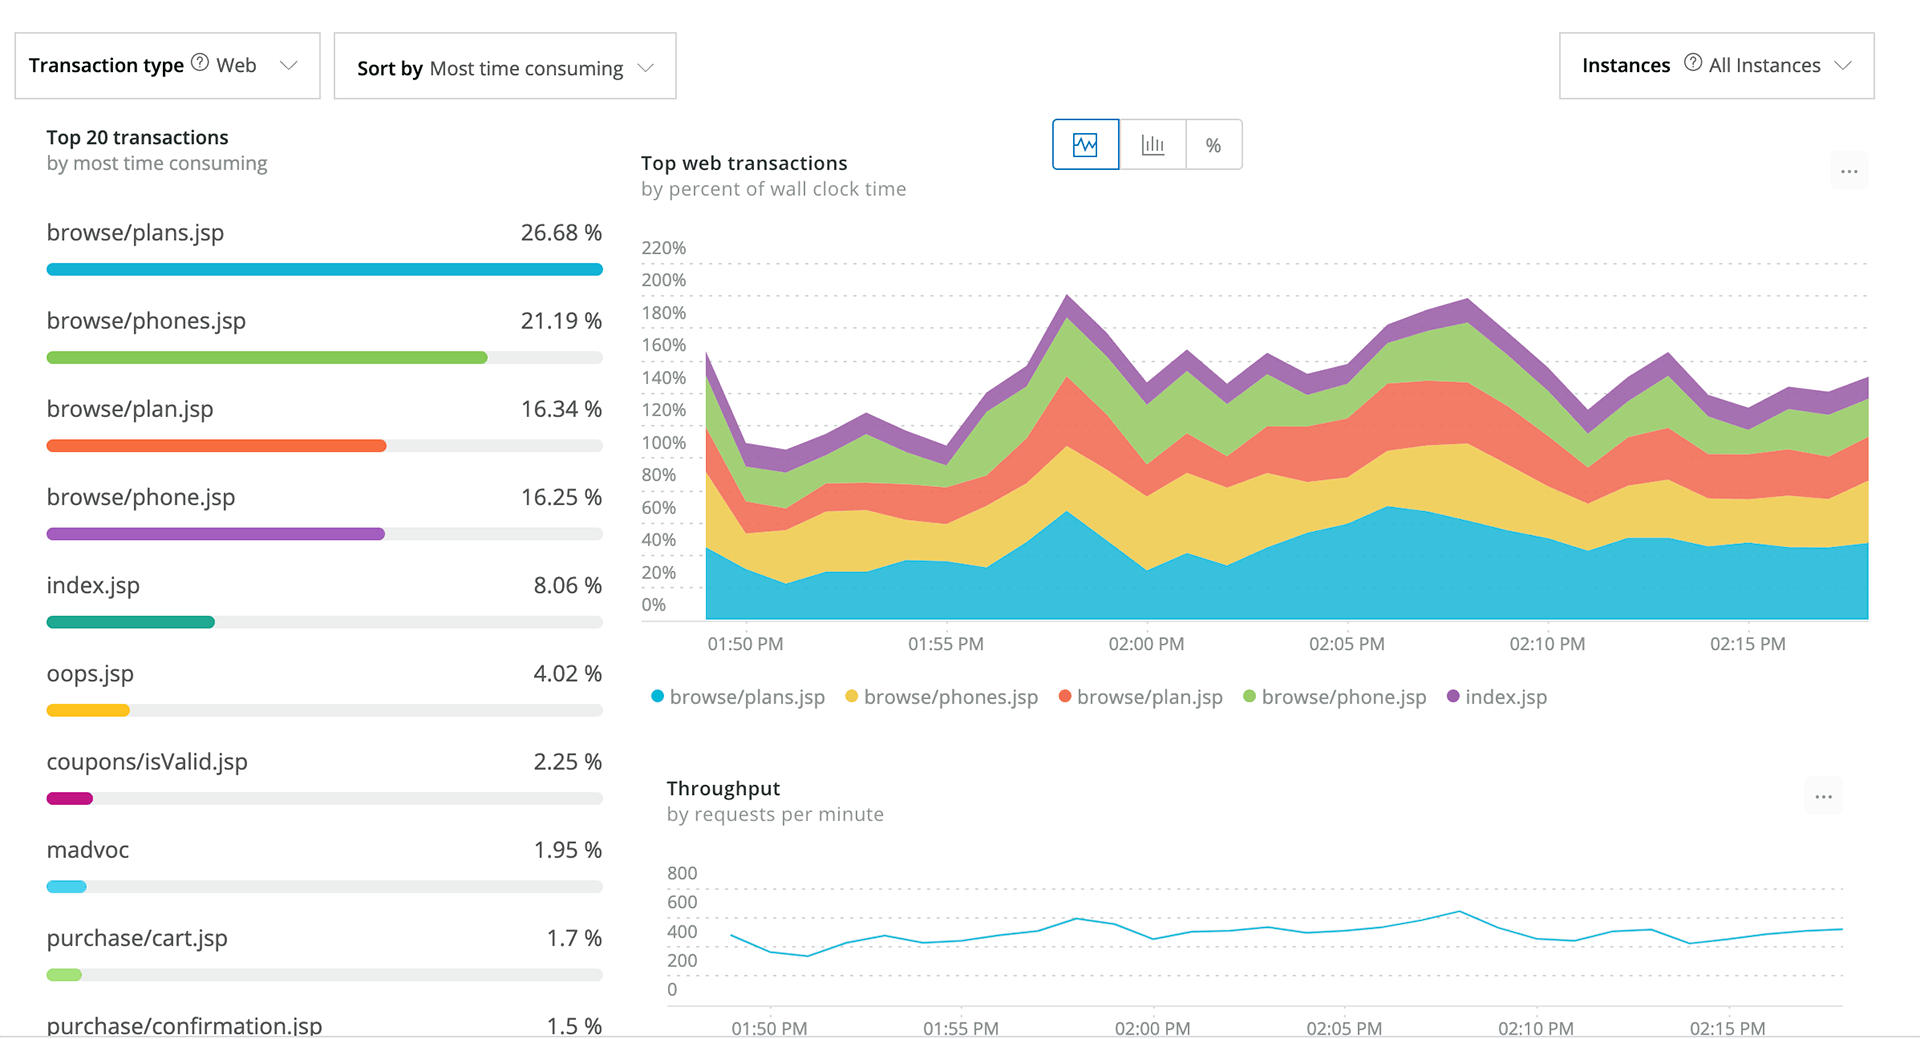
New Relic’s Network Performance Monitoring provides a unified view of network, application, and infrastructure performance to help teams quickly pinpoint and resolve issues across the entire stack. Integrated with Kentik, the solution eliminates data silos by correlating network flow and SNMP data with application telemetry.
Key features include:
- Full-stack correlation: Combines network, app, and infrastructure data in a single platform for system-wide visibility
- Kentik integration: Enriches New Relic with flow and SNMP data to trace network impact on application performance
- Context-aware troubleshooting: Identifies whether the issue is network-related before escalating to NetOps
- AI-driven anomaly detection: Alerts on abnormal network behavior based on historical performance baselines
- Proactive issue detection: Flags potential performance degradation early, enabling faster incident response
Limitations (as reported by users on G2):
- Unpredictable pricing: Costs can increase quickly as data ingestion grows, making budgeting difficult for some organizations.
- Usage-based cost model: Monitoring larger environments or sending more telemetry can significantly increase expenses.
- Complex initial setup: New users often report that configuration and onboarding require time and technical familiarity.
- Steep learning curve: The large number of features and configuration options can make navigation overwhelming at first.
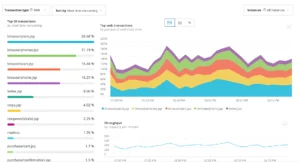
Source: New Relic
3. NinjaOne Network Monitoring

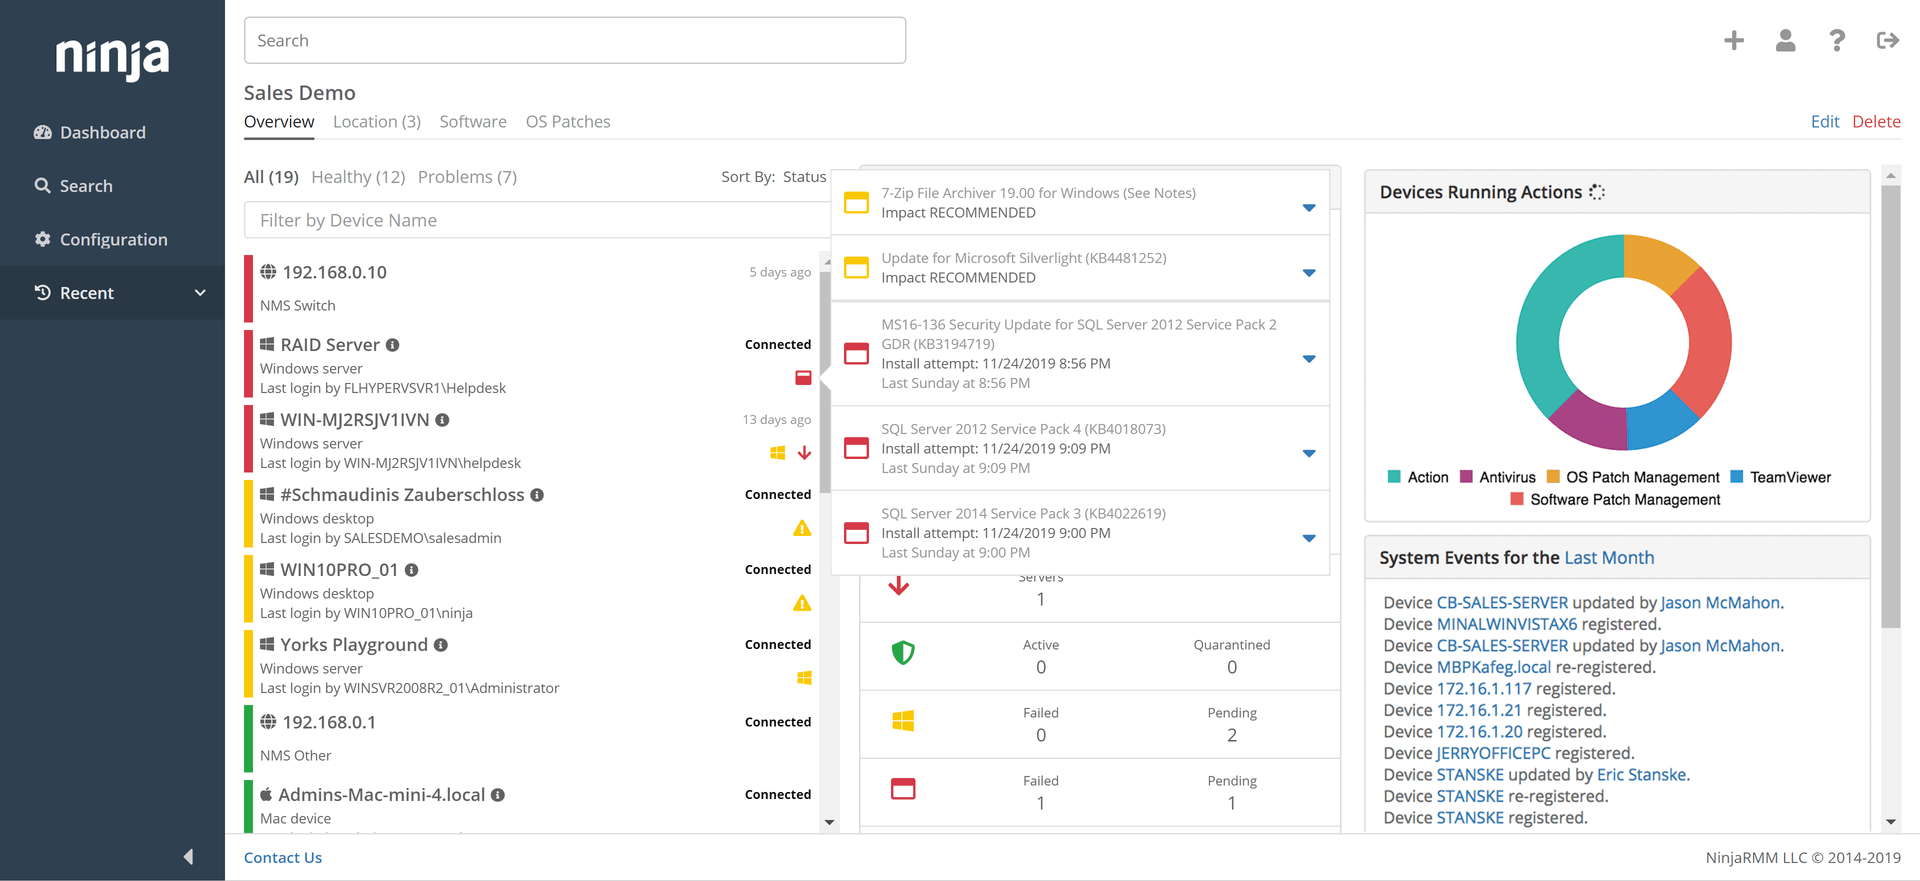
NinjaOne Network Monitoring is a fully integrated solution built into the NinjaOne RMM platform, eliminating the need for third-party tools and enabling network visibility and control. It offers SNMP and NetFlow monitoring, alerting, and automated device discovery. IT teams can track performance across all SNMP-enabled devices, identify bottlenecks, and troubleshoot issues.
Key features include:
- Integrated SNMP monitoring: Real-time monitoring with support for SNMP v1, v2, and v3 across various network configurations
- Custom OID monitoring: 50+ built-in templates for common device types and full control to define and alert on any OID
- NetFlow monitoring: Supports NetFlow, jFlow, sFlow, and IPFIX with traffic views by hour, day, week, and month
- Device discovery wizard: Automatically scans IP ranges and identifies device roles based on characteristics
- Alerting engine: Hundreds of built-in alert conditions with customizable thresholds, severity levels, and delivery via email or SMS
Limitations (as reported by users on G2):
- Limited ticketing capabilities: Users report that the built-in ticketing system lacks some essential features.
- Customization constraints: Some administrators find configuration and module customization limited.
- Alerting and filtering limitations: Alert rules and filtering functions may require improvement for more advanced monitoring workflows.
- Policy and portal rigidity: Applying policies and navigating management portals can feel inflexible in certain scenarios.
- Integration and automation gaps: Some users report limited integration options and automation capabilities.
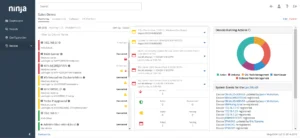
Source: NinjaOne
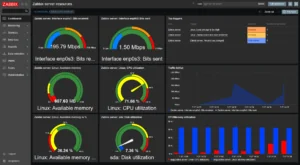
4. Zabbix Network Monitoring
Zabbix provides a network monitoring solution that combines SNMP-based data collection, agent-based monitoring, and flexible alerting to give visibility into network health and device performance. It supports SNMP versions v1, v2c, and v3 along with SNMP trap processing, making it compatible with a range of both legacy and modern hardware.
Key features include:
- Protocol support: Monitors devices using SNMP (v1, v2c, v3), Zabbix agent, and SNMP traps
- Metric coverage: Tracks traffic, bandwidth, packet loss, interface errors, TCP connections, link status, and interface speed
- Device health monitoring: Gathers data on uptime, CPU and memory usage, temperature, fan state, and power supply status
- Template-based setup: Apply predefined templates to start monitoring devices quickly with minimal manual configuration
- Custom alerting rules: Define flexible thresholds to trigger alerts on spikes, errors, and anomalies
Limitations (as reported by users on G2):
- Steep learning curve: New users may need time to understand the platform and configure monitoring effectively.
- Complex configuration: Initial setup and configuration can be challenging, especially for teams without prior experience.
- Dashboard customization limits: Some users report restrictions in customizing dashboards and visualizations.
- UI and feature gaps: The interface and certain components may feel outdated, with missing widgets or modern UI elements.
Source: Zabbix
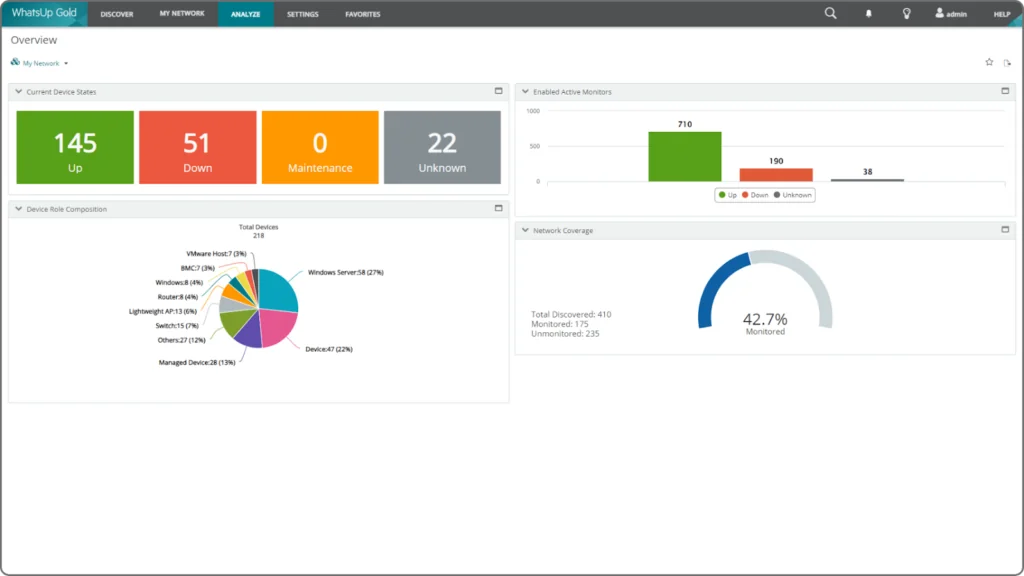
5. WhatsUp Gold

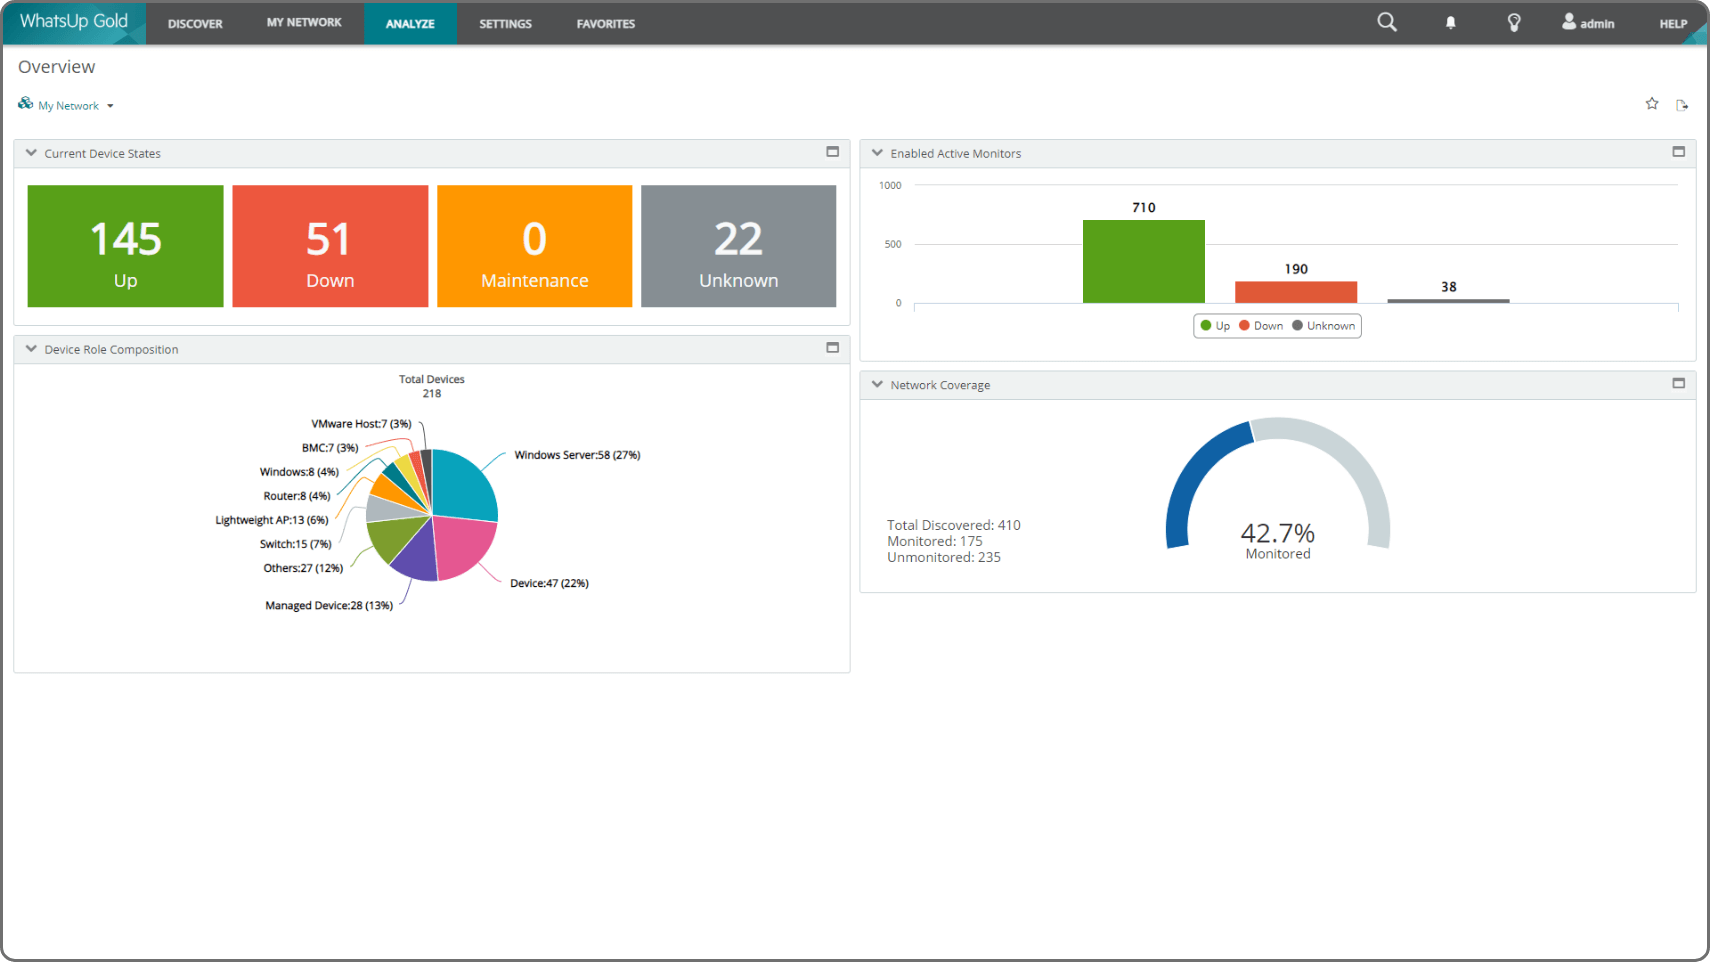
WhatsUp Gold offers a unified approach to network monitoring that combines performance visibility, infrastructure discovery, security analytics, and traffic analysis into a single platform. Designed for hybrid environments, it supports monitoring across cloud, on-premises, and virtual infrastructures.
Key features include:
- Unified infrastructure monitoring: Centralized visibility of network devices, servers, applications, cloud services, and virtual environments
- Interactive network mapping: Auto-generated Layer 2/3 topology maps showing device relationships, status, and dependencies
- Performance analytics: Real-time monitoring of bandwidth, latency, and traffic patterns for faster bottleneck detection
- Flow-based traffic analysis: Supports NetFlow, IPFIX, sFlow, jFlow, and NetStream for detailed traffic monitoring across protocols and devices
- Integrated threat detection: Uses AI to detect anomalies, lateral movement, and insider threats within the network
Limitations (as reported by users on G2):
- High licensing and upgrade costs: Pricing can become expensive as organizations scale or add modules.
- Complex setup for advanced use cases: Initial configuration and customization may require additional time and expertise.
- User interface limitations: Some users report that the UI feels outdated or unintuitive.
- Performance issues in the interface: The platform can occasionally feel slow or clunky during daily use.
Source: WhatsUp Gold
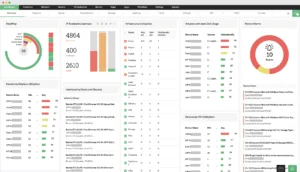
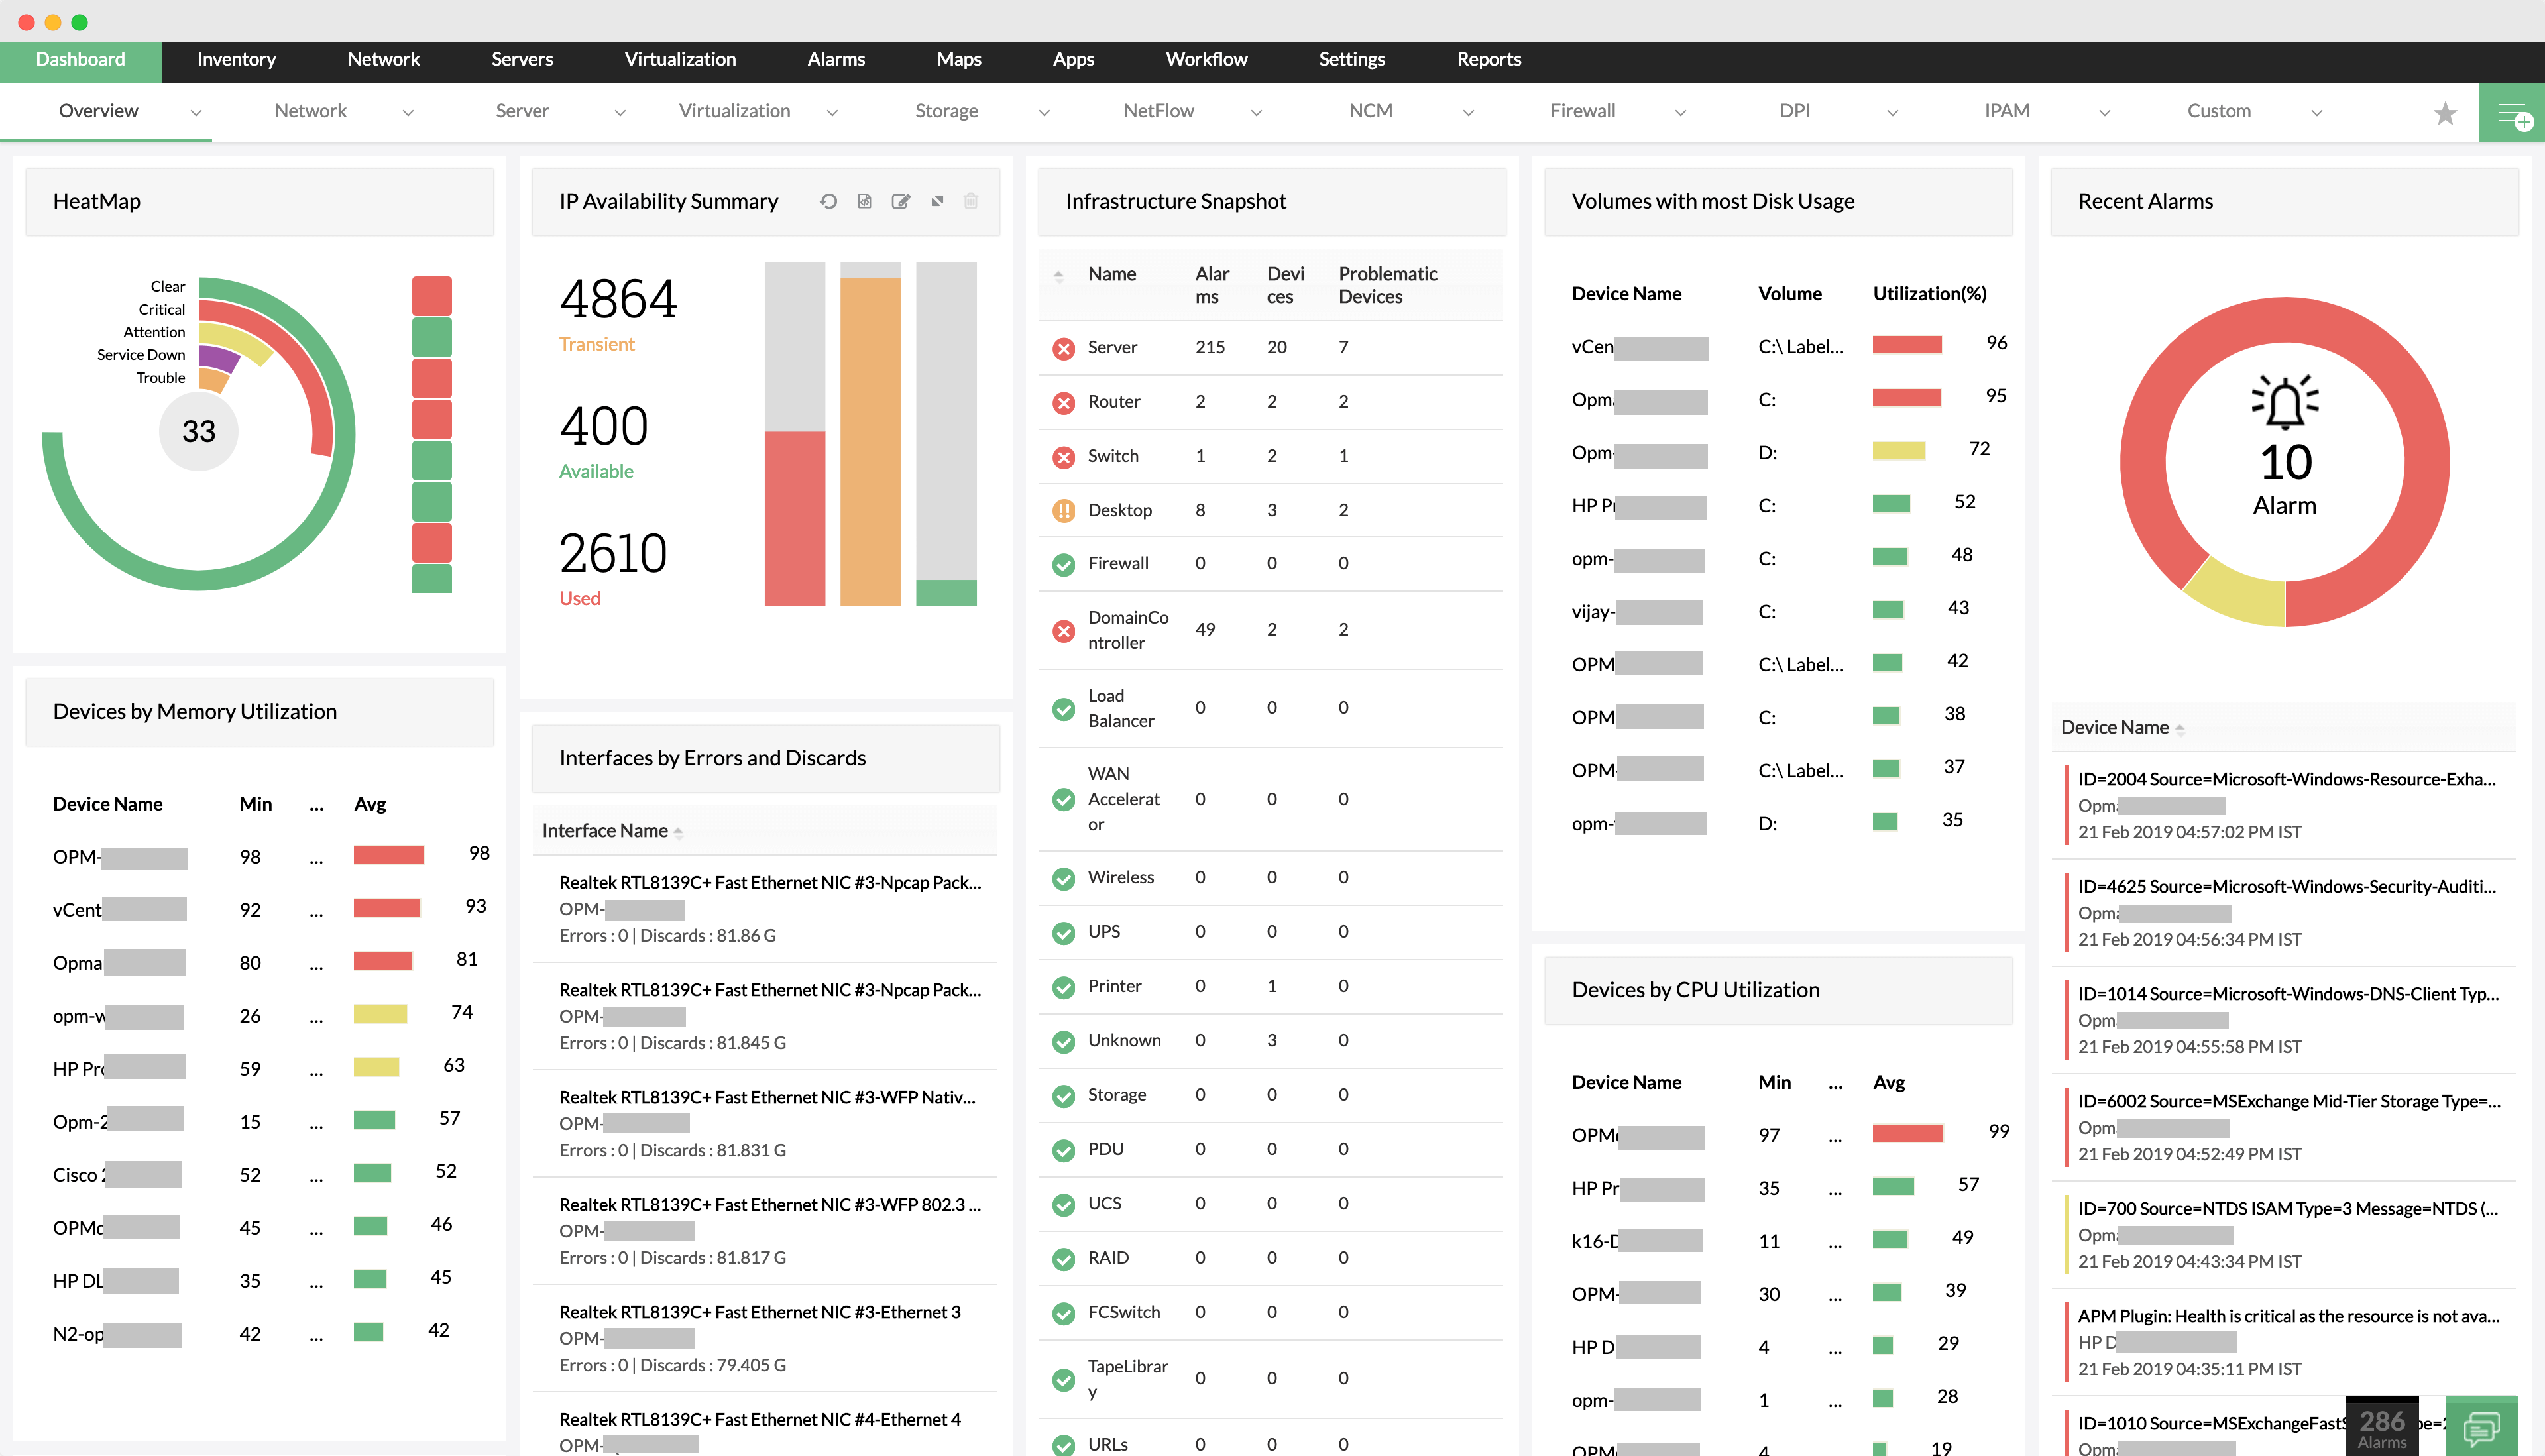
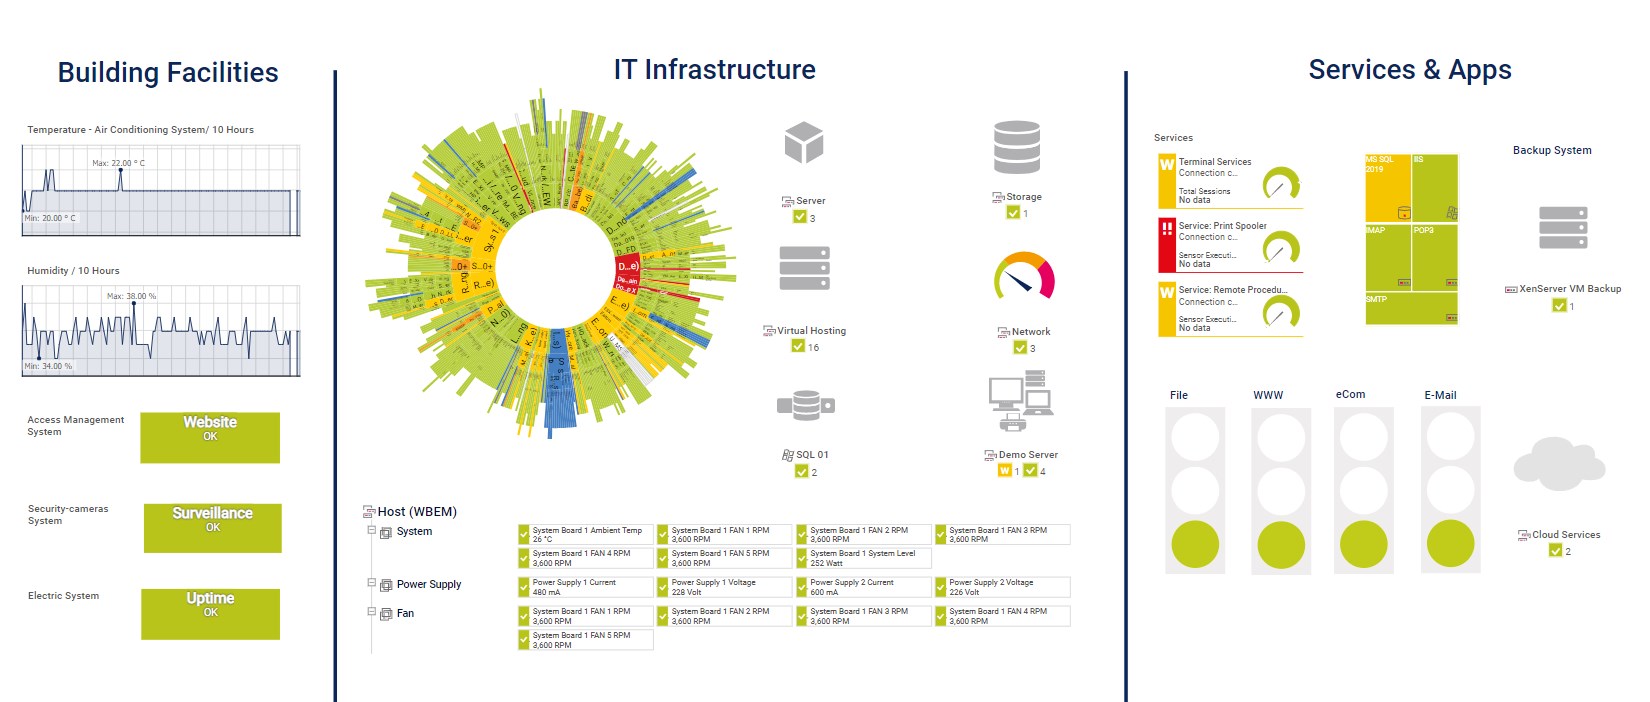
6. ManageEngine OpManager

ManageEngine OpManager is a unified network monitoring solution to deliver visibility into the health, performance, and availability of IT infrastructure. It supports monitoring of routers, switches, firewalls, wireless controllers, servers, virtual machines, WAN links, and storage devices. OpManager simplifies root cause analysis by correlating events and presenting alarms.
Key features include:
- Network monitoring: Tracks availability and performance for any IP-based device, including routers, switches, and firewalls
- Server and virtualization monitoring: Monitors physical servers and virtual environments like VMware, Hyper-V, Citrix, and Nutanix
- Wireless network visibility: Provides metrics on access points, wireless routers, and WiFi traffic
- WAN monitoring: Uses Cisco IPSLA to analyze WAN link performance and troubleshoot outages
- Cisco ACI support: Discovers and monitors Cisco ACI infrastructure, including fabrics, tenants, and endpoints
Limitations (as reported by users on G2):
- Complex deployment for large environments: Setup and configuration may be challenging for complex networks.
- Feature gaps: Some users report missing advanced templates and limited documentation for certain functions.
- Customer support concerns: Delays in support responses and limited documentation can slow troubleshooting.
- Additional licensing requirements: Some advanced capabilities require separate licenses or add-ons.
- Cost considerations: Expanding features or scaling the platform can increase overall costs.
Source: ManageEngine
7. Paessler PRTG

Paessler PRTG is a network monitoring solution to provide continuous visibility into the health, availability, and performance of IT infrastructure. It uses a simple installer and automatic network discovery to get teams up and running within minutes. PRTG monitors hardware, software, network traffic, and system resources from a single platform.
Key features include:
- Automatic network discovery: Scans IP ranges and detects devices automatically to simplify initial setup
- Infrastructure coverage: Monitors servers, routers, switches, firewalls, applications, services, and Windows and Linux systems
- Performance metrics: Tracks availability, bandwidth usage, traffic, and resource consumption continuously
- Custom alerts: Notifies IT teams proactively before congestion or critical issues occur
- Data visualization: Displays metrics using dashboards, graphs, and custom network maps for easier analysis
Limitations (as reported by users on G2):
- Performance slowdowns at scale: Monitoring large numbers of servers or sensors can affect performance and reporting speed.
- High licensing costs: Pricing can become expensive, especially for startups or growing environments.
- Sensor licensing management: Organizations must carefully manage sensor counts to avoid unexpected costs.
- Learning curve for customization: Configuring sensors, reports, and advanced monitoring rules may require additional time.
Source: Paessler PRTG
Learn more in our detailed guide to PRTG network monitor vs SolarWinds
Solarwinds IT Service Management (ITSM) and MSP Alternatives
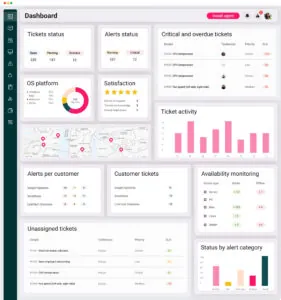
8. Atera RMM
Atera is a remote monitoring and management (RMM) platform for IT teams and managed service providers (MSPs) seeking a simplified solution for managing endpoints, networks, and IT services. Its cloud-based architecture and fast deployment process make it accessible to teams of all sizes, offering quick time-to-value and minimal setup overhead.
Key features include:
- Remote management: Secure access to devices using integrated tools like AnyDesk, Splashtop, TeamViewer, and ScreenConnect
- Patch management: Automate OS and software updates to keep systems secure and compliant
- IT automation and scripting: Automate routine tasks across devices to improve efficiency
- Network monitoring and alerts: Monitor network health and receive real-time alerts on performance issues
- Software management: Deploy, manage, and audit installed applications across all managed endpoints
Limitations (as reported by users on G2):
- Limited customization: Some users report restrictions when customizing reports, dashboards, or workflows.
- Performance concerns: Certain operations, such as report generation, can be slow in larger environments.
- Reliability issues in some modules: Users occasionally report unstable performance or system resource usage.
- Ticket management limitations: The ticketing system may lack advanced functionality needed by larger support teams.
Source: Atera
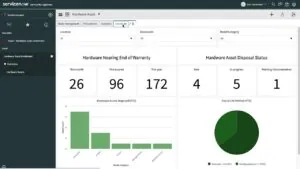
9. ServiceNow ITAM

ServiceNow IT Asset Management (ITAM) is an integrated solution that automates the lifecycle of hardware, software, and cloud assets from a single platform. Built on the ServiceNow AI Platform, ITAM helps organizations gain control over asset inventory, optimize usage, reduce costs, and ensure compliance with licensing and contract requirements.
Key features include:
- Unified asset management: Manage hardware, software, SaaS, and cloud assets in one centralized system
- Lifecycle automation: Automate asset onboarding, tracking, offboarding, and contract renewals through digital workflows
- Software asset management: Reduce software spend and compliance risk with modern tracking and usage insights
- Hardware asset management: Monitor physical assets, optimize inventory, and control lifecycle costs
- SaaS license management: Track SaaS usage and expenses to eliminate redundant licenses and waste
Limitations (as reported by users on G2):
- Steep learning curve: New users may find the platform difficult to understand initially.
- Complex setup: Implementing and configuring asset management workflows can be time-consuming.
- High cost: Licensing and implementation expenses may be prohibitive for smaller organizations.
- Navigation complexity: Some modules and workflows can feel unintuitive to new administrators.
- Limited evaluation guidance: Users report limited information for assessing certain features before deployment.
Source: ServiceNow
10. Freshservice ITSM

Freshservice is an AI-powered IT service management (ITSM) platform to help organizations deliver faster and more scalable IT support. Aligned with ITIL best practices, Freshservice combines automation and enterprise-grade capabilities to transform IT into a strategic business enabler.
Key features include:
- Freddy AI: Offers 24/7 virtual agent support, agent assistance, and predictive insights to boost service speed and accuracy
- ITIL-aligned service management: Includes modules for incident, problem, change, release, and service request management
- IT asset management: Tracks hardware, software, and cloud assets in real time using an auto-updating CMDB
- IT operations management: Delivers intelligent alerting, event correlation, and faster incident resolution across IT infrastructure
- Enterprise service management: Extends ITSM workflows to non-IT teams like HR, Finance, and Facilities for unified service delivery
Limitations (as reported by users on G2):
- Limited reporting capabilities: Built-in reporting tools may lack advanced analytics and export options.
- Customization constraints: Some organizations find workflow and configuration customization limited.
- Learning curve: Fully utilizing the platform’s features may require time and training.
- Functional gaps in complex workflows: Some users report limitations when managing complex account or service processes.
Source: Freshservice ITSM
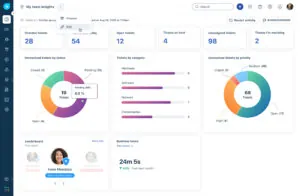
11. Jira Service Management
Jira Service Management is an AI-powered ITSM solution that enables high-velocity service delivery across IT, operations, HR, and other business teams. Built on the Atlassian platform, it unifies service request management, incident response, change control, and asset visibility in a single workspace.
Key features include:
- AI-powered self-service: Always-on virtual agents answer employee questions, suggest articles, and help close tickets faster
- Unified service desk: Centralized platform to manage requests across IT, HR, facilities, and other business units
- Incident management: Automatically group related alerts, escalate to incidents, and provide responders with relevant context and remediation paths
- Change management: Coordinate and approve changes quickly while minimizing risk, with integrated DevOps workflows
- Post-incident review automation: Use AI to generate incident summaries and extract key lessons to improve resilience
Limitations (as reported by users on G2):
- Steep learning curve: The interface and configuration model can require training for new users.
- Complex configuration: Setting up workflows, automation, and integrations may take significant time.
- Complicated UI: Some users find navigation and feature discovery difficult without prior experience.
- Setup overhead: Implementing advanced service management processes often requires careful configuration.
Source: JIRA Service
12. NinjaOne RMM

NinjaOne Remote Monitoring and Management (RMM) is a unified platform to simplify IT operations by providing visibility and control over managed endpoints. It enables IT teams and MSPs to monitor, patch, secure, and manage devices across Windows, macOS, Linux, and mobile environments.
Key features include:
- Monitoring and alerting: Continuously tracks device health and performance, automatically notifying technicians of issues
- Automated patching: Patches Windows, macOS, Linux, and 200+ third-party applications with customizable scheduling and reporting
- Remote access: Secure, built-in remote access tools allow for fast troubleshooting without interrupting end users
- Endpoint task automation: Standardize and automate tasks like software deployment, maintenance, and configuration across all endpoints
- Auto-remediation: Detect and resolve common issues automatically using condition-based scripts for services, reboots, ports, and apps
Limitations (as reported by users on G2):
- Limited ticketing functionality: The built-in service desk may lack advanced features needed by some teams.
- Customization limitations: Users report restrictions when configuring modules and workflows.
- Alerting and filtering improvements needed: Monitoring alerts and filtering capabilities may require refinement.
- Policy management complexity: Applying policies and managing portals can feel rigid.
- Integration and automation gaps: Some users report limitations in integrations and automation flexibility.

Source: Ninja
Conclusion
Selecting the right alternative to SolarWinds depends on the organization’s requirements, whether that’s deep network observability, scalable IT service management, or flexible tools for managed service providers. With diverse options available across open-source, cloud-native, and AI-powered platforms, teams can prioritize ease of deployment, integration flexibility, cost efficiency, or advanced analytics. Evaluating these solutions based on performance, usability, and alignment with operational goals ensures a more tailored and sustainable monitoring and IT management strategy.


