
TL;DR: Tools around CloudWatch Omni either map infrastructure dependencies or provide full-stack observability. Best for agentless hybrid dependency mapping: Faddom. For discovery with a built-in CMDB: Device42. For unified APM and logs: Datadog. For AI-driven topology analysis: Dynatrace.
What Is Amazon CloudWatch Omni?
Amazon CloudWatch Omni is an AI-powered, off-console observability experience by AWS that unifies monitoring for traditional applications, cloud infrastructure, and AI agents in a single place. Launched in September 2026, it brings logs, metrics, traces, and AI agent evaluations into a unified environment, enabling engineering and operations teams to investigate performance problems without switching between multiple monitoring tools.
Unlike traditional monitoring interfaces, CloudWatch Omni organizes observability around applications, services, and their dependencies. It uses OpenTelemetry to support workloads across AWS and other environments, while providing automatic service discovery, natural-language querying, and AI-assisted root cause analysis.
Key features:
- Shared team workspaces with single sign-on: Provides a standalone web application with SSO through AWS IAM Identity Center. Domains and spaces organize telemetry access, while shared dashboards and investigation threads support collaboration across engineering and operations teams.
- Natural-language queries with SQL and PromQL generation: Allows engineers to investigate logs, metrics, and traces using plain-language questions. An AI assistant generates and executes queries, presents results, and lets users inspect and refine the query logic.
- Dynamic service views and SLO-based health alerts: Automatically discovers application services and dependencies, generating topology maps with request rates, error rates, and latency metrics. Teams can define service health conditions and configure query-based alerts aligned with service-level objectives.
- AI-guided root cause investigations: Integrates with AWS DevOps Agent to correlate telemetry, deployments, configuration changes, and infrastructure dependencies. Engineers can review supporting evidence and preserve investigation history in shared threads.
This is part of a series of articles about cloud computing costs
In this article:
- How CloudWatch Omni Relates to Classic CloudWatch
- Key Features of CloudWatch Omni
- CloudWatch Omni Pricing and Region Availability
- CloudWatch Omni Limitations
- Tools That Complement or Compete with CloudWatch Omni
- Best Practices for Adopting CloudWatch Omni
How CloudWatch Omni Relates to Classic CloudWatch
What Stays in CloudWatch: Ingestion, Storage, Alarms, and Dashboards
Amazon CloudWatch remains responsible for the core monitoring infrastructure, including collecting telemetry, managing data retention, and supporting existing operational workflows. Organizations continue to configure these capabilities through the AWS Management Console, even after enabling Omni.
Key capabilities that remain in classic CloudWatch include:
- Telemetry ingestion: Existing CloudWatch agents, AWS SDKs, and OpenTelemetry pipelines continue sending logs, metrics, and traces without requiring reconfiguration.
- Data storage and retention: CloudWatch manages log groups, telemetry storage, retention settings, and ingestion endpoints. Omni uses the existing CloudWatch data stores rather than creating a separate storage infrastructure.
- Alarms and notifications: Existing CloudWatch alarms, thresholds, and notification integrations continue functioning independently of Omni.
- Dashboards and visualizations: Previously configured CloudWatch dashboards remain accessible through the traditional console, alongside existing monitoring views.
- APIs and queries: CloudWatch APIs, Logs Insights queries, and integrations with other AWS services continue operating without changes.
Related content: Read our guide to application monitoring in AWS
What Omni Adds: A Separate Web App, Team Workspaces, and AI Workflows
CloudWatch Omni introduces a collaborative observability experience designed to make telemetry easier to access, investigate, and interpret. Instead of requiring every engineer to navigate the AWS Management Console, it provides a dedicated web application with enterprise single sign-on (SSO), allowing authorized users to access monitoring information using their organization’s existing identities.
Its additional capabilities include:
- Standalone web application: Engineers, developers, and operations teams can access observability data through a dedicated URL without requiring individual AWS Management Console access.
- Team workspaces: Organizations create domains and spaces that define identity access and telemetry visibility. Shared views and investigation threads help teams collaborate on troubleshooting.
- Automatic service discovery: Omni identifies services and dependencies from telemetry and generates application maps with performance indicators such as request rates, errors, and latency.
- Natural-language queries: Users can ask questions about application behavior, and Omni generates SQL or PromQL queries to retrieve relevant telemetry.
- AI-powered investigations: Integration with AWS DevOps Agent helps teams investigate incidents, correlate signals, and identify potential root causes.
- AI agent observability: Specialized tracing and evaluation capabilities help developers analyze model calls, tool invocations, response quality, latency, and token usage across agentic applications.
- IDE integrations: Extensions for VS Code, Cursor, and Kiro allow developers to instrument, debug, and evaluate AI agents directly within their development environments.
Omni also supports centralized observability across multiple AWS accounts, Regions, and other cloud environments. However, cross-account and cross-Region telemetry centralization still relies on CloudWatch configuration rather than being performed automatically by Omni.
Key Features of CloudWatch Omni
Shared Team Workspace with SSO Through IAM Identity Center
CloudWatch Omni provides a dedicated web application where developers, site reliability engineers (SREs), and operations teams can access observability data without individual AWS Management Console access. Organizations can configure single sign-on (SSO) through AWS IAM Identity Center, including integrations with identity providers such as Okta and Microsoft Entra ID.
Workspaces are organized into domains and spaces. A domain provides the organization’s shared sign-in entry point, while each space controls access to telemetry associated with an AWS account and Region. Teams can collaborate through shared dashboards and investigation threads, allowing engineers to review previous findings, examine the same telemetry, and continue troubleshooting without losing context during handoffs.
Natural Language Queries That Generate SQL and PromQL
CloudWatch Omni allows users to investigate application behavior by asking questions in natural language instead of manually writing queries. Its built-in AI assistant interprets requests, generates SQL for logs and traces or PromQL for metrics, and executes queries against the available telemetry.
For example, an engineer can ask why API latency increased after a deployment or which services experienced the highest error rates during a specified period. Omni can retrieve relevant signals, correlate information across telemetry types, and present results as charts or tables. Engineers can also inspect and refine the generated queries, making advanced troubleshooting accessible without requiring extensive knowledge of query syntax.
Dynamic Views and SLO-Based Health Alerts Instead of Static Dashboards
CloudWatch Omni automatically discovers application services and their dependencies from telemetry, creating topology views that evolve as the application changes. These views display operational indicators such as request rates, error rates, and latency, reducing the need to manually maintain separate dashboards for every infrastructure component.
Teams can define service health conditions based on:
- Availability targets
- Latency budgets
- Acceptable error rates
This helps align monitoring with service-level objectives (SLOs). Omni supports query-based alerts that notify teams through Amazon SNS or Slack when defined conditions are met. Shared dashboards remain available, but dynamic topology and service health views make it easier to identify changes without relying exclusively on static monitoring configurations.
AI-Guided Investigations with AWS DevOps Agent
CloudWatch Omni integrates with AWS DevOps Agent to help engineering teams identify potential root causes of application incidents. When an alert fires or an engineer identifies abnormal behavior, they can launch an investigation from the Omni interface after connecting a DevOps Agent space. The agent analyzes relevant operational data, correlates events, and investigates possible connections between:
- Service failures
- Deployments
- Configuration changes
- Infrastructure dependencies
For example, when a checkout service experiences increased latency, the agent can investigate whether the problem is associated with a recent deployment, a downstream API, or an infrastructure issue. Engineers can review its findings, investigate supporting evidence, and collaborate in shared threads. Investigation history remains available for subsequent troubleshooting and incident reviews, helping teams preserve operational knowledge.
CloudWatch Omni Pricing and Region Availability
Amazon CloudWatch Omni uses consumption-based pricing rather than per-user licensing. Organizations pay standard Amazon CloudWatch rates for telemetry ingestion and storage, with additional charges for queries that exceed included allowances. Omni operates on existing CloudWatch data, so enabling it does not require paying for a second copy of stored telemetry.
Pricing depends on the following components:
- Telemetry ingestion: Application logs and OpenTelemetry metrics cost $0.50 per GB in US East (N. Virginia). Trace spans start at $0.35 per GB, with lower rates at higher volumes.
- Data storage: Standard storage costs $0.030 per GB-month of compressed data. Intelligent Tiering offers lower rates for less frequently accessed data.
- Log and trace queries: Teams can scan up to five times their eligible monthly log and span ingestion volume without additional query charges. Usage beyond this allowance costs $0.005 per GB scanned.
- PromQL queries: Metric queries cost $0.01 per million samples scanned.
- Dashboards and alerts: Omni dashboards and alerts are included without additional charges, subject to service quotas.
- AI agent evaluations: Evaluations are billed separately according to Amazon Bedrock AgentCore Evaluations pricing.
AWS also offers eligible organizations a 30-day trial with $1,000 in credits for OpenTelemetry ingestion. The trial is limited to qualifying accounts, with a maximum of 10 participating accounts per AWS Organization.
As of November 2026, CloudWatch Omni is available in 11 AWS Regions: US East (N. Virginia), US West (Oregon), Canada (Central), Europe (Ireland), Europe (Frankfurt), Europe (London), Asia Pacific (Mumbai), Asia Pacific (Singapore), Asia Pacific (Sydney), Asia Pacific (Tokyo), and South America (São Paulo). Organizations can centralize telemetry from other Regions into supported Omni Regions, although cross-Region data transfer and storage considerations still apply.
CloudWatch Omni Limitations
Although Amazon CloudWatch Omni simplifies observability and troubleshooting, it introduces several considerations around regional availability, telemetry configuration, AI reliability, and operational costs. Organizations evaluating Omni should understand these limitations before adopting it across large or distributed environments:
- Limited regional availability: Omni is available in 11 AWS Regions as of November 2026, rather than every Region supported by classic CloudWatch. Organizations operating elsewhere may need to centralize telemetry in supported Regions, potentially creating additional data transfer costs and data residency concerns.
- Dependence on existing CloudWatch infrastructure: Omni does not independently collect, centralize, or manage telemetry storage. Teams must continue configuring ingestion pipelines, retention policies, and cross-account centralization through CloudWatch.
- Incomplete or poorly instrumented telemetry: Automatic service discovery and AI-guided troubleshooting depend on the quality and completeness of collected telemetry. Missing traces, inconsistent service attributes, or insufficient instrumentation can limit visibility into application dependencies and incident causes.
- AI investigation accuracy: Natural-language queries and AWS DevOps Agent investigations can accelerate troubleshooting, but generated queries and root cause recommendations still require validation. AI-generated findings should not be treated as definitive evidence without examining the underlying telemetry.
- Additional costs at scale: Although Omni does not charge per user, high-volume telemetry ingestion, frequent queries, extended retention, and AI agent evaluations can increase operating costs. Organizations need to monitor usage and optimize instrumentation to control spending.
- Cross-Region AI processing: Some AI-powered features use cross-Region inference, meaning telemetry content and user prompts may be processed outside the Region where the data is stored. This can introduce compliance considerations, especially in Regions where inference requests may be routed globally.
- Workspace and access configuration: Each Omni space is associated with an AWS account and Region. Organizations managing multiple accounts must configure the appropriate domain, identity permissions, and CloudWatch centralization rules to provide a unified observability experience.
- Query and service quotas: Omni queries are subject to limits, including a maximum of 100,000 returned rows per SQL query and a 60-minute query timeout. These restrictions may affect investigations involving very large datasets or complex analytical queries.
Tools That Complement or Compete with CloudWatch Omni
How we selected these tools: We shortlisted observability and infrastructure visibility tools based on application and service dependency mapping, telemetry correlation across logs, metrics, and traces, AI-assisted root cause analysis, and support for hybrid and multi-cloud environments.
The table below summarizes the key differences between the tools that complement or compete with CloudWatch Omni. We explore each tool in more detail in the sections that follow.
| Category | Solution | Best For | Key Strengths | Things to Consider |
| Dependency Mapping and Infrastructure Visibility | Faddom | Agentless dependency mapping across hybrid environments | Real-time maps, change impact simulation, plain-language AI queries | Duplicate hostname entries can appear after IP changes |
| Dependency Mapping and Infrastructure Visibility | Device42 | Discovery and dependency mapping with a built-in CMDB | Application Groups, impact charts, InsightsAI natural-language SQL | Appliance deployment and maintenance; slower with large datasets |
| Dependency Mapping and Infrastructure Visibility | ServiceNow Service Mapping | Service-aware operations inside ServiceNow | ML-generated service maps tied to the ServiceNow CMDB | Requires ITOM; setup and pricing can be demanding |
| Full-Stack Observability Platforms | Datadog APM | Code-level tracing correlated with logs and metrics | Watchdog AI, change tracking, OpenTelemetry support | Complex agent setup; costs grow with ingestion |
| Full-Stack Observability Platforms | Dynatrace | AI-driven observability with automatic topology mapping | Smartscape, Grail data lakehouse, DQL queries | Platform breadth can overwhelm; cost guidance unclear |
| Full-Stack Observability Platforms | New Relic | Unified telemetry with AI monitoring and natural-language access | Service maps, AI agent traces, 100 GB free monthly ingest | Ingestion-based pricing hard to predict; alert tuning needed |
Dependency Mapping and Infrastructure Visibility Tools
1. Faddom

Best for: Agentless dependency mapping across hybrid environments
Strengths: Real-time maps, change impact simulation, plain-language AI queries
Things to consider: Duplicate hostname entries can appear after IP changes
Faddom is an application dependency mapping platform that discovers servers, business applications, and the connections between them across on-premises and cloud infrastructure. It does not require agents, and teams can map a hybrid environment in under 60 minutes. Discovery runs continuously, so maps reflect the current state of the environment rather than a point-in-time snapshot.
Faddom groups servers into business applications automatically, documents every change, and simulates the impact of planned changes on operations. Its AI model learns how the hybrid topology behaves, flags traffic anomalies, provides infrastructure recommendations, and answers questions in plain language. Faddom also feeds dependency data into segmentation, security, ITSM, and monitoring tools.
Key features include:
- Agentless asset discovery: Discovers servers, operating systems, installed software, applications, and cloud services across hybrid environments in real time, maintaining an inventory without agents or manual updates.
- Business application mapping: Automatically groups servers into business applications and builds maps that show the architecture of the infrastructure, with every change logged in the documentation.
- Change impact and root cause analysis: Simulates how planned changes affect operations and uses dependency maps to trace the source of outages.
- Resource optimization: Shows how infrastructure is used, identifies idle or overprovisioned resources, and supports right-sizing decisions for cloud and data center environments.
- Faddom AI and anomaly detection: Learns normal topology behavior across multiple layers, flags unexpected connections and unusual traffic, and answers infrastructure questions in plain language.
- Migration and business continuity planning: Uses dependency maps to group workloads, sequence migration moves, and plan disaster recovery.
- Exposure management and micro-segmentation: Maps every connection and communication path to identify exposed assets and risky traffic, and feeds segmentation and security tools.
- Integrations: Connects to ITSM and monitoring tools so dependency data is available in existing operational workflows.
Limitations (as reported by users on G2):
- Analytics depth: Some users would like deeper analytics on top of the dependency maps.
- Network-specific features: Users noted interest in additional networking capabilities, such as log storage and diagram integration with cloud-hosted network management platforms.
2. Device42
Best for: Discovery and dependency mapping with a built-in CMDB
Strengths: Application Groups, impact charts, InsightsAI natural-language SQL
Things to consider: Appliance deployment and maintenance; slower with large datasets
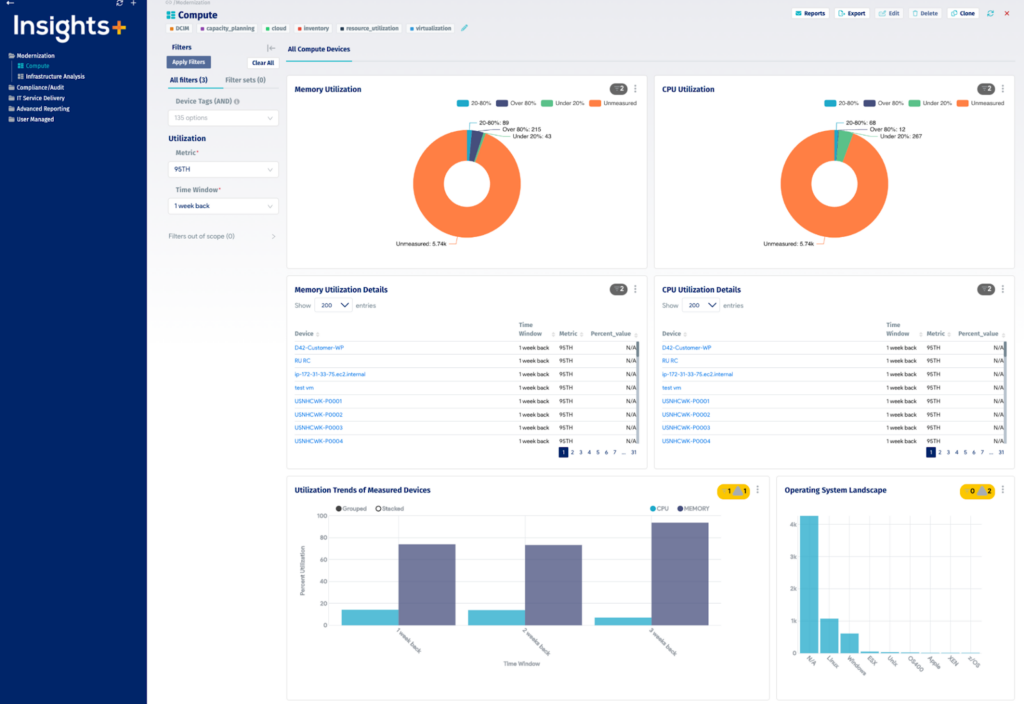
Device42, a Freshworks company, provides IT discovery, a CMDB, and dependency mapping for hybrid and multi-cloud environments. It discovers infrastructure from on-premises systems to AWS and Azure cloud resources, then maps how applications, services, and devices communicate. Teams use these maps for incident response, change management, migration planning, and audit documentation.
The platform builds Application Groups from real communication patterns, identifies active services and the ports they use, and generates impact charts and impact lists that show how a change to one device affects others. InsightsAI converts natural-language questions into SQL queries against discovered data, and a REST API plus more than 30 integrations connect Device42 to ITSM and automation tools.
Key features include:
- Application Groups: Automatically generates visual maps based on real communication patterns, starting from a defined host or database, with calculation rules that control which resources belong to each group.
- Automated service discovery: Identifies active services and ports, shows remote dependencies for each machine, and collects dependency data without configuring span ports.
- Business Services: Lets teams build service diagrams manually or from Application Groups and add metadata such as owners, SLAs, application type, and disaster recovery details.
- Impact charts and impact lists: Visualize service connections and show which services and organizational groups are affected when a device changes or fails.
- Timeline view: Tracks changes to Application Groups over time.
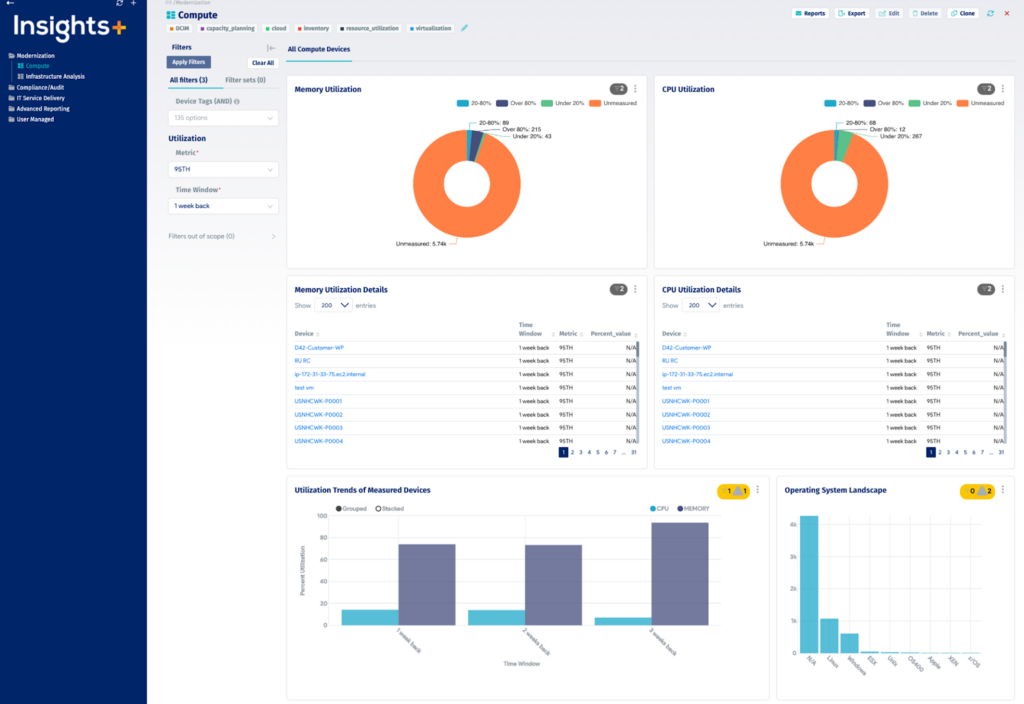
- InsightsAI: Turns natural-language questions into SQL queries against discovered data for reporting and dashboards.
- Cloud discovery and CMDB: Inventories AWS and Azure resources and populates a near real-time CMDB.
- Integrations and API: Offers more than 30 integrations, including ServiceNow, Jira, PagerDuty, Splunk, and Ansible, and a RESTful API for importing or exporting data.
Limitations (as reported by users on AWS Marketplace):
- Complex interface: The user interface and navigation can feel complex at first, especially for smaller teams, and some workflows and reports are not intuitive.
- Performance with large datasets: Some users report slowdowns when handling very large data sets or high request volumes.
- Deployment and maintenance overhead: The appliance-based deployment requires provisioning the main appliance, remote collectors, and Windows discovery services, plus ongoing maintenance such as disk and database housekeeping.
- Query-based reporting: Custom reports rely on DQL queries that require solid SQL knowledge, and the AI query assistant does not always return the exact results needed.
- Licensing cost: Per-server licensing is considered relatively expensive by some users compared with other discovery tools.
- Documentation gaps: Users noted that parts of the documentation are outdated or unclear.
Source: Device42
3. ServiceNow Service Mapping

Best for: Service-aware operations inside ServiceNow
Strengths: ML-generated service maps tied to the ServiceNow CMDB
Things to consider: Requires ITOM; setup and pricing can be demanding
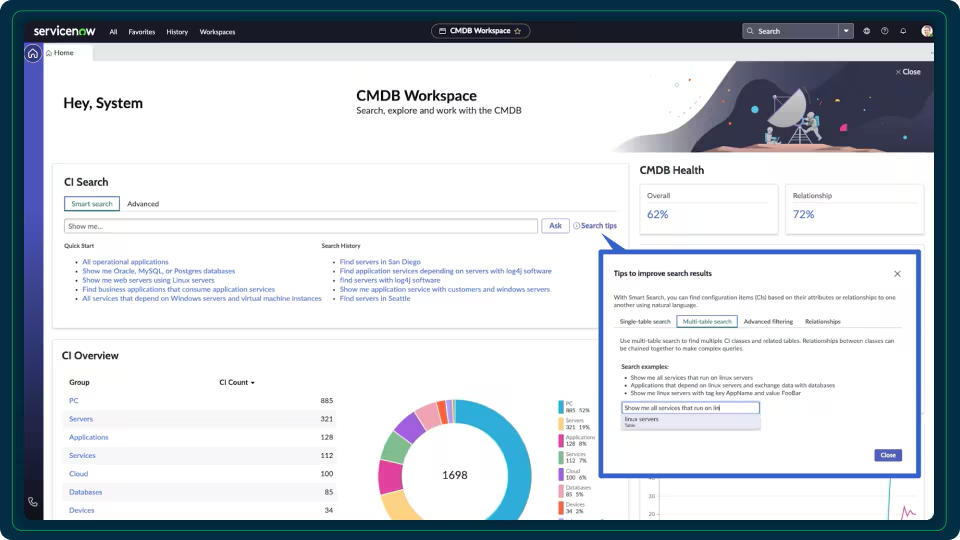
ServiceNow Service Mapping shows the relationships between applications, IT components, and cloud services so that operations teams can diagnose problems and prioritize them by business impact. It is available as part of ServiceNow IT Operations Management, alongside Discovery and the ServiceNow CMDB.
Service Mapping generates maps with machine learning using tag-based, top-down, and traffic-based methods, and it reuses existing discovery data and mechanisms. Maps update automatically when a change is detected, and integration with the CMDB creates a service-aware record that other ServiceNow workflows can use.
Key features include:
- ML-generated service maps: Builds service maps automatically using tag-based, top-down, and traffic-based mapping methods.
- Multicloud mapping: Provides out-of-the-box discovery and mapping support for widely used cloud platforms.
- Automatic map updates: Refreshes service maps whenever a change is detected in the environment.
- CMDB integration: Writes service relationships into the ServiceNow CMDB, creating a single service-aware system of action.
- Business impact prioritization: Lets teams diagnose problems and rank them by the business services they affect.
- Reuse of existing discovery data: Enhances service maps with discovery data and mechanisms already in place.
Limitations (as reported by users on PeerSpot):
- Mapping setup effort: Users describe service mapping as difficult to set up, particularly for non-IP devices, and some organizations rely on third-party partners for implementation.
- Pricing: ITOM pricing is considered high, and users note it is most affordable for large organizations.
- CMDB complexity: Some users find the CMDB component complicated and slow in their environment.
- Support response times: Some users report that vendor support can take a long time to resolve both minor and major issues.
- Adoption and onboarding: Organizations moving from other tools report challenges with data migration and consistency during onboarding.
Source: ServiceNow

Full-Stack Observability Platforms
4. Datadog APM
Best for: Code-level tracing correlated with logs and metrics
Strengths: Watchdog AI, change tracking, OpenTelemetry support
Things to consider: Complex agent setup; costs grow with ingestion
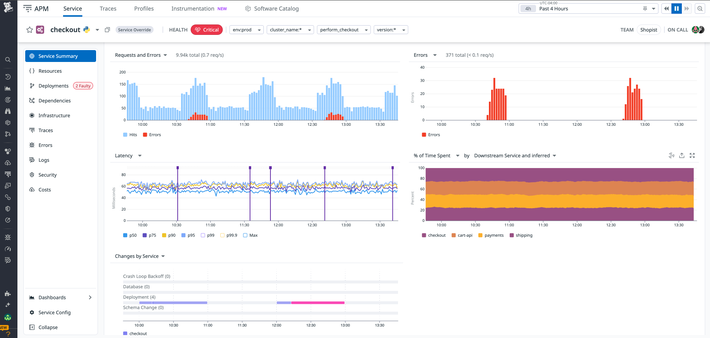
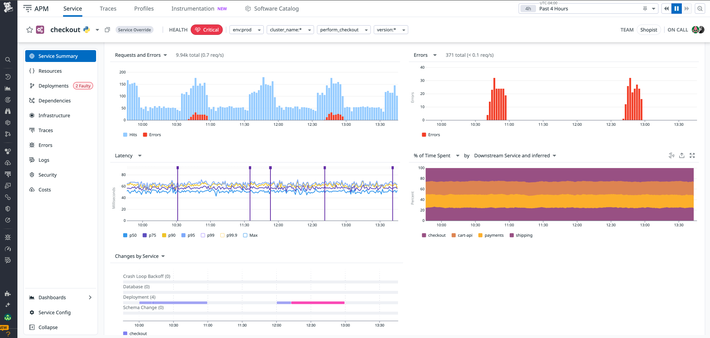
Datadog Application Performance Monitoring (APM) provides distributed tracing from browser and mobile applications through backend services and databases. It correlates traces with logs, infrastructure metrics, real user monitoring (RUM) data, and security signals, and shows service health metrics and dependencies in a centralized view.
Datadog APM includes thread-level visibility into execution time and resource consumption, change tracking that links performance shifts to deployments and configuration changes, and Watchdog AI for automated root cause analysis and anomaly alerts. Tracing can be set up through the Datadog Agent without code changes, and the product supports native and hybrid OpenTelemetry setups.
Key features include:
- Thread-level distributed tracing: Captures execution time and resource use per method, code line, and thread, and supports querying trace data with relational operators.
- Service observability: Displays service health metrics and dependencies alongside infrastructure and database telemetry, with access to owners, on-call engineers, and runbooks through Software Catalog.
- Change tracking: Correlates performance issues with code deployments, feature flags, configuration changes, and database modifications, and compares metrics across versions.
- Watchdog AI: Runs automated root cause analysis, detects faulty deployments, and generates ML-based alerts for anomalies and outliers.
- SLOs and span-based metrics: Creates dashboards, monitors, and SLOs from span-based metrics using any tag, configurable through the UI, Terraform provider, or APIs.
- Flexible ingestion and sampling: Sets up tracing through the Datadog Agent without code changes and provides sampling controls at the host, service, and endpoint level.
- OpenTelemetry and serverless support: Supports native and hybrid OpenTelemetry setups and auto-instruments serverless functions, including AWS Lambda.
Limitations (as reported by users on AWS Marketplace):
- Complex initial setup: Users find agent installation and configuration complex, particularly in containerized Docker environments.
- Dense interface: The UI can feel cluttered or overwhelming for new users, with dense information and controls on every screen.
- Pricing and cost management: Users describe pricing as steep and note that managing costs for log ingestion and custom metrics can become complex.
- Documentation complexity: Some users find the documentation difficult to work through.
- Customization limits: Some users run into feature limitations when customizing the platform in depth.
Source: Datadog
5. Dynatrace
Best for: AI-driven observability with automatic topology mapping
Strengths: Smartscape, Grail data lakehouse, DQL queries
Things to consider: Platform breadth can overwhelm; cost guidance unclear
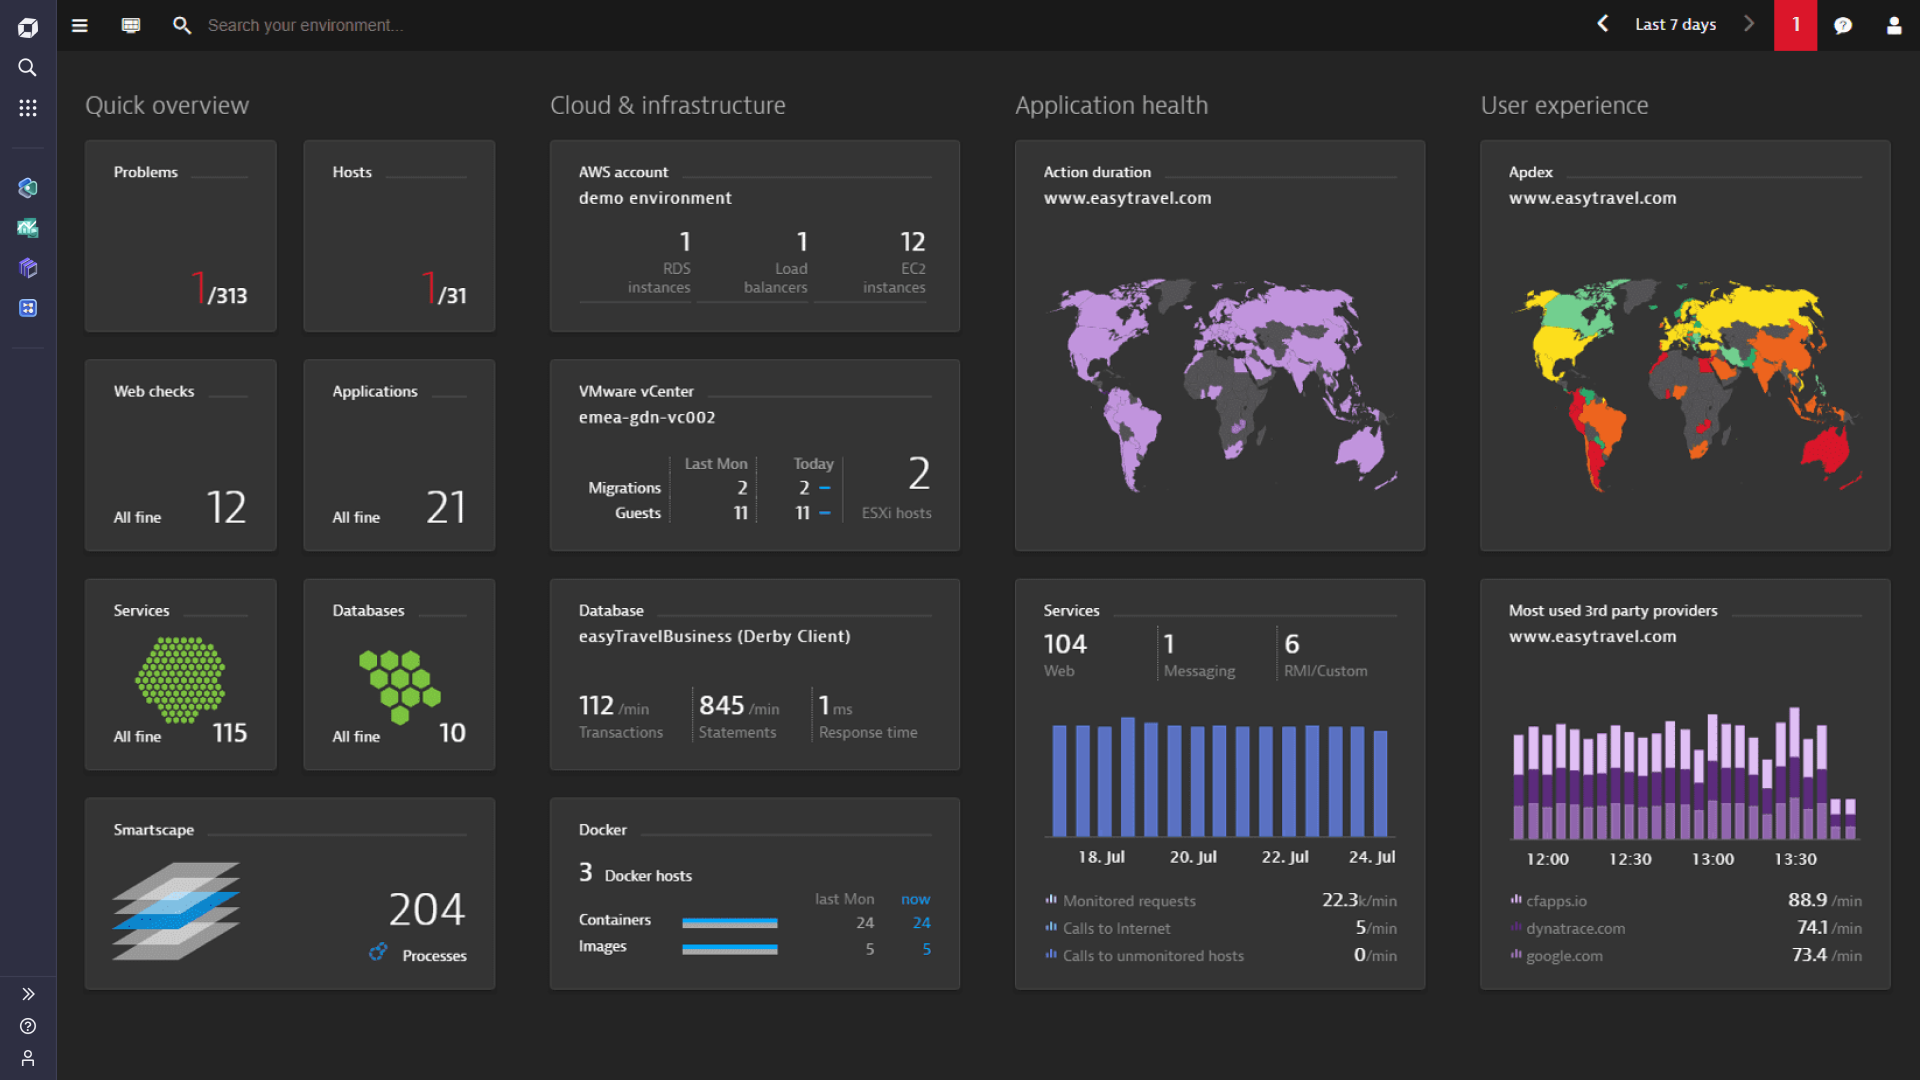
Dynatrace is an observability platform that combines infrastructure, application, AI, log, digital experience, and security observability. Smartscape automatically maps the interactions between applications and the underlying infrastructure and uses that map to add context to telemetry. Dynatrace Intelligence coordinates built-in and third-party AI agents to support prevention, remediation, and optimization.
Data is stored in Grail, a causal data lakehouse with schema-on-read storage, and teams query it with Dynatrace Query Language (DQL). OneAgent collects metrics across the application delivery chain after a single deployment per host, PurePath captures code-level distributed traces, and OpenPipeline processes and enriches incoming data streams. AppEngine lets teams build custom apps on the platform.
Key features include:
- Smartscape topology mapping: Automatically identifies and maps relationships between applications and infrastructure in real time and uses the map to contextualize data.
- Dynatrace Intelligence: Provides agentic AI operations that orchestrate built-in and third-party agents using contextual data.
- Grail data lakehouse: Stores observability, security, and business data with indexless, schema-on-read storage and massively parallel processing.
- Dynatrace Query Language (DQL): Joins spans, logs, and other data types in a single query for analysis and dashboarding.
- OneAgent and PurePath: OneAgent collects metrics continuously from a single host deployment, and PurePath captures timing and code-level context for distributed traces end to end.
- OpenPipeline: Ingests, enriches, and contextualizes data from any source, including open source data sets, through stream processing.
- AppEngine: Lets teams build and share custom apps that use observability, security, and business data.
Limitations (as reported by users on AWS Marketplace):
- Platform complexity: The range of capabilities can feel overwhelming, and some users say best practices and cost efficiency for administering the platform are not clearly explained.
- Cost: Some users consider Dynatrace costly, and note that data processing charges can exceed initial licensing costs.
- Smartscape usability: Some users find the Smartscape architectural map cluttered and cumbersome to use.
- Documentation and navigation: Documentation spans both classic and Gen3 versions, which can be confusing, and certain configurations require navigating multiple screens.
- CI and DORA metrics: Users report that DORA metrics and CI event integration are still maturing.
Source: Dynatrace

6. New Relic
Best for: Unified telemetry with AI monitoring and natural-language access
Strengths: Service maps, AI agent traces, 100 GB free monthly ingest
Things to consider: Ingestion-based pricing hard to predict; alert tuning needed
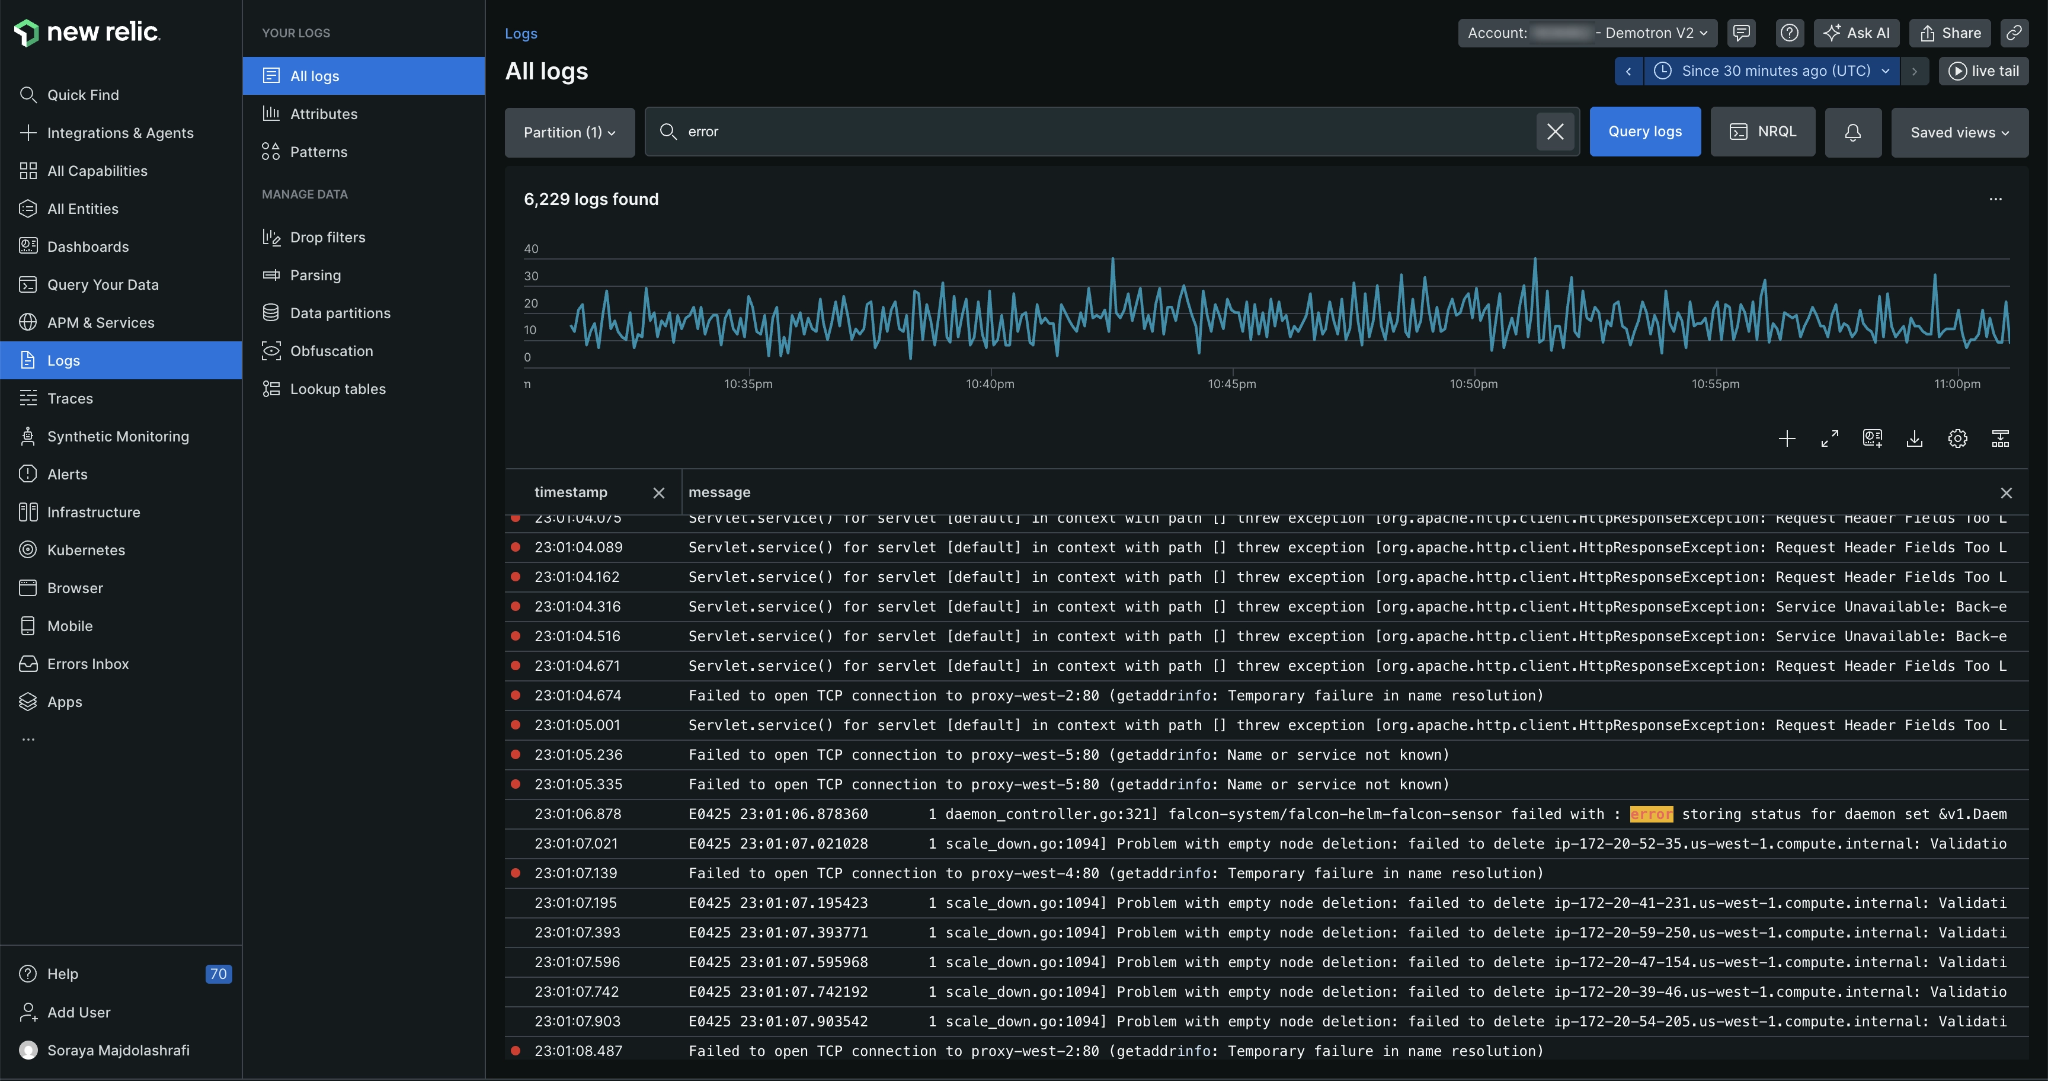
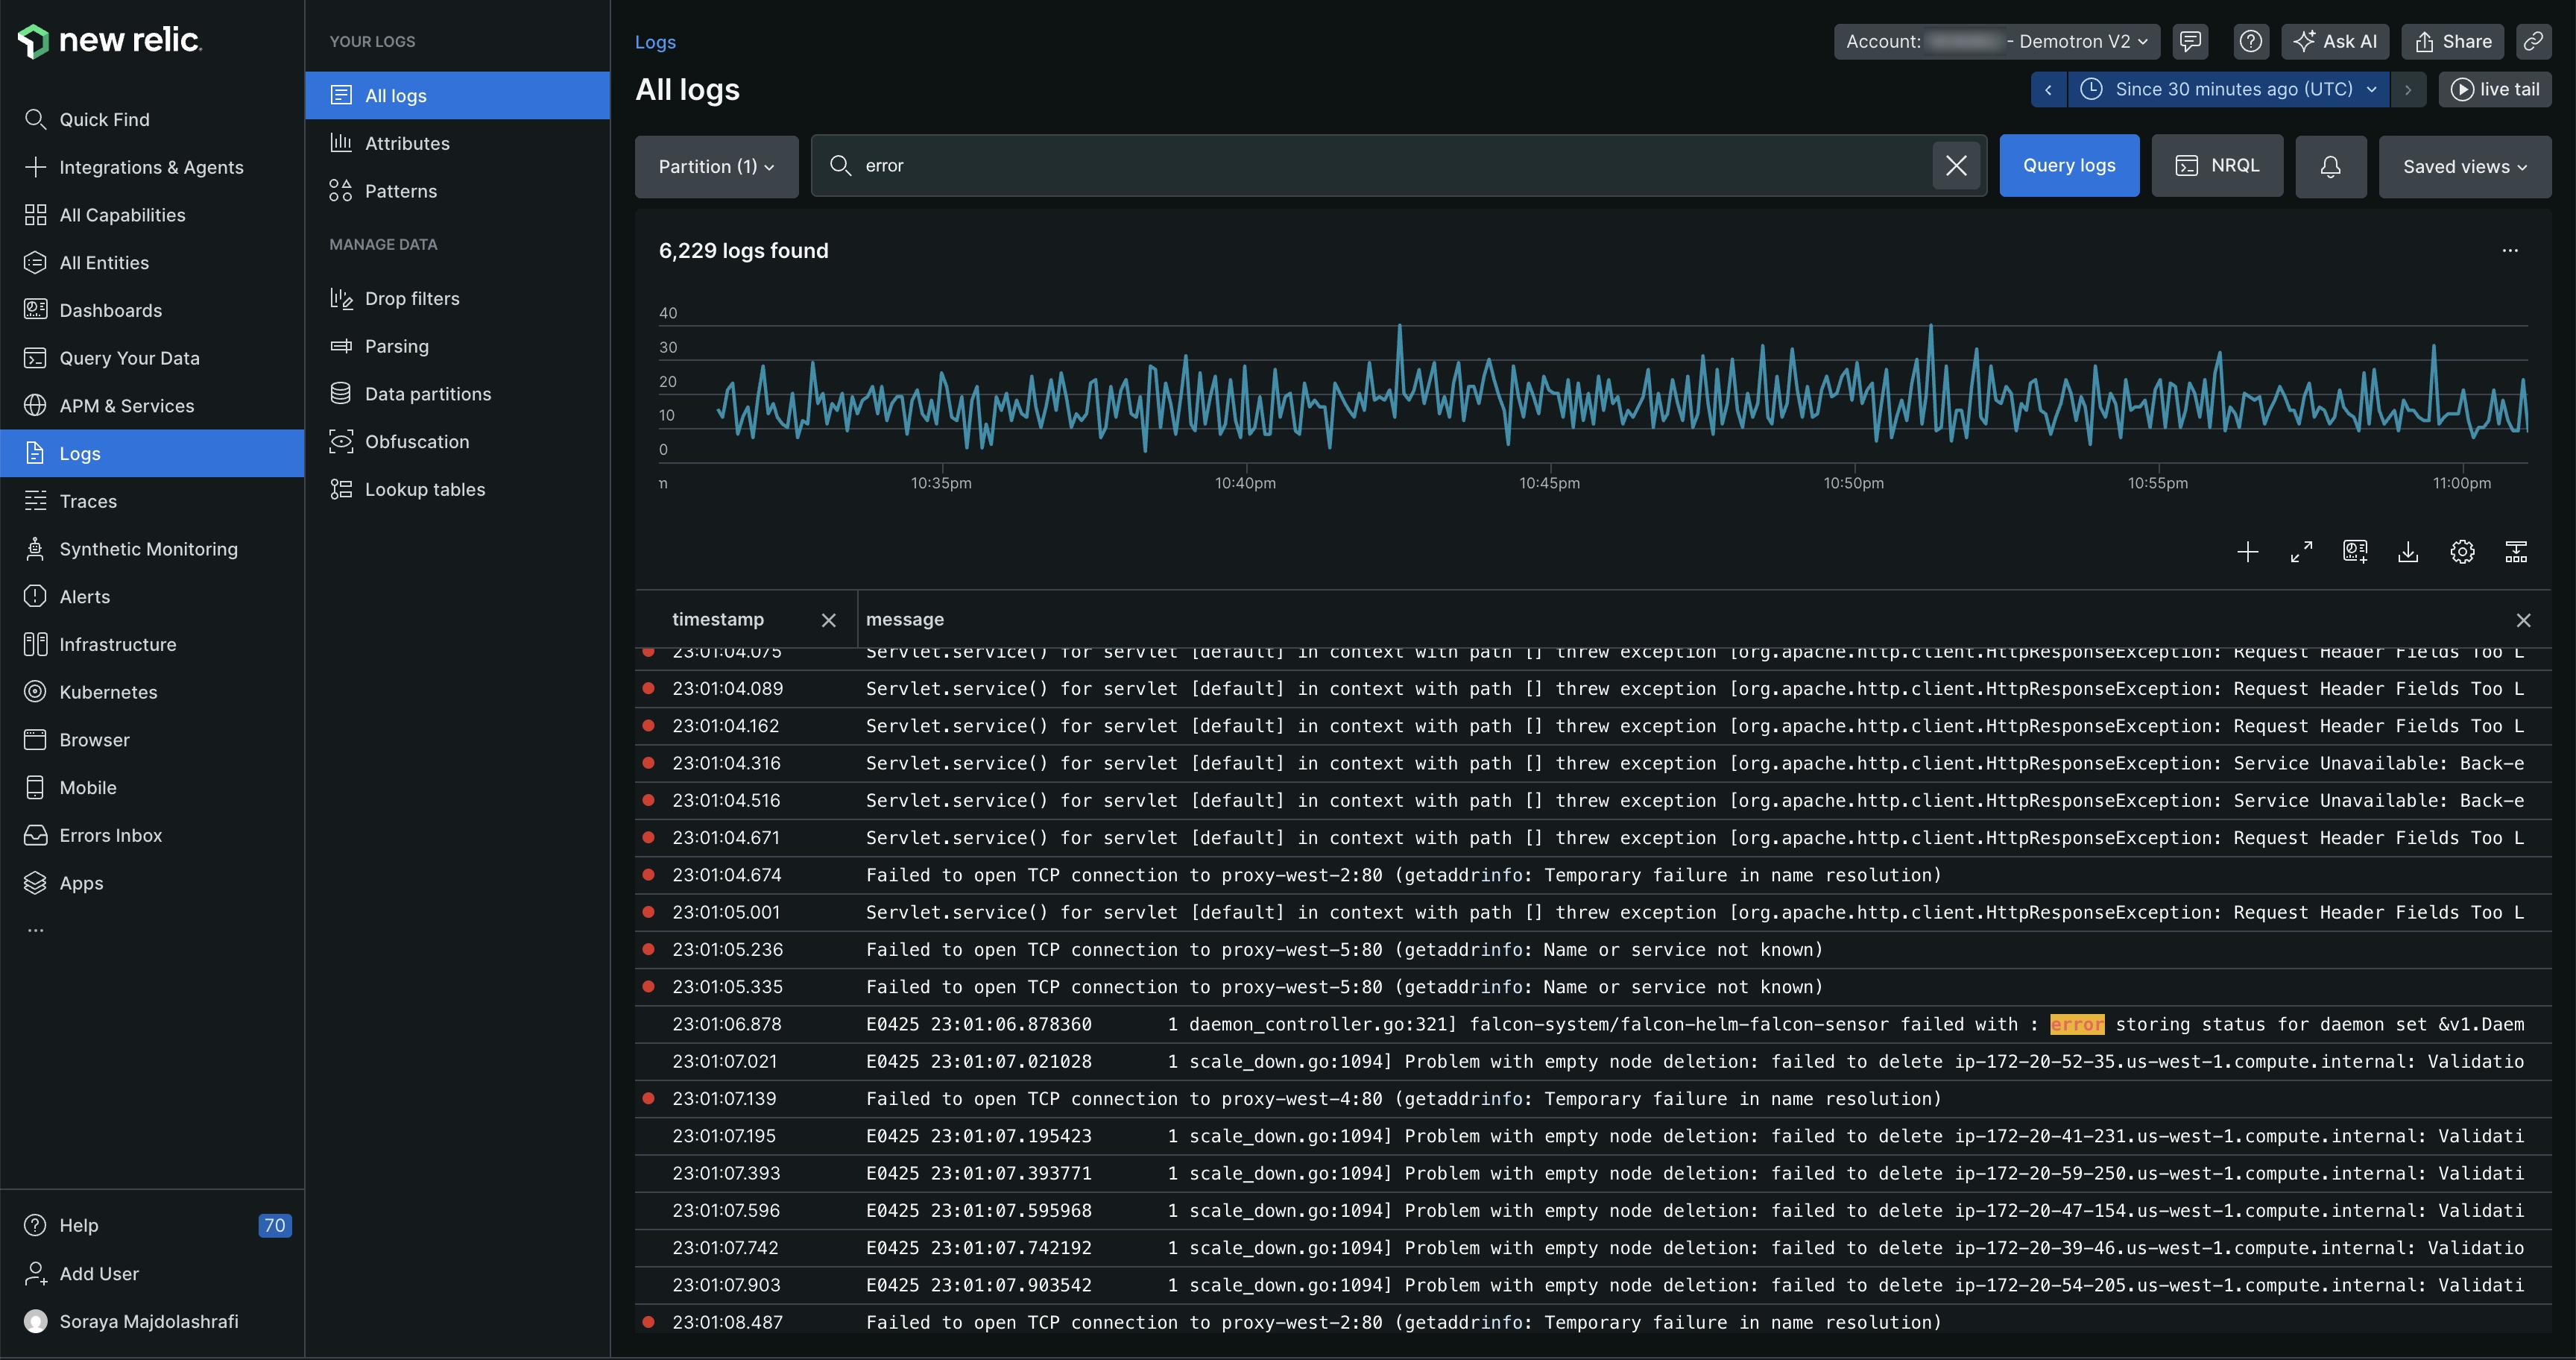
New Relic is an observability platform that brings application, infrastructure, log, digital experience, and AI system telemetry into one data layer. It supports OpenTelemetry, Prometheus, StatsD, eBPF, and existing telemetry pipelines, and it fuses telemetry with runbooks, service catalogs, and incident data for operational context.
Built-in AI provides automatic root cause analysis, predictive alerting, and natural-language access to data. APM includes distributed tracing and service maps, and AI Monitoring tracks model performance, prompt analytics, response quality, cost, and agent traces. Pricing is usage-based, and every account includes 100 GB of free data ingest per month.
Key features include:
- AI-driven analysis: Performs automatic root cause analysis, shows what changed and recommended next steps, and supports natural-language questions.
- Predictive alerting: Flags issues before customers notice and builds alert coverage based on how applications behave.
- APM with service maps: Provides distributed tracing, service maps, an errors inbox, and code-level metrics.
- AI Monitoring: Tracks model performance, prompt analytics, cost, response quality, and agent traces for AI applications.
- Open data ingestion: Accepts data from OpenTelemetry, Prometheus, StatsD, eBPF, and existing telemetry pipelines.
- Query anywhere: Analyzes telemetry across data warehouses and lakes without moving data, alongside federated log queries.
- Cloud Cost Intelligence and business KPIs: Provides real-time visibility into cloud spend and connects system performance to revenue, conversion, and operational goals.
Limitations (as reported by users on AWS Marketplace):
- Setup time: Initial setup and configuration can take a while when monitoring multiple services across different environments.
- Interface complexity: The breadth of features can make the interface feel overwhelming for new users, with many options on the same screen.
- Unpredictable pricing: Costs tied to data ingestion can grow quickly as logs and traces increase, making spending hard to predict.
- Alert noise: Default alert policies can fire frequently, so teams spend time tuning thresholds.
- NRQL learning curve: The query language takes time to learn, and custom dashboards often depend on it.
- Performance with large datasets: Some users report slow responses when querying large datasets during incidents.
Source: New Relic
Best Practices for Adopting CloudWatch Omni
1. Map All Application Dependencies, Including Non-AWS Systems, Before Defining Spaces
Before configuring CloudWatch Omni spaces, inventory the applications, services, databases, APIs, and external dependencies that contribute to each business workflow. Include workloads running in AWS, Microsoft Azure, Google Cloud, and on-premises environments, along with third-party services that could affect application availability or performance.
Use OpenTelemetry instrumentation to capture service interactions and ensure consistent service.name and service.namespace attributes across workloads. Instrument outbound requests so Omni can discover relationships between services. This preparation helps teams identify missing telemetry, determine which AWS accounts and Regions should contribute data to each space, and create application maps that accurately represent distributed dependencies.
2. Configure Centralization Rules for Multi-Account and Multi-Region Telemetry
CloudWatch Omni does not automatically aggregate telemetry across AWS accounts and Regions. Organizations must configure CloudWatch centralization rules that specify source accounts, source Regions, and the destination account and Region hosting the Omni space. These rules allow engineers to investigate distributed applications from a centralized environment.
Use AWS Organizations to manage centralization rules and enable Context Graph where needed for cross-account application mapping. Verify that Transaction Search is enabled in source accounts when centralizing traces. Because centralization does not backfill historical telemetry, activate and validate these rules before relying on Omni for production investigations. Also account for data transfer charges and regional data residency requirements.
3. Define SLOs per Application Before Relying on Dynamic Alerts
Establish service-level objectives (SLOs) for critical applications before configuring alerts in CloudWatch Omni. Define measurable targets for availability, request latency, error rates, and other indicators that directly affect users. For example, a payment processing service might require 99.95% availability and a latency threshold for successful transactions.
Use these objectives to establish meaningful alert conditions based on application performance rather than arbitrary infrastructure thresholds. CloudWatch Application Signals can help track SLO compliance, while Omni alerts can monitor relevant telemetry through queries. Review thresholds against historical traffic patterns and error budgets to reduce false positives, prevent alert fatigue, and prioritize incidents according to their business impact.
4. Scope Team Access with Grants and IAM Policies
Configure CloudWatch Omni access according to the principle of least privilege. Use IAM Identity Center to authenticate users through the organization’s existing identity provider, then assign space access grants based on each team’s responsibilities. Separate administrators who manage workspace settings and integrations from engineers who only need to investigate telemetry.
Apply IAM policies and data scopes to restrict access to sensitive operational information. However, data scopes filter log and trace query results rather than providing universal protection across every Omni feature. Dataset creation, exports, AI-assisted operations, and metric access may require additional permission restrictions. Regularly review grants and policies, especially when onboarding new teams or connecting services that process sensitive data.
5. Track Query Scan Volume to Control Omni Costs
CloudWatch Omni pricing depends partly on the amount of telemetry scanned during investigations. AWS includes monthly log and trace query volume equal to five times eligible ingestion, but scans beyond that allowance incur additional charges. PromQL queries are billed separately according to the number of metric samples scanned.
Monitor query consumption and establish usage baselines for engineering teams. Encourage engineers to narrow time ranges, apply selective filters, and avoid repeatedly scanning large datasets when smaller queries can answer the same question. Use AWS Cost Explorer and AWS Budgets to track overall CloudWatch spending, and periodically review ingestion volumes, retention settings, and centralization configurations. These practices help organizations maintain predictable observability costs as application complexity and telemetry volume increase.