TL;DR: Application dependency mapping tools reveal how applications connect across on-premises and cloud infrastructure. Faddom is best for agentless hybrid mapping in under an hour, Device42 CMDB-backed asset context, ServiceNow Service Mapping ITSM-driven service models, and Dynatrace real-time topology inside observability.
What Is Application Dependency Mapping?
Application dependency mapping is the process of identifying and documenting the relationships between an application and the components it relies on. These dependencies can include databases, APIs, servers, cloud services, network connections, and other applications.
A dependency map shows how these components communicate and how data or requests move between them. Teams use this information to understand application architecture, troubleshoot failures, assess the impact of changes, and plan migrations. It also helps identify critical dependencies that may not be visible from source code or configuration files alone.
This is part of a series of articles about application mapping
Application Dependency Mapping Tools at a Glance
The table below summarizes the key differences between the tools covered in this guide. Each one is explored in more detail in the sections that follow.
| Category | Solution | Best For | Key Strengths | Things to Consider |
| Hybrid discovery and dependency mapping | Faddom | Agentless mapping across hybrid on-prem and cloud | Passive collection, no agents or credentials, fast first maps | Terminology takes time to learn; export options are limited |
| Hybrid discovery and dependency mapping | Device42 | Dependency mapping tied to a hybrid CMDB and inventory | Application groups built from real communication patterns | Mapping can slow at large scale; Kubernetes support is limited |
| Hybrid discovery and dependency mapping | BMC Helix Discovery | Enterprise asset discovery with service modeling | Agentless continuous discovery with blueprint service models | Complex licensing and setup; storage and IoT coverage gaps |
| Hybrid discovery and dependency mapping | ServiceNow Service Mapping | Mapping business services into a ServiceNow CMDB | Top-down, tag-based, traffic-based, and service mesh methods | Mapping effort is significant; licensing is costly and rigid |
| Observability platforms with dependency mapping | Dynatrace Smartscape | Real-time topology inside a full observability platform | Continuous auto-discovery with no manual tagging | Agent rollout and cost grow with environment size |
| Observability platforms with dependency mapping | Datadog Universal Service Monitoring | Service maps without instrumenting application code | eBPF discovery of first- and third-party services | Costs can rise quickly; alerts need tuning |
| Observability platforms with dependency mapping | SolarWinds Server & Application Monitor | Connection-level maps tied to server monitoring | Dependency polling plus connection quality polling | Console can be slow; reporting and upgrades draw complaints |
| Observability platforms with dependency mapping | ManageEngine Applications Manager | Scheduled discovery and maps with CMDB sync | IP-range discovery, dependency maps, business service views | Scale and integrations limit use in complex estates |
Why Is Application Dependency Mapping Important in Hybrid Environments?
Hybrid Infrastructure Creates Fragmented Visibility
Hybrid infrastructure is often monitored with separate tools for servers, networks, containers, cloud platforms, and applications. Each tool may provide detailed information about its own environment but little context about external dependencies. As a result, teams can see individual components without understanding the complete path that supports an application.
Dependency mapping combines relationship data across these environments. For example, it can show that a cloud-hosted web service sends requests through a VPN to an on-premises application server, which then queries a local database. This context helps teams trace failures across infrastructure boundaries instead of troubleshooting each environment independently.
Fragmented visibility can also make impact analysis difficult. If a network link, server, API, or database is changed, teams need to know which applications depend on it. An up-to-date dependency map provides this information before changes are made.
Related content: Read our guide on application topology and why mapping it matters.
Applications Depend on Both On-Premises and Cloud Resources
Moving an application to the cloud does not necessarily move all of its dependencies. A cloud-hosted workload may still rely on an on-premises database, identity provider, message queue, file system, DNS service, or legacy application. These connections can remain critical even when most application components run in the cloud.
Cross-environment dependencies affect availability and performance. For example, a cloud application that frequently queries an on-premises database may experience higher latency or fail when the connection between environments is unavailable. Dependency mapping makes these relationships visible so teams can identify network-sensitive and business-critical connections.
This information is also useful during cloud migrations. Teams can determine which components need to move together, which dependencies can remain on-premises, and which connections require redesign. It reduces the risk of migrating an application while overlooking a service it still needs to operate.
Related content: Read our article about on-premise application dependency mapping software.
Dynamic Workloads Make Manual Dependency Mapping Difficult
Cloud instances, containers, and orchestrated workloads can be created, replaced, scaled, or removed automatically. Their IP addresses and runtime locations may also change frequently. Static architecture diagrams and manually maintained inventories therefore become outdated quickly and may not represent the application’s current dependencies.
Automated dependency mapping addresses this problem by collecting runtime information from sources such as network traffic, infrastructure APIs, agents, service discovery systems, and application telemetry. It can use this data to identify active communication between components and update dependency relationships as the environment changes.
Continuous mapping is especially useful in containerized and autoscaling environments. Instead of treating every short-lived instance as a permanent component, mapping systems can associate dependencies with logical services or workload groups. This gives operations teams a stable view of application relationships even when the underlying resources change frequently.
Key Capabilities to Look for in Application Dependency Mapping Tools in Hybrid Environments
1. Automated Discovery Across On-Premises and Cloud Environments
Automated discovery identifies application components and their relationships without requiring teams to document every connection manually. A tool should discover relevant resources across the hybrid environment, including:
- Physical and virtual servers
- Cloud instances
- Applications
- Network devices
- Databases
Cross-environment discovery is particularly important when a workload in one location depends on services elsewhere. The resulting map should show these relationships in the same context rather than creating isolated views for each data center or cloud provider.
2. Agent-Based and Agentless Discovery Options
Agent-based discovery uses software installed on hosts or workloads to collect detailed information about:
- Processes
- Connections
- Resource usage
It can provide deep visibility but introduces deployment and maintenance requirements, particularly across large server estates. Agentless approaches collect information through network traffic, APIs, remote protocols, or existing telemetry. They can cover systems where installing an agent is impractical or prohibited. Tools that support both approaches allow teams to select the appropriate discovery method for different parts of a hybrid environment.
3. Real-Time and Continuous Dependency Mapping
Dependencies in hybrid environments change as:
- Instances scale
- Containers restart
- Deployments occur
- Services move between hosts
Periodic manual scans can miss short-lived relationships or preserve dependencies that no longer exist. Continuous mapping updates relationships as the environment changes. Historical data is also valuable because it allows teams to compare dependencies before and after a deployment, investigate past incidents, and determine when a new connection first appeared.
Related content: Read our comparison of the top application dependency mapping solutions.
4. Application-to-Application Dependency Visibility
Many business services depend on other applications rather than only infrastructure components. For example, an order processing application may use APIs or messaging systems to call:
- Inventory applications
- Payment applications
- Authentication mechanisms
- Notification applications
A mapping tool should represent these application-to-application relationships clearly. This makes it easier to identify upstream and downstream dependencies, understand failure propagation, and assess which business services could be affected by an application outage or planned change.
5. Service, Process, and Database-Level Mapping
Host-level relationships alone may not explain why two systems communicate. Detailed mapping should identify the services and processes creating connections and, where possible, the databases or database services they access.
This detail helps distinguish meaningful application dependencies from unrelated traffic on the same host. It also supports migration planning by revealing components that must remain available for an application to function, such as:
- Background services
- Scheduled processes
- Database connections
- Middleware
6. Network Flow and Communication Analysis
Network flow analysis identifies which systems communicate, the protocols and ports they use, and the direction and frequency of traffic. This information can expose dependencies that are not documented in application configuration or architecture diagrams.
For hybrid environments, the tool should follow communication across data center, VPN, private connectivity, and cloud network boundaries. Traffic patterns can also help identify latency-sensitive connections, unexpected communication paths, and dependencies affected by firewall or routing changes.
7. Kubernetes and Container Dependency Mapping
Containers are short-lived and may move between nodes or change addresses frequently. Rather than representing containers only as individual network endpoints, mapping tools should understand Kubernetes concepts such as:
- Clusters
- Namespaces
- Pods
- Services
- Deployments
- Ingress
The tool should associate changing container instances with stable application services and show communication between workloads. This makes dependency maps useful during scaling, rolling deployments, and pod replacement without filling the map with obsolete runtime objects.
8. Cloud-Native Service and Managed Service Visibility
Modern applications increasingly depend on managed cloud services that do not appear as conventional servers. Examples include:
- Managed databases
- Object storage
- Serverless functions
- Message queues
- API gateways
- Load balancers
- Identity services
Dependency mapping tools should use cloud APIs and telemetry to identify these resources and connect them to the workloads that use them. In multi-cloud environments, they should normalize relationships across providers while retaining provider-specific details needed for troubleshooting and operational analysis.
Notable Application Dependency Mapping Tools for Hybrid Environments
How we selected these tools: We shortlisted application dependency mapping tools based on automated discovery across on-premises and cloud environments, agent-based and agentless collection options, continuous real-time mapping, application-to-application and service-level visibility, network flow analysis, and coverage of Kubernetes and managed cloud services.
Hybrid Infrastructure Discovery and Dependency Mapping Platforms
1. Faddom

Best for: Agentless dependency mapping across hybrid on-prem and cloud
Strengths: Passive collection, no agents or credentials, fast first maps
Things to consider: Terminology takes time to learn; export options are limited
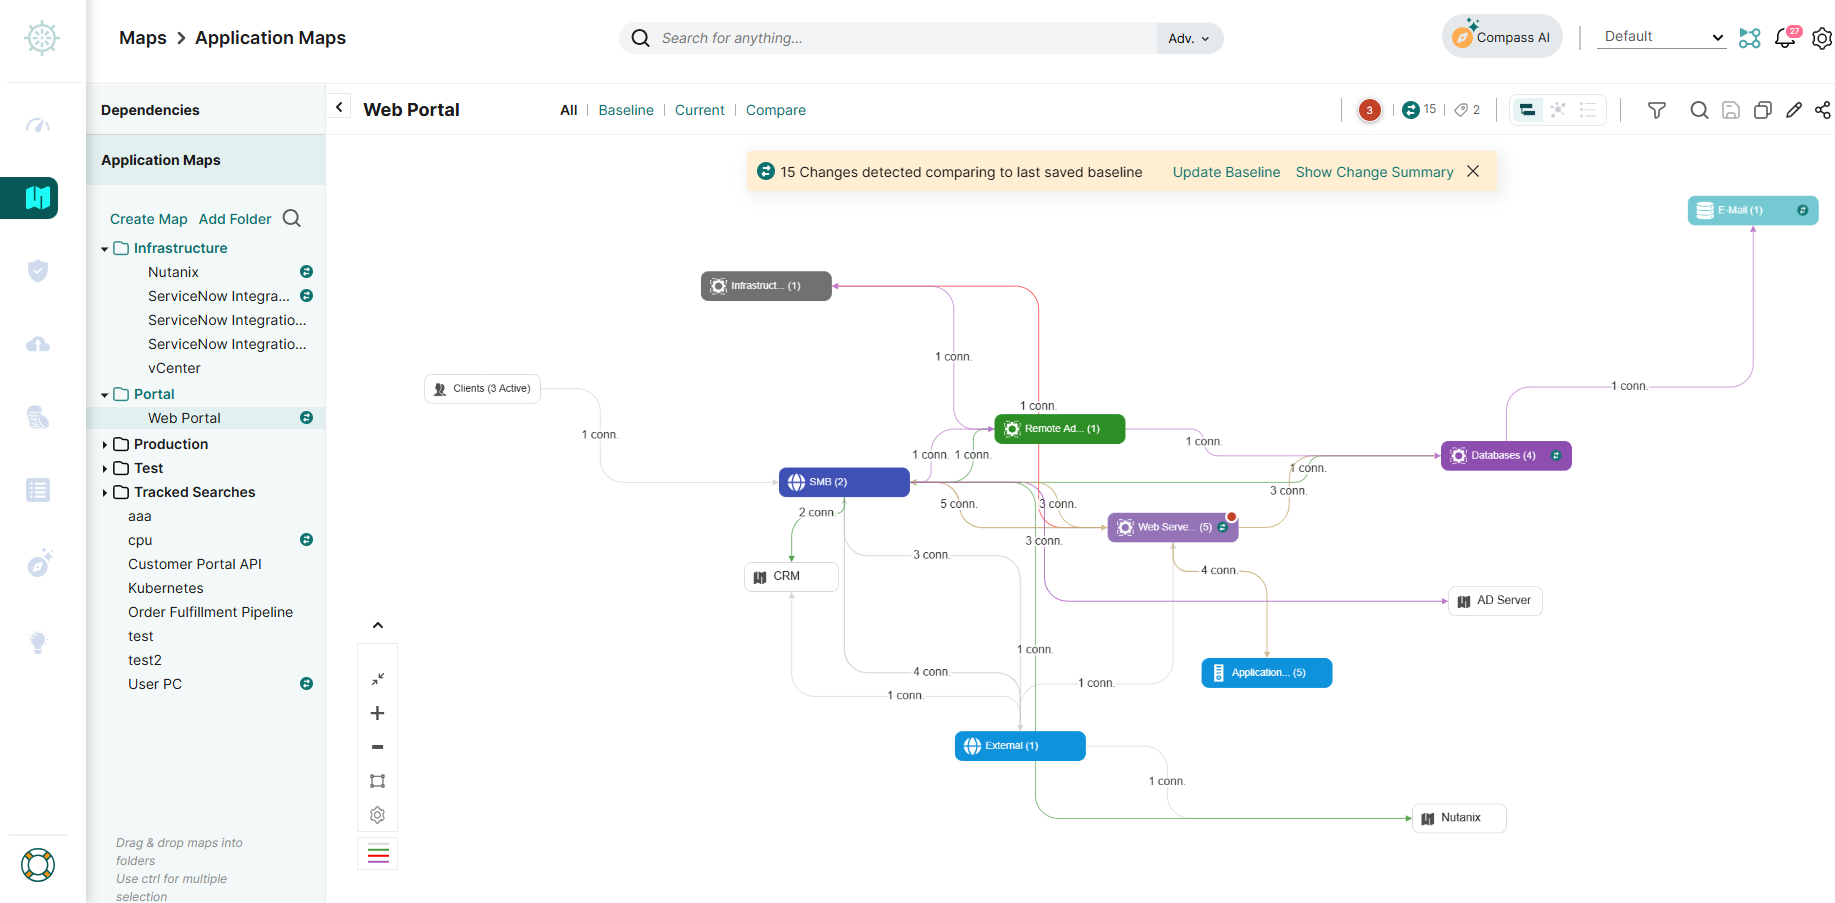
Faddom is an agentless application dependency mapping platform that discovers servers and cloud instances and groups them automatically by business application. It applies AI-driven correlation to raw network data to produce real-time application and dependency maps of hybrid topologies.
Deployment is lightweight and self-service. Faddom collects data passively using read-only permissions, so it does not require installing agents, opening firewalls, supplying server credentials, or configuring traffic mirroring. First maps appear within an hour of deployment, and the platform can run without internet access so collected data stays inside the environment.
Key features include:
- Agentless passive collection: Faddom analyzes a copy of network traffic with read-only permissions, avoiding agents on servers, stored credentials, and firewall reconfiguration.
- Standard protocol coverage: Collection runs over NetFlow, sFlow, IPFIX, SNMP, WMI, SSH, ETW, and syslog, alongside AWS flow logs and Azure VNet flow logs.
- Multi-source hybrid correlation: Data from network traffic, infrastructure, and cloud-native sources is correlated into a single view spanning on-premises, cloud, and hybrid infrastructure.
- Automatic business application grouping: Discovered servers are grouped into business applications automatically, so maps carry application context rather than showing isolated hosts.
- Continuous updates in dynamic environments: Maps refresh around the clock and adapt to infrastructure and application changes, keeping dependency data current as workloads move or scale.
- Change management and migration planning: Dependency data supports impact analysis ahead of changes and wave-based planning for data center and cloud migrations.
- Integrations with operations and security tools: Real-time dependency context is fed into ITSM and CMDB records and into segmentation, identity, and vulnerability tooling, with open APIs, webhooks, and standard protocols for additional systems.
Limitations (as reported by users on G2):
- Terminology learning curve: Some reviewers note that Faddom’s naming conventions and concepts take a little time to become familiar with during initial setup.
- Report export flexibility: Users mention that exporting certain lists and reports, and the size of some on-screen fields, could be more accommodating.
- Pricing tied to scale: Costs are linked to the number of subscribed units, which reviewers say benefits from planning as an environment grows.
2. Device42

Best for: Dependency mapping tied to a hybrid CMDB and asset inventory
Strengths: Application groups built from real communication patterns
Things to consider: Mapping can slow at large scale; Kubernetes support is limited
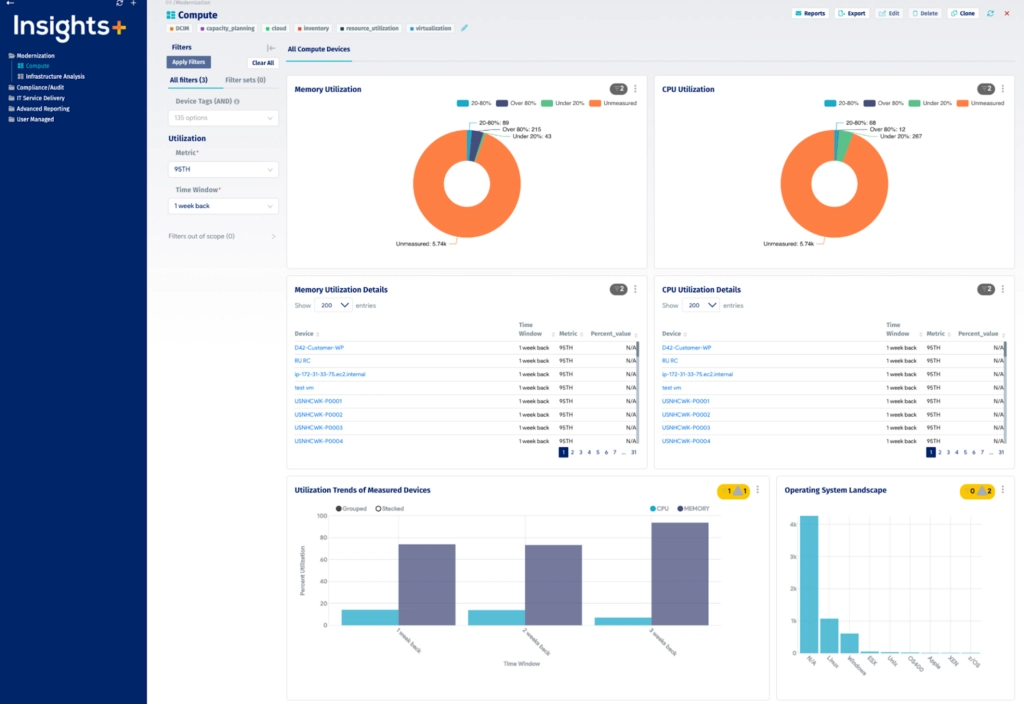
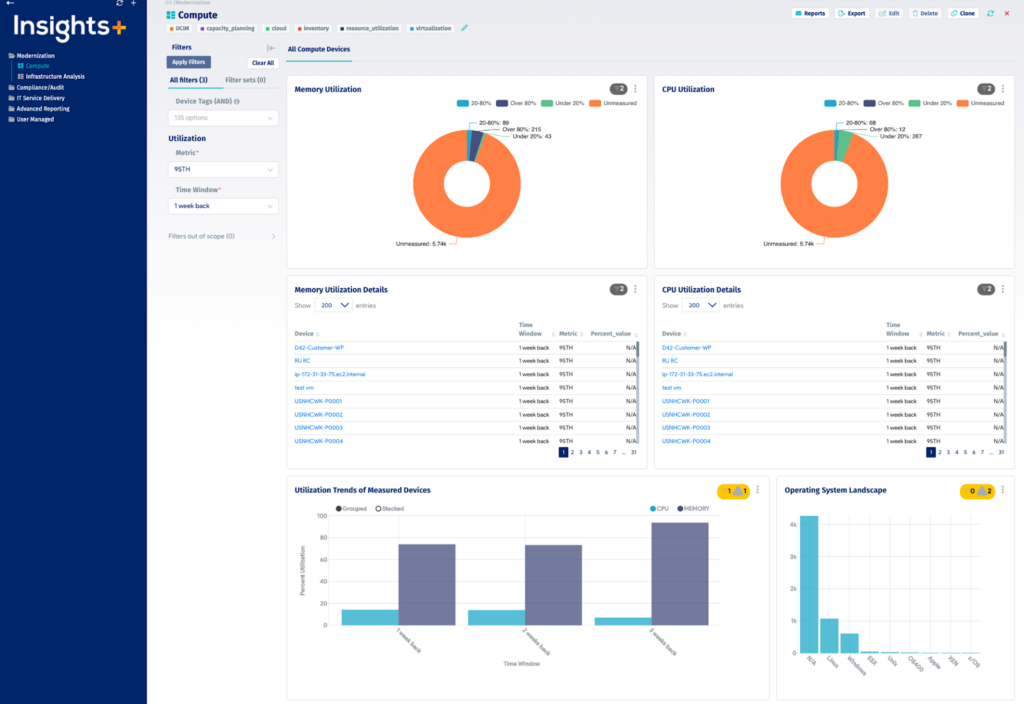
Device42 provides dependency mapping inside a broader discovery, CMDB, and data center management platform. It shows how applications, networks, and services connect across on-premises, cloud, and hybrid environments, and it builds those relationships from observed communication rather than manual documentation.
The same platform also covers infrastructure and cloud discovery, IP address management, SSL certificate discovery, storage discovery, and software license discovery, so dependency data sits alongside asset inventory in one system.
Key features include:
- Application groups from observed traffic: Assets are grouped automatically based on real communication patterns, and calculation rules define membership using criteria such as service type, server inclusion, and start or end points.
- Automated service discovery: Device42 identifies active services and the ports they use, filters out communication fingerprints that do not matter, and returns inter-service dependencies across on-premises, cloud, and hybrid environments without configuring span ports.
- Business services modeling: Business Services combine devices and application groups into a visual representation of a service, enriched with metadata such as application type, owners, SLAs, and disaster recovery details.
- Impact charts and impact lists: Auto-generated diagrams show service connections and ripple effects, while impact lists identify the services a device influences and the organizational groups that rely on it.
- Change tracking over time: Application group charts include a timeline view for following how dependencies shift, and charts can be saved, printed, or exported.
- Cloud and legacy discovery: Cloud Discovery covers AWS and Azure inventory and resource detail, and infrastructure discovery spans mainframes through to containers.
- Migration and retirement analysis: Dependency data shows the components tied to an application before migration and highlights underused or orphaned services that are candidates for consolidation.
Limitations (as reported by users on PeerSpot):
- Performance at scale: Dependency mapping is described as slow in large-scale implementations.
- Kubernetes coverage: Integration is reported as limited for environments running thousands of nodes across multiple clusters.
- Pricing and licensing: Costs are considered high relative to other discovery tools, and the shift to a subscription model drew criticism.
- Documentation currency: Reviewers say documentation has not kept pace with product changes, particularly around dependencies and SNMP configuration.
- Upgrade process: Automatic upgrades require manual intervention, and some upgrades have involved building a new virtual machine.
Source: Device42
3. BMC Helix Discovery

Best for: Enterprise asset discovery with service modeling across clouds
Strengths: Agentless continuous discovery with blueprint service models
Things to consider: Complex licensing and setup; storage and IoT coverage gaps
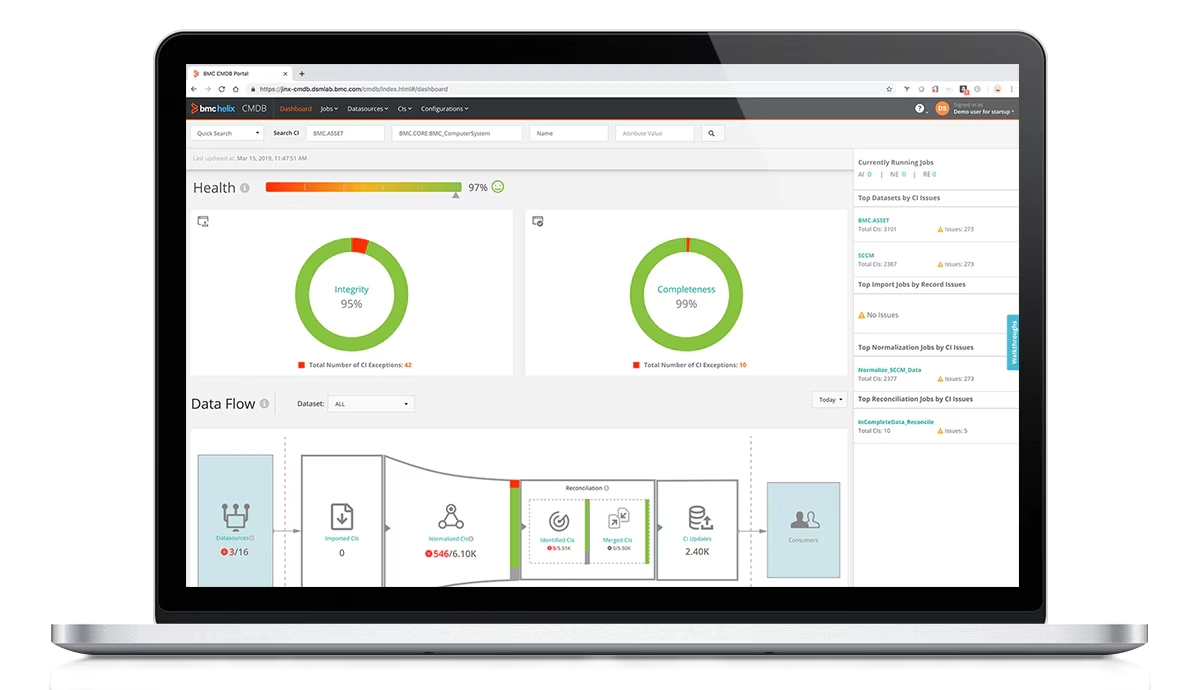
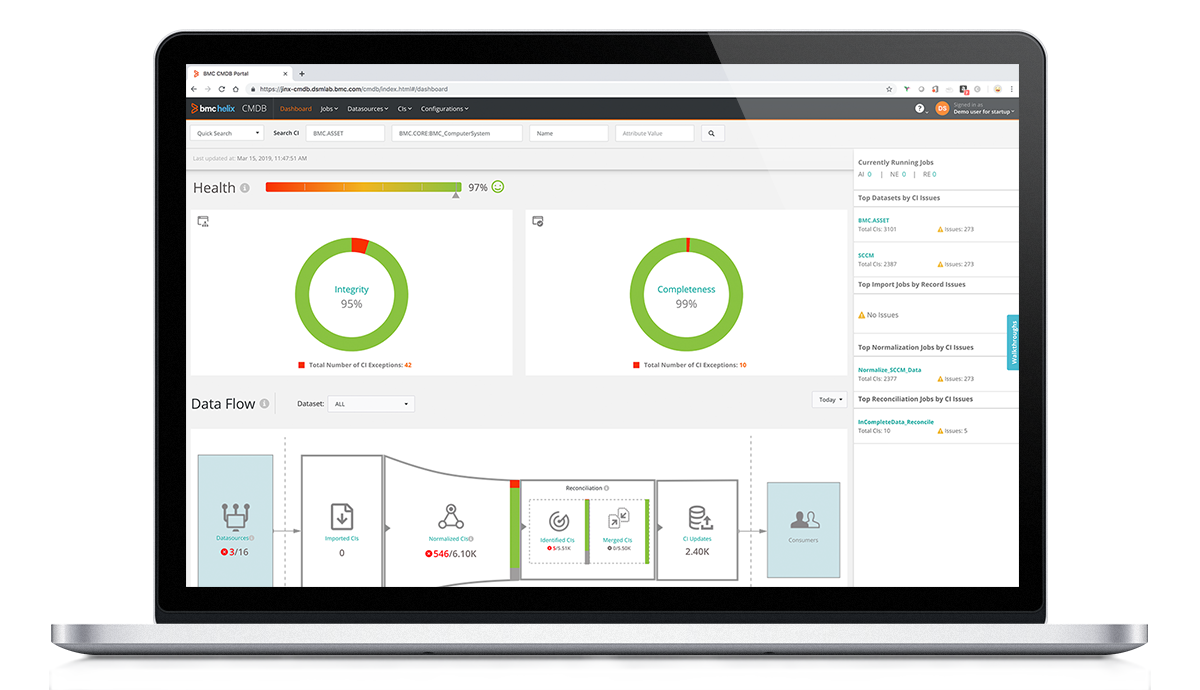
BMC Helix Discovery is a discovery and dependency mapping product that builds a view of IT assets, services, and the relationships between them across cloud and on-premises environments. It is available for SaaS or on-premises deployment.
Discovery data feeds the wider BMC Helix platform, where it is combined with third-party data and telemetry to support service awareness and AIOps. The same asset data is used for security and compliance work, including surfacing undocumented assets and tracking certificates.
Key features include:
- Agentless continuous discovery: Assets are discovered and relationships mapped across cloud and on-premises environments without agents, keeping data current without manual updates.
- Blueprint-automated service modeling: An extensive library of service modeling blueprints is used to build and control a view of the infrastructure supporting a specific business need.
- Data reconciliation: Topology data from diverse sources is unified so teams work from one consistent view rather than several conflicting ones.
- Real-time service awareness: Service models, topology, and telemetry are connected inside the BMC Helix platform to pinpoint root causes and visualize related impacts.
- Blind spot detection: Hidden or undocumented assets, dependencies, and relationships are exposed rather than left out of the record.
- Multi-cloud resource discovery: Resources are discovered and managed across diverse cloud environments with minimal configuration and management overhead.
- Certificate and compliance data: SSL and TLS certificates are discovered across the infrastructure, and automated asset inventories are maintained in a baseline dashboard for audits.
Limitations (as reported by users on PeerSpot):
- Licensing structure: Licenses are issued per asset type, which reviewers describe as complex to manage and costly as topologies grow.
- Storage and database coverage: Users report gaps in storage virtualization classification and in the database configuration data available out of the box.
- Duplicate records: Some reviewers note duplicate entries that require cleanup.
- Ease of use: The product is described as complicated, with less flexible customization than some competing discovery and ITSM tools.
- Client-side and IoT discovery: Coverage centers on data center assets, with less depth for desktops, printers, and IoT devices.
Source: BMC
4. ServiceNow Service Mapping

Best for: Mapping business services into a ServiceNow CMDB
Strengths: Top-down, tag-based, traffic-based, and service mesh methods
Things to consider: Mapping effort is significant; licensing is costly and rigid
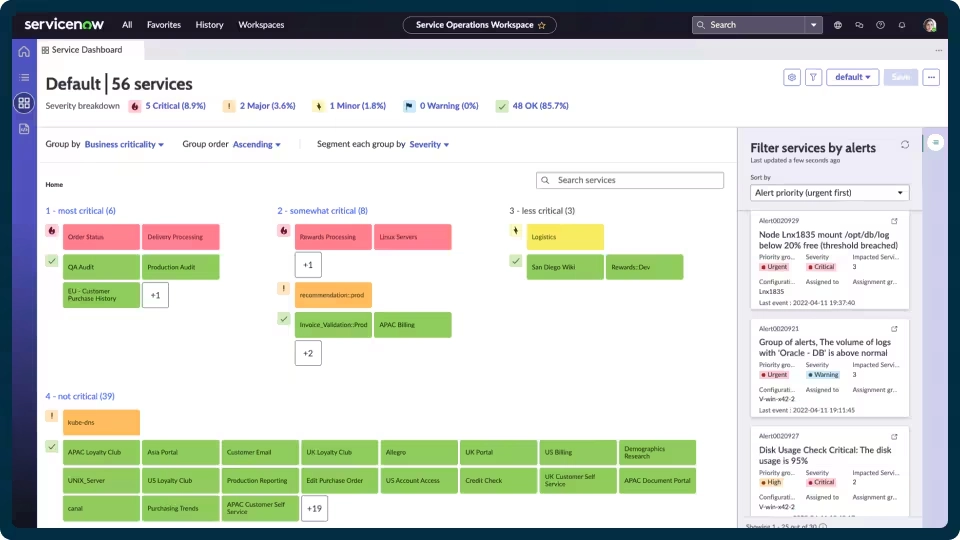
ServiceNow Service Mapping creates records of digital services in the ServiceNow CMDB. It works alongside ServiceNow Discovery, building on already-discovered infrastructure data to identify the configuration items that support a service and the service-specific relationships between them.
Coverage extends to cloud, containerized, serverless, and service mesh architectures. Because maps are stored in the CMDB, the same service context is available to operations, security, and architecture teams for impact analysis, vulnerability prioritization, and cost work.
Key features include:
- Top-down mapping: Mapping traces the applications and infrastructure components behind an application or technical service and the relationships between them, including cloud-native calls such as Lambda to Lambda and Lambda to RDS.
- Tag-based mapping: Where cloud resources follow a consistent tagging policy, ServiceNow reads those tags to assemble a service, identifying member components without the relationships between them.
- Intelligent traffic-based mapping: Machine learning identifies service-level relationships from traffic flow data while filtering out noise, and can extend top-down maps or add relationships to tag-based ones.
- Service mesh and dynamic CI groups: Istio data is used to discover microservices and map connectivity between them, while dynamic CI groups build services from collections of configuration items sharing attributes such as location or cost center.
- Multi-cloud and platform coverage: Services are mapped across AWS, Azure, Google Cloud, and IBM Cloud, and across Kubernetes, Docker, AWS Lambda, VMware, and Citrix.
- Automatic updates and change history: Maps update whenever an infrastructure change affects service delivery, and a full history of topology changes allows comparison between any two points in time.
- Reuse of existing discovery data: Service Mapping uses ServiceNow Discovery data and collection mechanisms rather than requiring a parallel data collection architecture.
Limitations (as reported by users on PeerSpot, covering the wider ServiceNow IT Operations Management suite that Service Mapping is part of):
- Mapping effort: Service mapping is described as time-consuming, with benefits that can be difficult to articulate to stakeholders.
- Setup complexity: Deployment can be complex and lengthy depending on the specifics of the organization.
- Discovery scope: Some reviewers say the discovery side is limited and needs third-party tools for full coverage.
- Pricing and licensing: Costs are described as high, with a licensing model that is rigid and hard to scale down.
- External assistance: Teams report needing help from third-party vendors to map configuration items for end users.
Source: ServiceNow

Observability and Monitoring Platforms with Dependency Mapping
5. Dynatrace Smartscape

Best for: Real-time topology inside a full observability platform
Strengths: Continuous auto-discovery of dependencies with no manual tagging
Things to consider: Agent rollout and cost grow with environment size
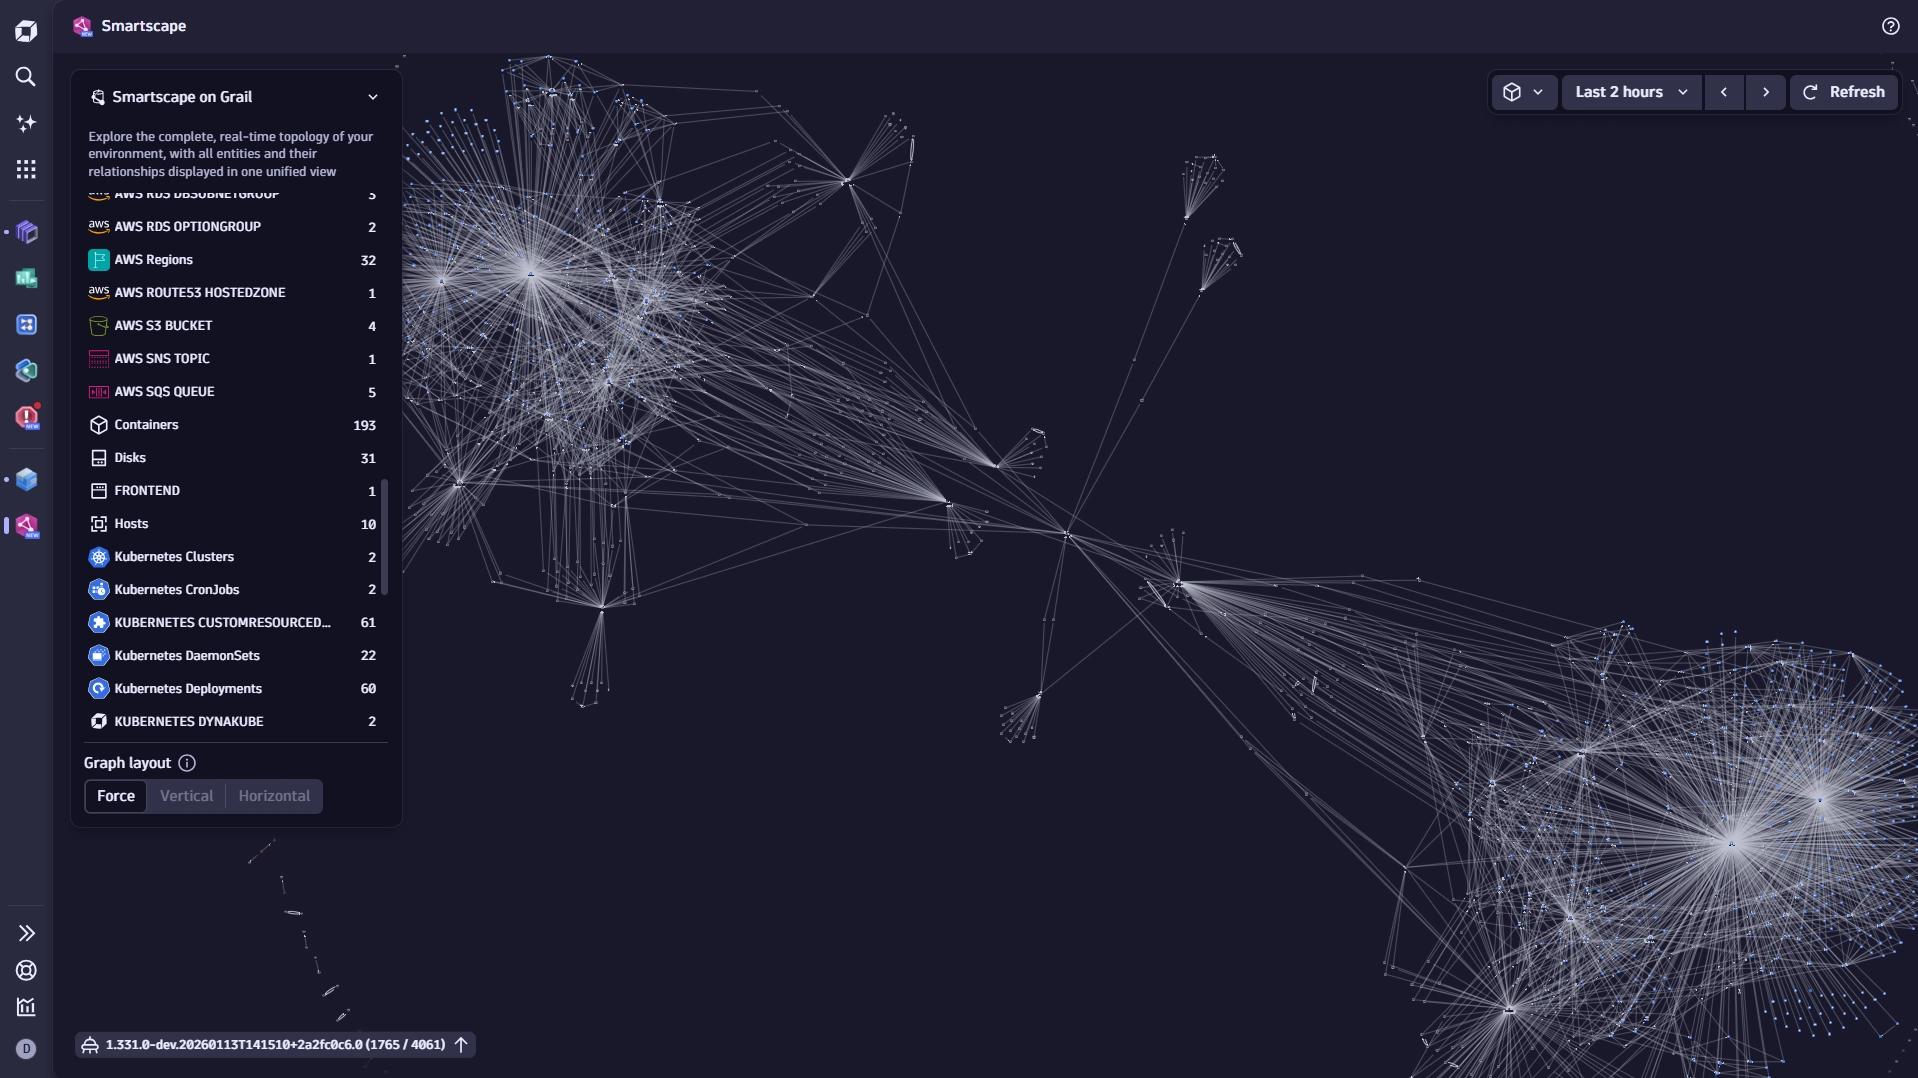
Smartscape is the topology and dependency mapping capability within Dynatrace. It builds a real-time graph of the entities in an environment and the relationships between them, covering cloud, on-premises, and hybrid infrastructure.
Discovery is driven by a single agent. Dynatrace states that it detects the components and dependencies of an entire technology stack in under five minutes with no manual configuration, and that the topology updates automatically as the environment changes.
Key features include:
- Automatic topology discovery: Dynatrace detects websites, applications, services, processes, hosts, networks, and infrastructure along with the causal dependencies between them after a single agent is installed.
- Continuously updated relationships: Smartscape discovers and updates every relationship across the stack automatically, with no manual tagging or upkeep required, so maps do not drift as systems change.
- Upstream and downstream analysis: The graph shows upstream and downstream dependencies, ownership, and blast radius for any component in seconds.
- Kubernetes context: Clusters, namespaces, workloads, and services are surfaced as full-fidelity objects and kept current as ephemeral containers spin up and down, with misconfiguration, drift, and policy violations appearing as they occur.
- Full-stack tiering: Topology is presented across tiers from infrastructure to application, with inbound and outbound call relationships shown within each tier.
- Automatic performance baselining: As the topology is discovered, Dynatrace learns the environment’s normal behavior rather than requiring static thresholds for metrics such as response time and CPU health.
- Input to automated analysis: The dependency graph feeds Dynatrace Intelligence with live context used for root cause analysis and automated remediation.
Limitations (as reported by users on PeerSpot):
- Pricing and licensing: The structure is described as complex and expensive for large-scale deployments.
- Agent deployment overhead: Installing or migrating agents across many distributed servers takes time, and OneAgent is reported as resource-heavy on lightweight or older systems.
- Setup complexity: Configuration is more involved than lighter tooling, particularly in environments with multiple applications and JVMs, and requires significant expertise.
- Third-party integrations: Some reviewers report problems with integrations outside the platform.
- Technology coverage gaps: Monitoring for certain hardware, including GPUs and NPUs, is reported as missing.
Source: Dynatrace
6. Datadog Universal Service Monitoring

Best for: Service dependency maps without instrumenting application code
Strengths: eBPF-based discovery of first- and third-party services
Things to consider: Costs can rise quickly; alerts need tuning
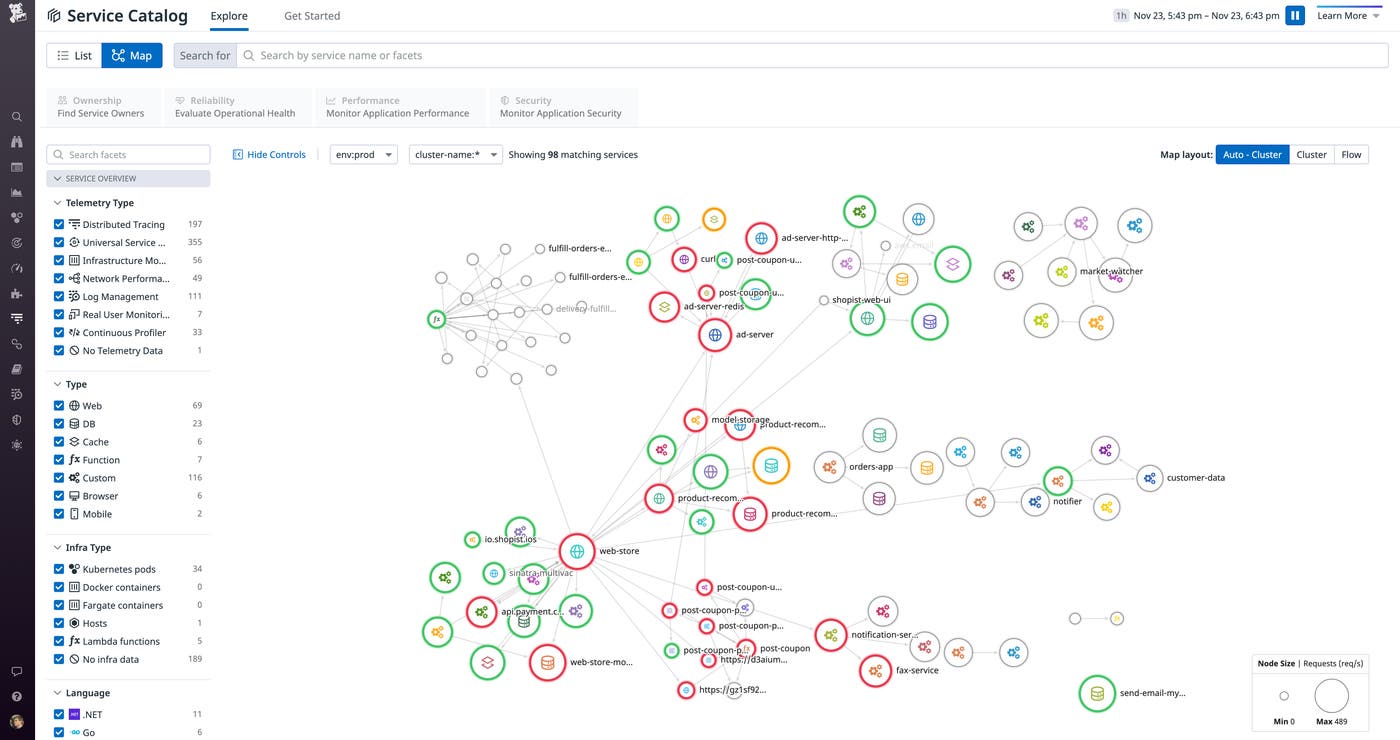
Universal Service Monitoring (USM) is Datadog’s capability for discovering and mapping services without code changes. It uses eBPF to detect the services running across infrastructure and the dependencies between them, then surfaces them in views such as the Service Map and Software Catalog.
USM relies on a configured Datadog Agent and unified service tagging rather than instrumentation libraries, which extends coverage to services that cannot be instrumented because their source code is unavailable or they are built by third parties.
Key features include:
- Code-free service discovery: All services are discovered automatically, whether first-party or third-party, without touching application code.
- eBPF-based dependency mapping: Relationships between services are derived using eBPF, producing a real-time view of system architecture.
- Broad runtime coverage: Visibility spans the runtimes, programming languages, and frameworks in use rather than being limited to instrumented services.
- Service health signals: Real-time request, error, and duration metrics are captured for every service and deployment and correlated with related telemetry.
- Centralized service knowledge: Discovered services populate the Software Catalog and are enriched with owners, runbooks, source code links, and on-call contact information.
- SLOs and out-of-the-box alerting: Consistent service level objectives can be rolled out across dependent services, with standard visualizations and alerting on all services.
- Extension into root cause analysis: Services can be extended with end-to-end distributed traces, always-on code profiling, and query-level database monitoring through the APM suite.
Limitations (as reported by users on PeerSpot):
- Cost control: Reviewers report that costs escalate quickly at scale and ask for harder spending limits and clearer consumption visibility.
- Pricing model complexity: The licensing structure is described as complex and confusing, leading to unexpected charges.
- Alert noise: The platform generates many alerts that are not actionable without tuning, particularly in dynamic environments.
- Agent management: Installing and managing agents across non-containerized hosts and varied database servers is reported as difficult.
- Interface and query performance: Users cite slower query response on large datasets and an interface that can feel overwhelming to new team members.
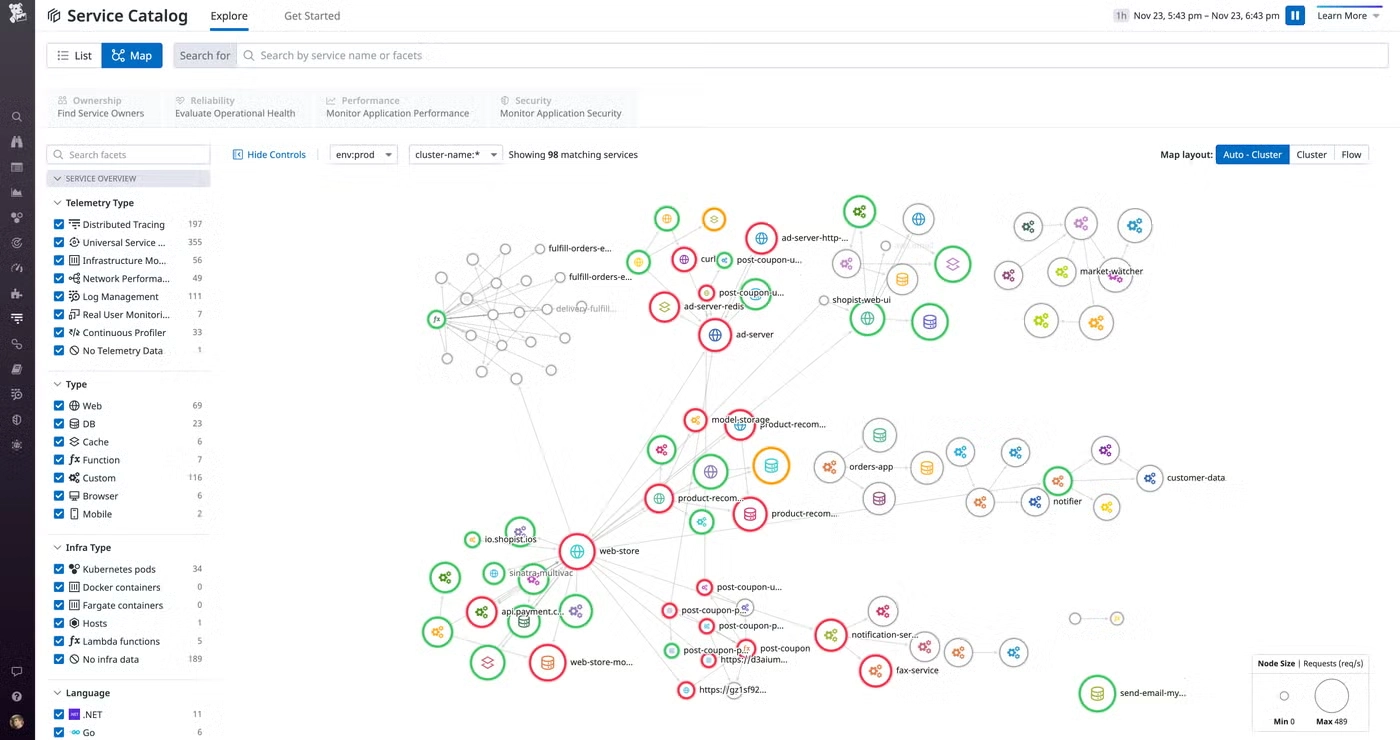
Source: Datadog
7. SolarWinds Server & Application Monitor

Best for: Connection-level dependency maps tied to server monitoring
Strengths: Dependency polling plus connection quality polling
Things to consider: Console can be slow; reporting and upgrades draw complaints
SolarWinds Server & Application Monitor (SAM) adds dependency mapping to server and application monitoring. It polls dependencies and creates maps of the incoming network connections for a managed server or application, showing the incoming port, service, and server behind each connection.
Because dependency data sits inside a monitoring product, connection information is presented alongside server health, resource utilization, and uptime data for the same systems.
Key features include:
- Application dependency polling: SAM maps interactions between applications and the servers they rely on, covering application to application, application to node, and node to application connections.
- Connection quality polling: A second polling method tracks TCP data travelling from client nodes to target nodes and acts as a packet sniffer, allowing maps to distinguish latency from packet loss.
- Custom interactive maps: Maps can be created and configured for applications and their supporting servers, including custom maps of groups or entities used to track response times of dependent services.
- Connection details page: A dedicated view shows application processes, process status, latency, packet loss, and port data for each monitored connection.
- Thresholds and alerting on dependencies: Custom warning and critical thresholds can be set for network latency, packet loss, uptime, and TCP connection problems on dependent services.
- Inbound connection visibility: Server activity views show which inbound connections are linked to a given application or server and their internal resource consumption.
- Underlying server monitoring: Dependency maps sit alongside monitoring of server uptime, hardware failure detection, and resource utilization for the same infrastructure.
Limitations (as reported by users on PeerSpot):
- Web console performance: The console is reported as slow and prone to hanging or crashing, with sluggishness worsening at larger scale.
- Reporting: Reviewers describe reporting as difficult to work with following the removal of the backend report writer, and ask for simpler, more dynamic reports and Excel export.
- Setup and upgrades: Setup can be complex enough to need local support, and upgrades are described as lengthy.
- Application monitoring depth: End-to-end application performance monitoring is not possible, and monitoring inside non-Windows applications such as Apache is more involved.
- Licensing administration: Synchronizing licensing periods across different modules is cited as an area needing improvement.
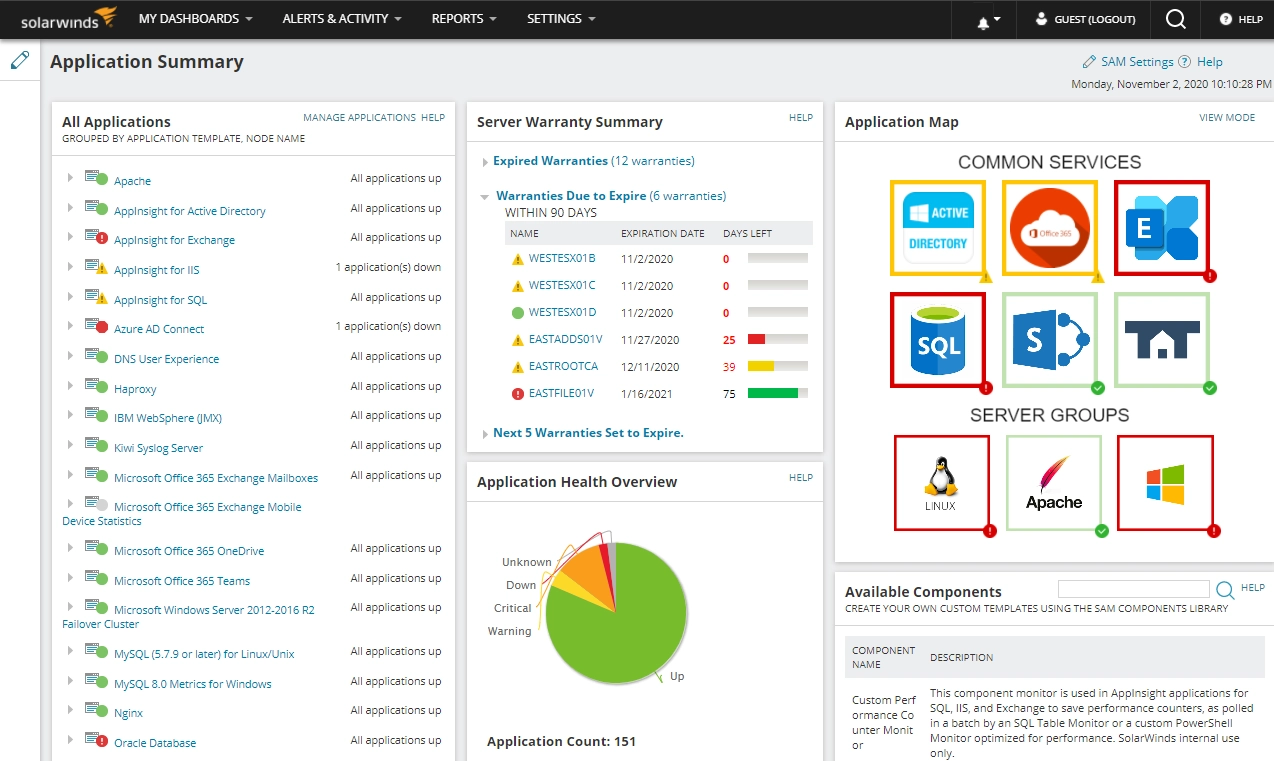
Source: SolarWinds

8. ManageEngine Applications Manager

Best for: Scheduled discovery and dependency maps with CMDB sync
Strengths: IP-range discovery, dependency maps, and business service views
Things to consider: Scale and integrations limit use in complex estates
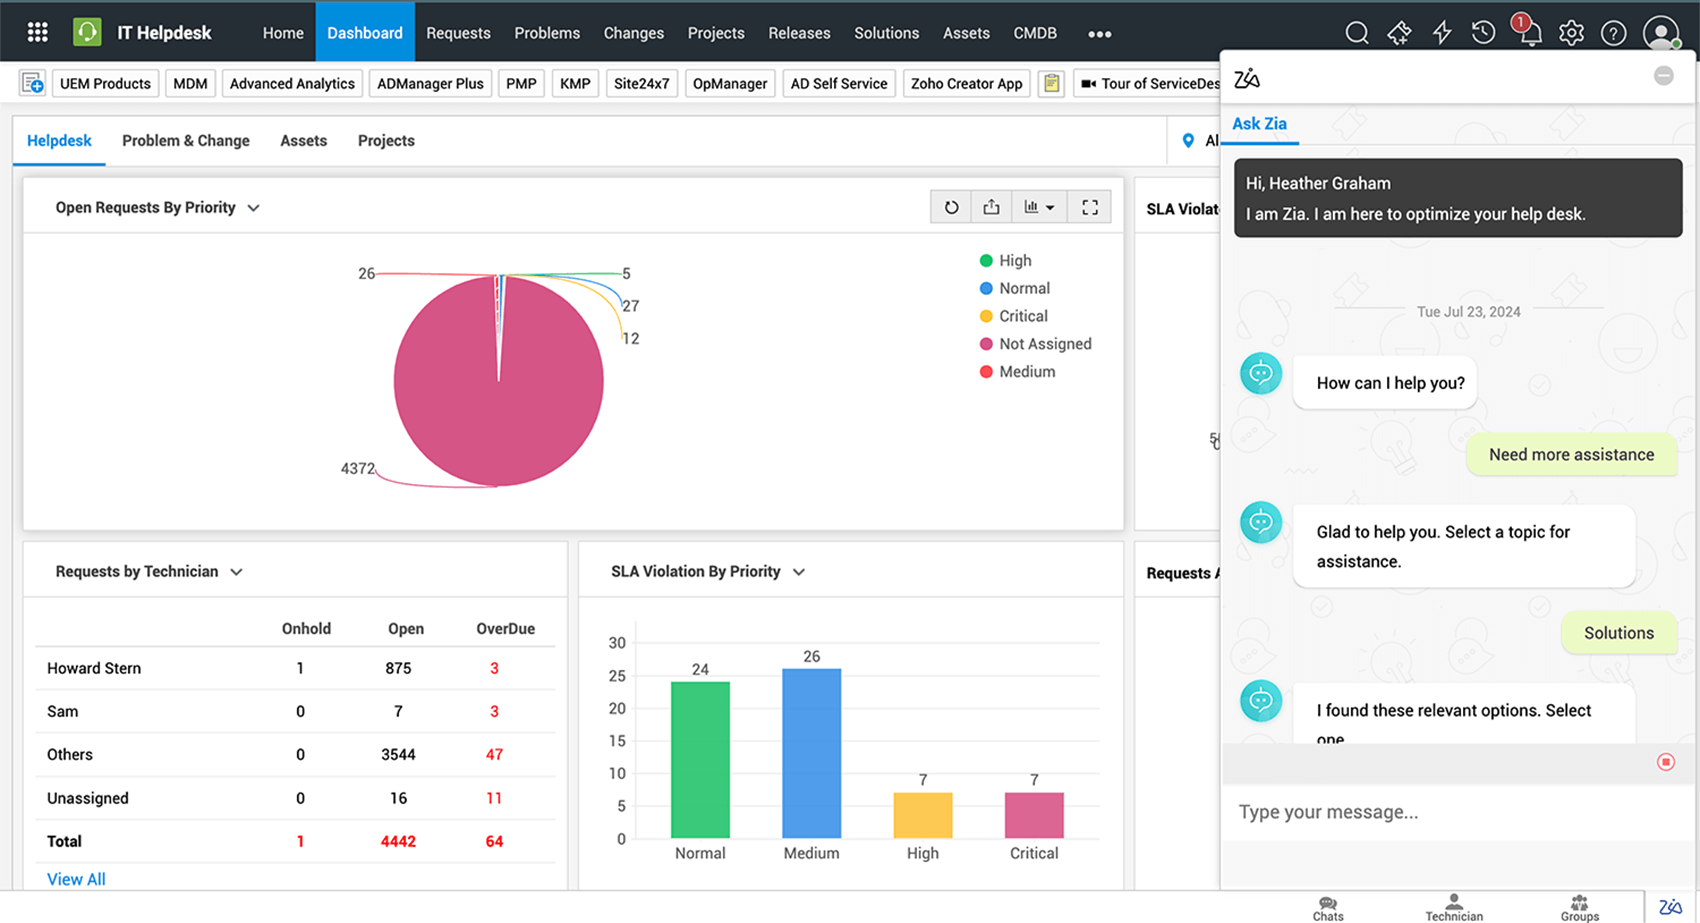
ManageEngine Applications Manager includes an Application Discovery and Dependency Mapping (ADDM) feature that discovers applications, servers, and databases across an IT environment and maps the relationships between them.
Discovery runs against pre-defined IP ranges, with administrators selecting which resource types to include in each scan. Once discovery completes, maps are built from the discovered inventory, and the resulting components and dependencies can be pushed into a CMDB as configuration items.
Key features include:
- IP-range based discovery: Discovery is configured against pre-defined IP ranges within the network, and administrators select the resource types to include before each scheduled scan.
- Scheduled re-discovery: Periodic re-discoveries scan the network automatically so new resources are picked up without manual runs, with scan summary reports showing status, devices pinged, and applications discovered.
- Dependency map view: Maps are created by selecting the desired servers, after which the software retrieves the associated resources and draws the relationships between servers and applications.
- Automatic map maintenance: Applications discovered on mapped devices at a later point are added to the existing map automatically, and node positioning adjusts to prevent overlap while remaining manually movable.
- Business service map view: A separate flow chart view breaks down the resources within each monitor group, showing connections between applications, web services, and URLs and their relationship to the wider infrastructure.
- Map administration: A dashboard panel lists all existing dependency maps, with individual resource information available and options to edit or remove each map.
- CMDB integration: Discovered components and their dependencies can be placed in the ServiceDesk Plus CMDB as configuration items, with the CMDB updated automatically by the ADDM module.
Limitations (as reported by users on PeerSpot):
- Scalability: Reviewers report limitations in large or complex environments and ask for improved scalability.
- Third-party integrations: The integration process with external tools poses challenges, and users ask for more robust connections.
- Agent stability: The agent is reported to crash under heavy load or during sudden surges of data.
- Reporting and interface: Users ask for more flexible reporting, clearer dashboards, and a rearranged interface that is easier for new administrators to configure.
- Analytics depth: Data post-processing is described as less powerful than in some competing APM tools, and AI-driven behavior is configured manually rather than automatically.
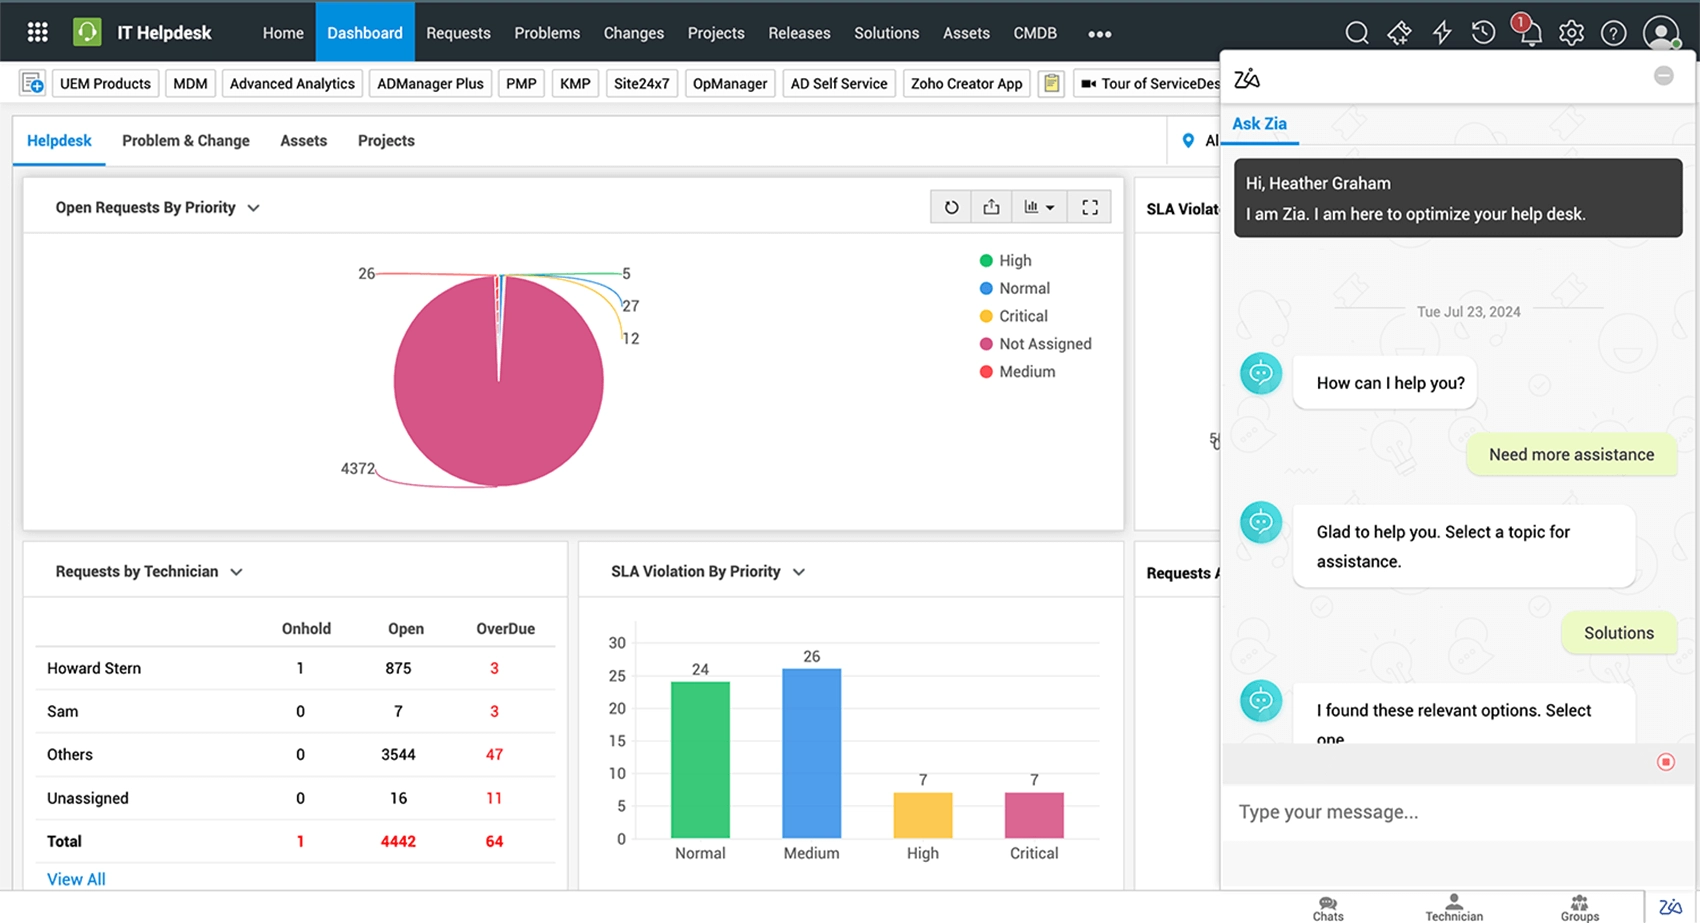
Source: ManageEngine
Conclusion
Application dependency mapping is essential for understanding how services, infrastructure, databases, networks, and cloud resources interact across hybrid environments. Effective mapping reduces blind spots, improves incident troubleshooting, supports safer changes and migrations, and makes impact analysis more reliable. The most useful approach is one that keeps dependency data current, covers both on-premises and cloud resources, and provides enough service-level context for operations teams to act on what the maps reveal.