TL;DR: Nagios alternatives replace manual, plugin-driven checks with automated discovery, dependency mapping, and modern dashboards. Best for agentless dependency mapping: Faddom. Best open-source replacement: Zabbix. Best managed SaaS observability: Datadog.
What Is Nagios and Why Do Organizations Seek Alternatives?
Nagios is an open-source monitoring system used to track the health and availability of servers, networks, applications, and services. It can monitor metrics such as cpu usage, disk space, network connectivity, and service status. When a check detects a problem, Nagios can send alerts so administrators can investigate the issue.
Nagios uses plugins to perform monitoring checks against hosts and services. Administrators define what to monitor, how often checks should run, and when alerts should be triggered. Its web interface provides current status information, alert history, and reports that help teams identify failures and monitor infrastructure availability.
Organizations often seek Nagios alternatives when monitoring requirements outgrow its configuration-heavy approach. Maintaining host definitions, plugins, custom checks, and distributed deployments can require significant manual work as environments scale. Dynamic cloud and container infrastructure also creates demand for automated discovery, dependency mapping, and broader observability across metrics, logs, and traces. Modern alternatives can reduce administration while providing more current views of infrastructure relationships and application impact.
This is part of a series of articles about Nagios monitoring
Nagios Alternatives at a Glance
The table below summarizes the main differences between the platforms covered in this guide, including what each one is built around and where users report friction. Each solution is explored in more detail in the sections that follow.
| Category | Solution | Best For | Key Strengths | Things to Consider |
| Discovery and Dependency Mapping | Faddom | Agentless mapping of hybrid application dependencies | Passive discovery, live maps, change tracking, fast setup | Depth for niche and cloud-native resources |
| Discovery and Dependency Mapping | Device42 | Full-stack discovery feeding a continuously updated CMDB | Broad discovery, ADM, IPAM, storage and license tracking | Interface complexity and add-on pricing |
| Discovery and Dependency Mapping | ScienceLogic AI Platform | Service-centric observability with automated remediation | Real-time discovery, relationship mapping, workflow automation | Alert tuning and customization effort |
| Open Source Monitoring | Zabbix | Free all-in-one monitoring of networks, servers and apps | Agent and agentless collection, templates, proxies, SLA | Steep learning curve, dated interface |
| Open Source Monitoring | Checkmk | Check-based monitoring with heavy automation | Auto-discovery, 2,000+ integrations, distributed sites | Complex configuration, alert handling |
| Open Source Monitoring | Icinga | Nagios-compatible monitoring with a modern API | Plugin compatibility, clustering, REST API, Director | Complex install, limited native dashboards |
| Open Source Monitoring | Prometheus | Metrics and alerting for cloud-native environments | Service discovery, PromQL, exporters, Alertmanager | Metrics only, limited local retention |
| Commercial Infrastructure and Network | Paessler PRTG | Sensor-based monitoring of networks, servers and OT | Easy setup, maps and dashboards, SNMP and flow support | Sensor licensing cost, UI at scale |
| Commercial Infrastructure and Network | SolarWinds Observability Self-Hosted | Self-hosted hybrid monitoring across networks and apps | Unified stack view, intelligent maps, anomaly alerting | Setup complexity, reporting limitations |
| Commercial Infrastructure and Network | ManageEngine OpManager | Fault and performance monitoring for network devices | Layer 2 maps, WAN and wireless monitoring, distributed probes | Confusing licensing, alert noise |
| Commercial Infrastructure and Network | Auvik | Automated network mapping and traffic visibility | Live topology, config backup, 64+ preset alerts | No SNMP traps, limited reporting |
| SaaS Observability | Datadog | Managed monitoring across cloud, hybrid and on-prem | 900+ integrations, tag-based analytics, AIOps correlation | Cost control, alert tuning |
| SaaS Observability | Dynatrace | Automatic topology and AI-driven root cause analysis | Smartscape mapping, Davis AI, Grail, AutomationEngine | Pricing model, configuration effort |
| SaaS Observability | New Relic | Correlating host health with application performance | Change tracking, automap, 780+ integrations, inventory | Cost at volume, data retention limits |
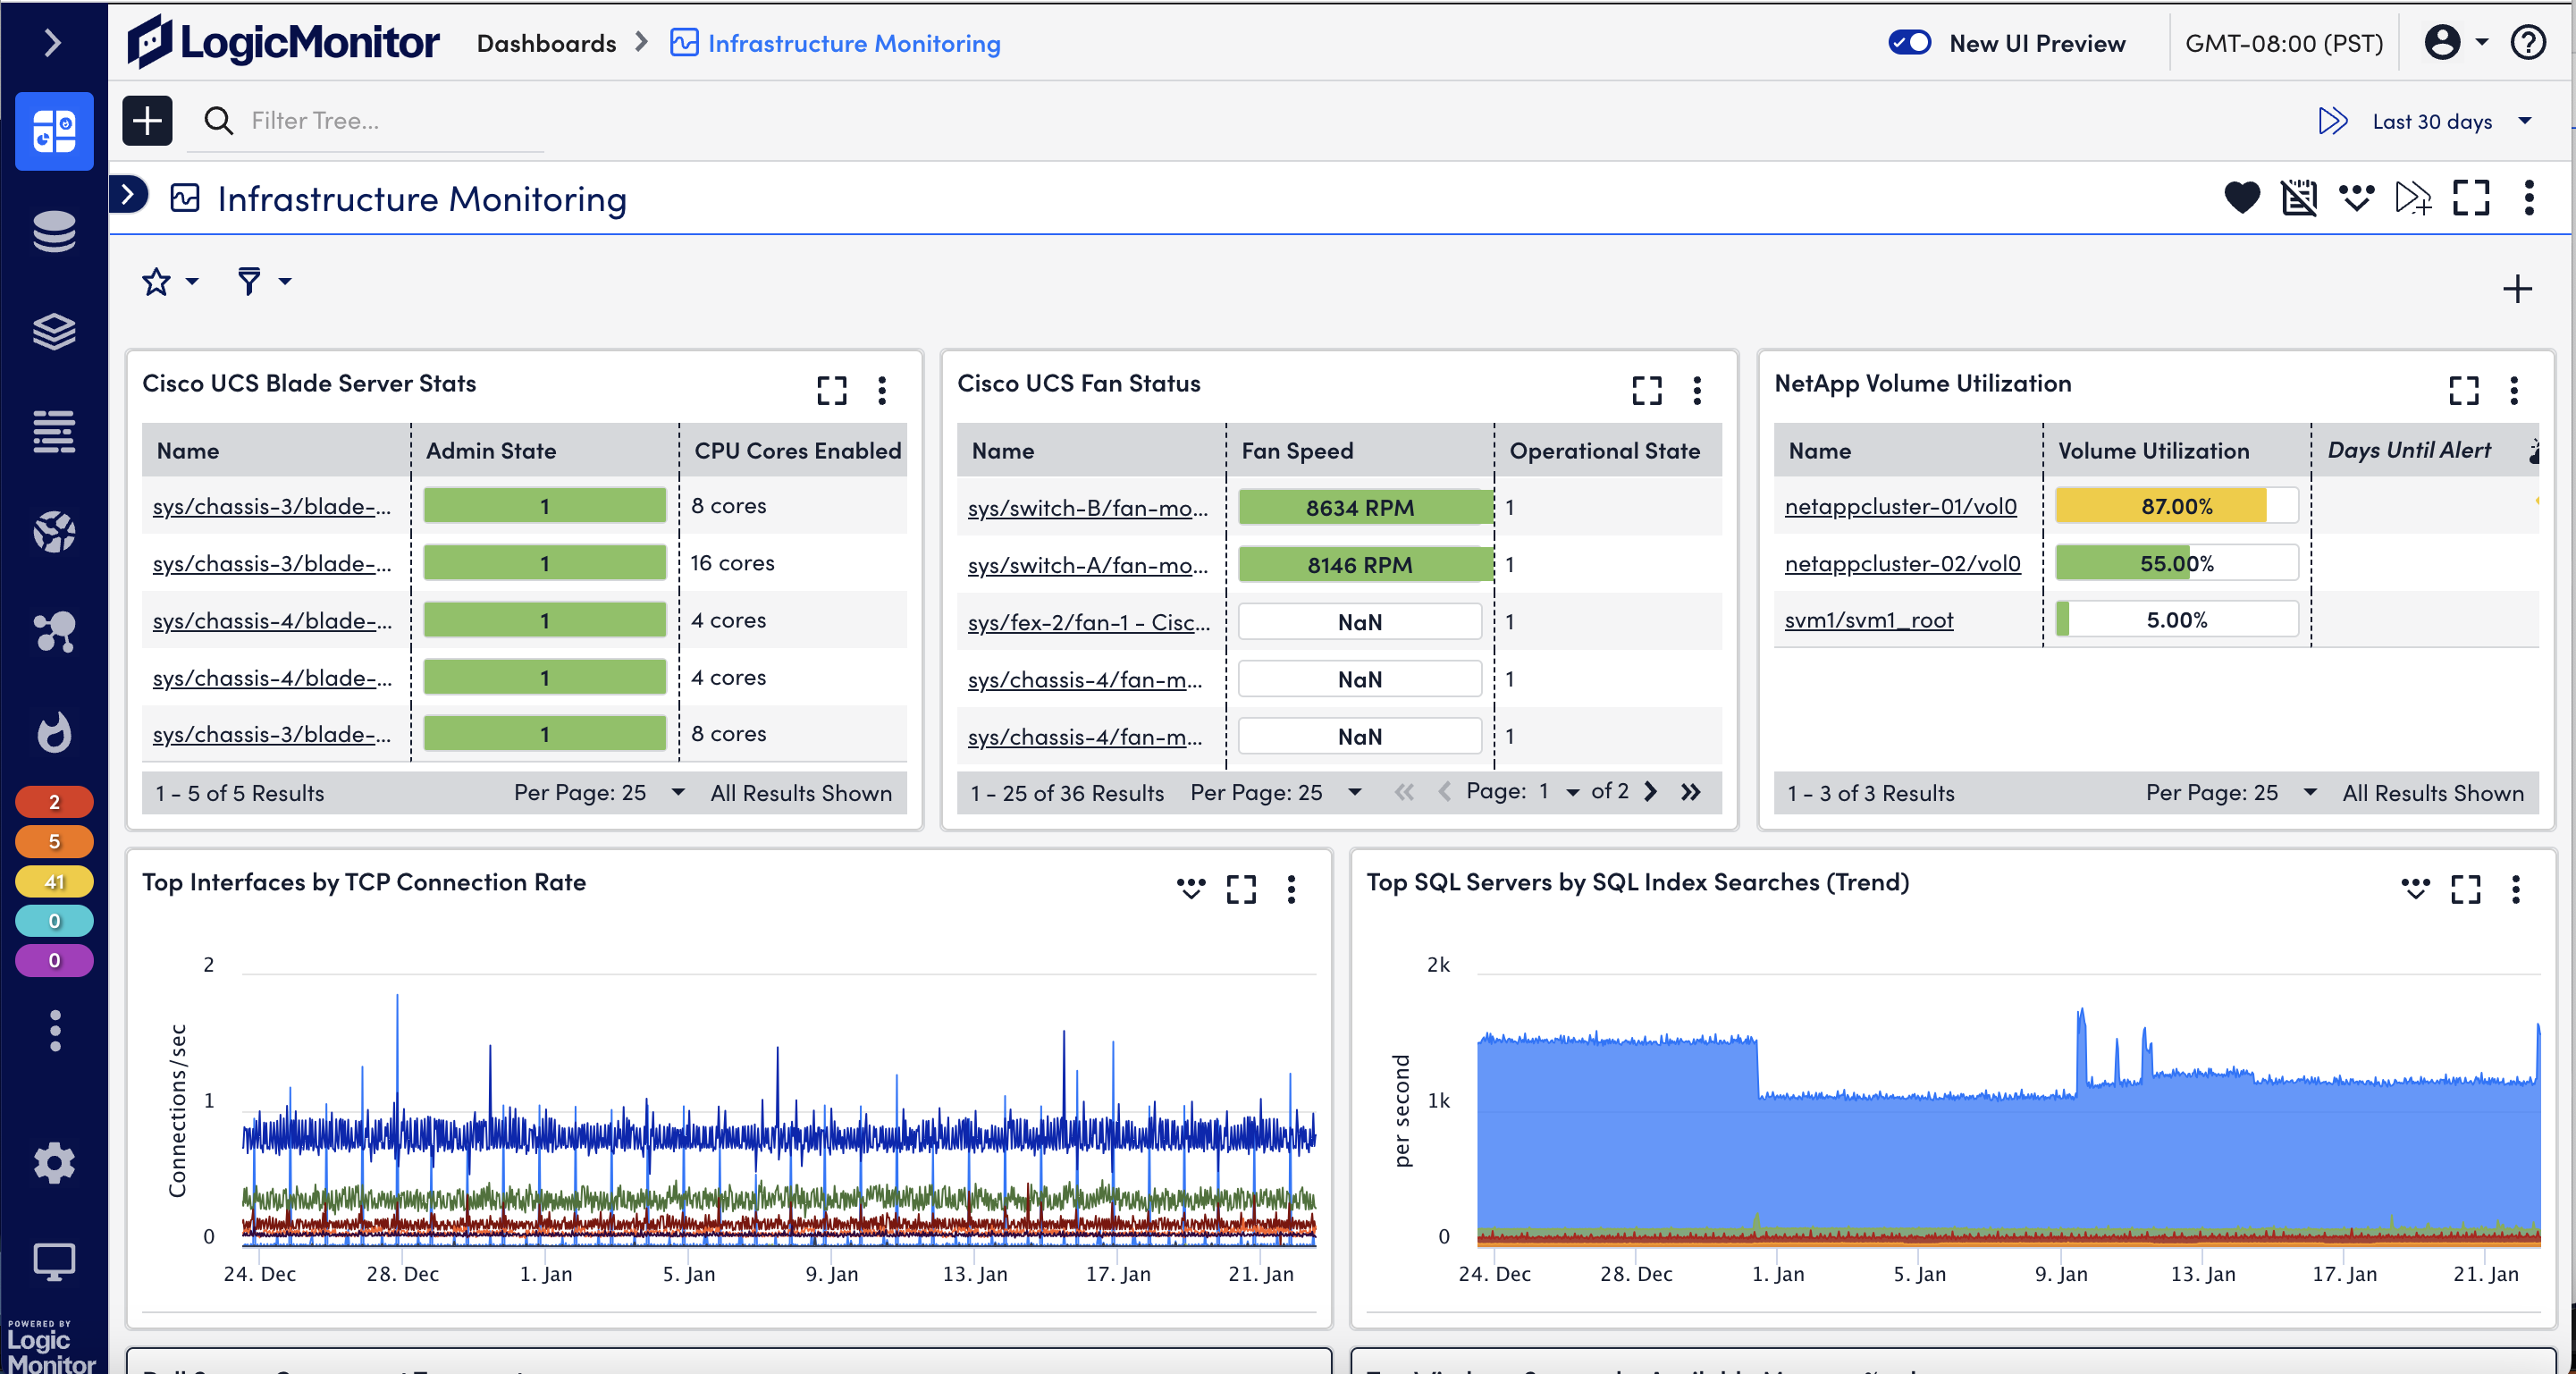
| SaaS Observability | LogicMonitor Envision | Agentless hybrid monitoring with topology awareness | Agentless collectors, 3,000+ integrations, anomaly detection | Alert sensitivity, module-based pricing |
Why Consider a Nagios Alternative?
Complex Configuration and Administration
Nagios relies heavily on configuration files to define hosts, services, checks, contacts, and notification rules. In larger environments, these files can become difficult to organize and maintain. Small configuration errors may also prevent checks from working as expected.
Administration often requires knowledge of Nagios-specific configuration syntax and deployment practices. Teams may need additional scripts or configuration management tools to keep settings consistent across many monitored systems. Alternatives with centralized configuration and simpler management can reduce this operational work.
Limited Native Automation and Auto-Discovery
Nagios does not provide the same level of built-in auto-discovery found in many newer monitoring platforms. Administrators often need to define monitored hosts and services manually or use external tools and scripts to automate the process.
This approach becomes less practical in environments where resources are created and removed frequently. Containers, virtual machines, and cloud instances may exist only for short periods. Monitoring tools with dynamic discovery can detect these resources and apply monitoring rules automatically.
Outdated or Less Intuitive User Experience
The Nagios interface focuses primarily on host status, service status, alerts, and availability information. While this is sufficient for many operational tasks, navigating and analyzing large amounts of monitoring data can be less convenient than with modern dashboard-driven platforms.
Newer monitoring tools often provide interactive dashboards, flexible filtering, visualization, and easier configuration workflows. These features can help teams investigate incidents faster and give different users views tailored to applications, infrastructure, or business services.
Scaling Challenges in Large Environments
As the number of hosts and service checks increases, a single Nagios deployment can encounter performance and management constraints. Large environments may require distributed monitoring, multiple Nagios instances, or additional components to spread check execution and data processing.
Scaling also increases configuration and maintenance overhead. Teams must coordinate monitoring nodes, configuration changes, plugins, and alerting behavior across the environment. Platforms designed around distributed or horizontally scalable architectures can simplify monitoring at higher volumes.
Dependence on Plugins and Custom Configuration
Nagios uses plugins to perform most monitoring checks, which makes the system flexible but also creates additional dependencies. Organizations may rely on community plugins, third-party integrations, or custom scripts for technologies that are not covered by their existing checks.
These components must be installed, configured, updated, and tested over time. Custom plugins can also require maintenance when monitored applications or APIs change. Alternatives with broader built-in integrations can reduce the amount of custom monitoring code a team needs to manage.
Limited Cloud-Native and Observability Capabilities
Nagios was designed primarily around host and service monitoring rather than modern cloud-native observability. Monitoring Kubernetes clusters, containers, serverless services, and frequently changing cloud resources can require additional plugins, integrations, and custom configuration.
Nagios also does not provide a unified native platform for metrics, logs, and distributed traces. Teams that need to troubleshoot distributed applications may therefore combine it with other tools. Modern observability platforms can correlate these data types in one system, making it easier to trace problems across infrastructure and application components.
What to Look for in a Nagios Alternative
Automated Infrastructure Discovery
Automated discovery identifies devices, servers, virtual machines, applications, and other resources without requiring administrators to define every component manually. Discovery can use network scans, cloud APIs, agents, or existing management interfaces to build an inventory.
Look for a platform that periodically repeats discovery rather than treating it as a one-time process. Continuous discovery helps monitoring coverage remain accurate when resources are added, removed, moved, or reconfigured.
Application Dependency Mapping
Application dependency mapping shows the connections between applications and the infrastructure or services they depend on. A map might connect an application to web servers, databases, message queues, APIs, and network components.
These relationships provide context that individual Nagios checks cannot easily show. During an incident, teams can identify upstream and downstream dependencies and determine which applications could be affected by a failed component.
Real-Time Network and Traffic Visibility
A monitoring platform should provide visibility into network health and traffic behavior, including bandwidth utilization, connections, latency, packet loss, and traffic flows. Support for technologies such as snmp and flow data can extend visibility across network devices.
Real-time data helps teams distinguish application problems from network problems. It can also reveal congestion, unusual traffic patterns, overloaded links, and communication paths that may not be documented elsewhere.
Agentless Monitoring and Discovery
Agentless monitoring collects information without installing software on every monitored system. Depending on the environment, a platform may use snmp, ssh, wmi, APIs, hypervisor interfaces, or cloud provider APIs to retrieve data.
This approach can simplify deployment when installing and maintaining agents is impractical. Evaluate which protocols the platform supports, what data it can collect agentlessly, and whether credentials can be managed securely at scale.
Continuous Environment Mapping
Continuous mapping maintains an updated model of infrastructure components and their relationships. Instead of relying on static diagrams, the platform updates its topology as it discovers new resources, connections, and configuration changes.
This capability is particularly useful in dynamic environments where manual documentation quickly becomes outdated. Current maps give operations teams a shared view of the environment for troubleshooting, planning, and auditing.
Related content: Read our guide to IT infrastructure mapping
Hybrid and Multi-Cloud Visibility
Many organizations operate resources across on-premises infrastructure and one or more cloud providers. A Nagios alternative should provide a consistent view across these environments instead of requiring separate monitoring workflows for each platform.
Look for native integrations with the cloud and virtualization platforms you use. The tool should discover resources, collect relevant metrics and metadata, and preserve relationships between cloud services and on-premises systems.
Application and Server Relationship Mapping
Server relationship mapping identifies which applications and services run on particular servers and how those servers communicate. This provides more context than monitoring cpu, memory, disk, and availability as isolated metrics.
Accurate relationships help teams understand what a server supports before maintenance or configuration changes. They also make it easier to determine which applications may be affected when a physical server, virtual machine, or operating system has a problem.
Change Detection and Historical Comparison
Change detection records modifications to infrastructure, configurations, relationships, or discovered resources. Historical comparison then allows teams to examine how the environment differed before and after a specific time or event.
This information can shorten troubleshooting when an incident follows a deployment or infrastructure change. Teams can compare known-good and current states to identify new dependencies, removed resources, or configuration changes that correlate with the problem.
Root Cause and Impact Analysis
Root cause analysis should correlate alerts with topology and dependency information instead of presenting every symptom as an independent problem. For example, one failed network device could trigger alerts from many applications and servers that depend on it.
Impact analysis addresses the opposite question by showing what depends on a failed or changing component. Together, these capabilities help teams prioritize incidents, reduce duplicate alerts, and focus investigation on components most likely to explain the wider failure.
Migration and Modernization Support
Monitoring data can support migrations by documenting existing infrastructure, dependencies, communication paths, and resource usage. This information helps teams identify which systems should move together and which hidden dependencies could cause problems during migration.
For modernization projects, look for tools that continue mapping workloads across physical, virtual, containerized, and cloud environments. Maintaining visibility before, during, and after a migration makes it easier to validate changes and identify missing or broken dependencies.
Notable Nagios Alternatives and Their Pros and Cons
How we selected these tools: We shortlisted Nagios alternatives based on automated infrastructure discovery, application and dependency mapping, agentless data collection, hybrid and multi-cloud coverage, alerting and root cause analysis, and the ability to scale across large environments.
Discovery and Dependency Mapping Platforms
1. Faddom

Best for: Agentless mapping of hybrid application dependencies
Strengths: Passive discovery, live maps, change tracking, fast setup
Things to consider: Depth for niche and cloud-native resources
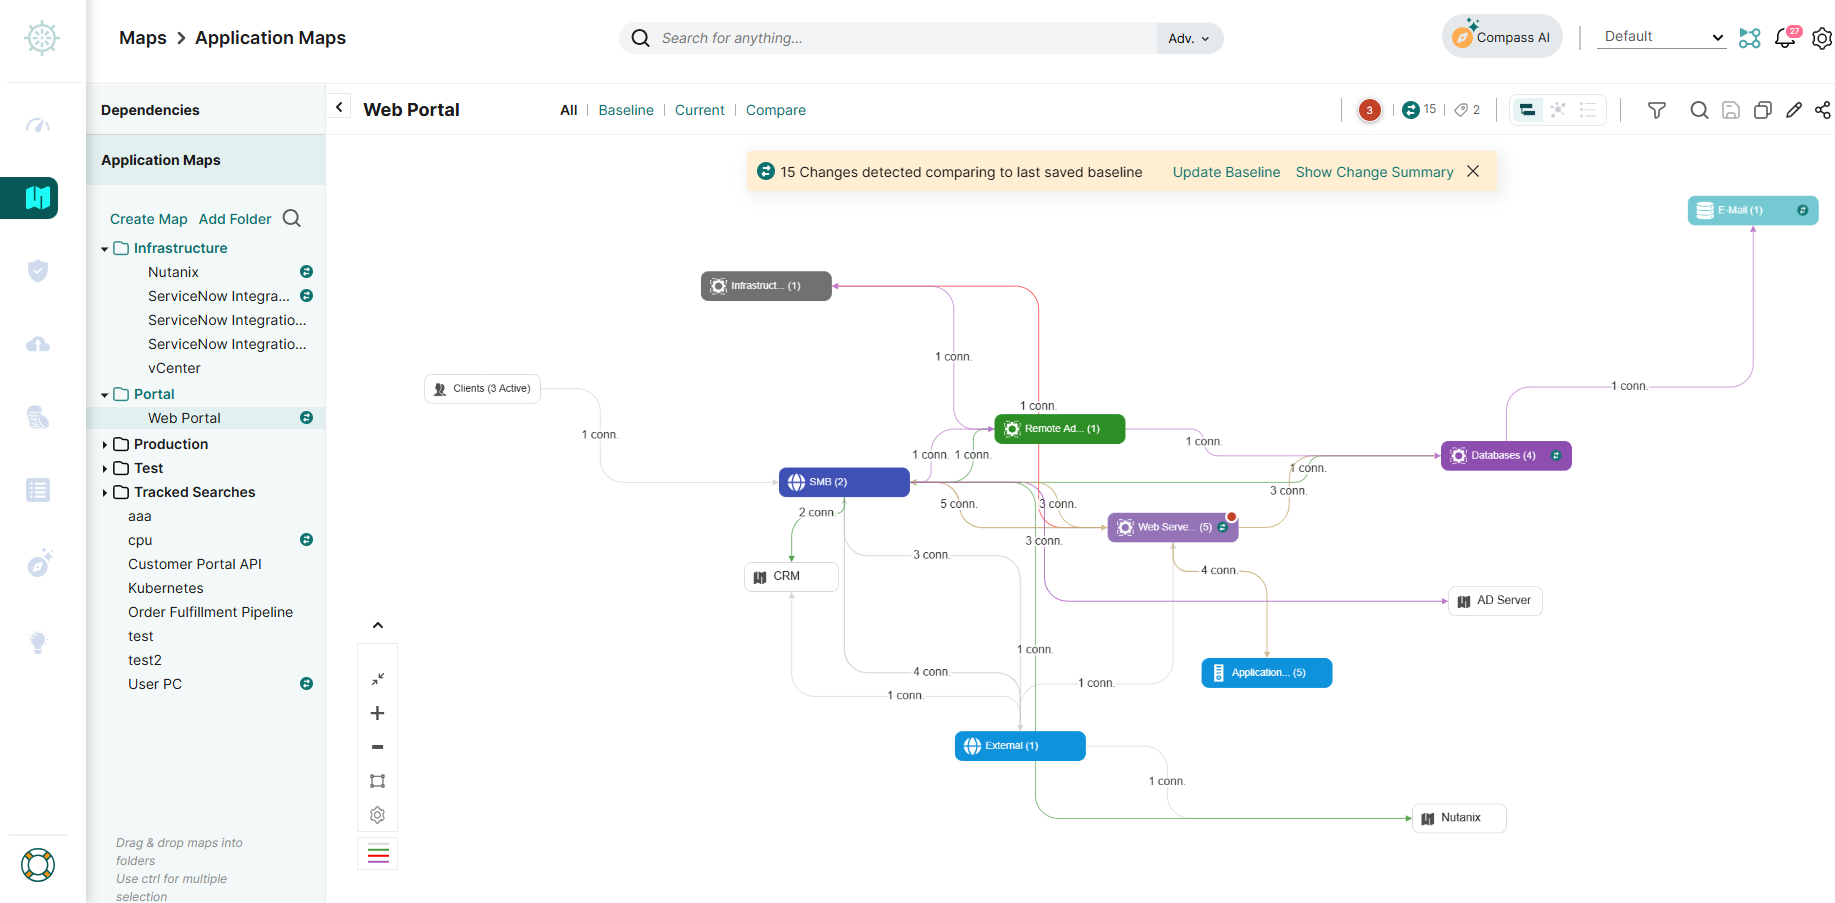
Faddom is an application dependency mapping platform that visualizes on-premises and cloud infrastructure in real time, with servers grouped automatically into business applications. It applies AI-driven correlation to turn raw network data into application and dependency maps.
Deployment is passive and agentless. It requires no agents, no server credentials and no firewall changes, and it can run offline so data stays inside the environment. First maps appear within about an hour of deployment and update continuously, which covers the discovery and mapping gaps that Nagios leaves to manual configuration.
Faddom can also integrate directly with Nagios Core and Nagios XI, sending selected host and service notifications from Nagios into Faddom so they appear alongside its topology data. Teams can configure which monitored hosts and services forward events, including host down or unreachable states and service warning, critical, unknown, and recovery events. This lets organizations retain Nagios for infrastructure monitoring while using Faddom’s dependency maps to add application and topology context to those events.
Key features include:
- Agentless passive collection: Works from a copy of network traffic rather than agents or credentials, so monitored servers are not modified and no inbound firewall rules are opened.
- Automatic application grouping: Discovered servers are grouped into business applications, so teams see application boundaries rather than isolated host checks.
- Hybrid and multi-source mapping: Connects on-premises environments and cloud accounts and maps the resulting hybrid business applications from a single interface.
- Real-time change tracking: Logs infrastructure and application-level changes as they happen, supporting impact analysis before a change is made.
- Migration and modernization support: Dependency data feeds wave-based migration planning, including data center moves and cloud migration projects.
- Security and compliance use cases: Traffic and dependency data is used for internal attack surface visibility, IT audit, and asset documentation.
Limitations (as reported by users on G2):
- Coverage of non-standard systems: Reviewers note occasional visibility gaps for non-standard or cloud-native resources, which can require manual adjustment.
- Traffic inspection depth: Some reviewers would like deeper packet-level inspection, though they acknowledge it sits outside the product’s scope.
- Licensing as environments grow: A few reviewers from smaller organizations mention that licensing becomes more complex as server counts increase.
2. Device42, a Freshworks Company

Best for: Full-stack discovery feeding a continuously updated CMDB
Strengths: Broad discovery, ADM, IPAM, storage and license tracking
Things to consider: Interface complexity and add-on pricing
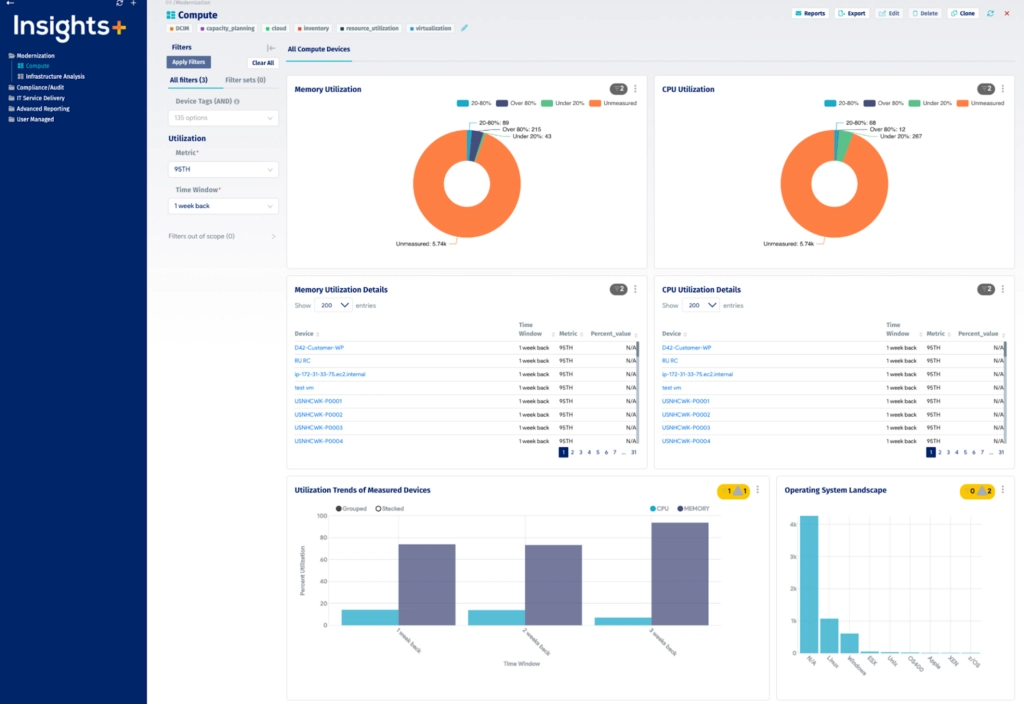
Device42 is an agentless discovery and dependency mapping platform for hybrid IT, covering everything from legacy technologies such as mainframes to cloud containers. It continuously discovers and maps infrastructure and applications across data centers and cloud environments.
The platform groups workloads by application affinity and maintains a near real-time CMDB that records how assets connect and depend on each other. Alongside discovery it bundles IP address management, storage discovery, certificate management, and software license tracking, which consolidates functions that a Nagios deployment would typically require separate tools to cover.
Key features include:
- Hybrid infrastructure and IaaS discovery: Discovers physical servers, virtual machines, network devices, containers and cloud assets across AWS and Azure without installing agents.
- Application dependency mapping: Native ADM builds affinity groups and automatic move groups that show which components belong to the same application.
- Continuously updated CMDB: Maintains reconciled configuration item data with detailed interdependency mapping as a single source of truth.
- Storage and IPAM modules: Includes storage resource discovery and integrated IP address management for centralized network visibility.
- SSL certificate and software license management: Discovers certificates and compares discovered license counts against purchased counts.
- Integrations and API: Offers 30+ integrations including ServiceNow, Jira, Splunk, Ansible and Puppet, plus a REST API for extracting or injecting data.
Limitations (as reported by users on G2):
- Setup and navigation: Reviewers describe the interface and initial configuration as complex, particularly for smaller teams.
- Performance with large data sets: Several reviewers report slowdowns when handling very large data volumes or many concurrent API requests.
- Add-on pricing: Some reviewers note that certain capabilities are priced separately rather than included in a single product price.
- Reporting and documentation: Reviewers mention that reporting options and documentation structure could be more intuitive.
Source: Device42
3. ScienceLogic AI Platform

Best for: Service-centric observability with automated remediation
Strengths: Real-time discovery, relationship mapping, workflow automation
Things to consider: Alert tuning and customization effort
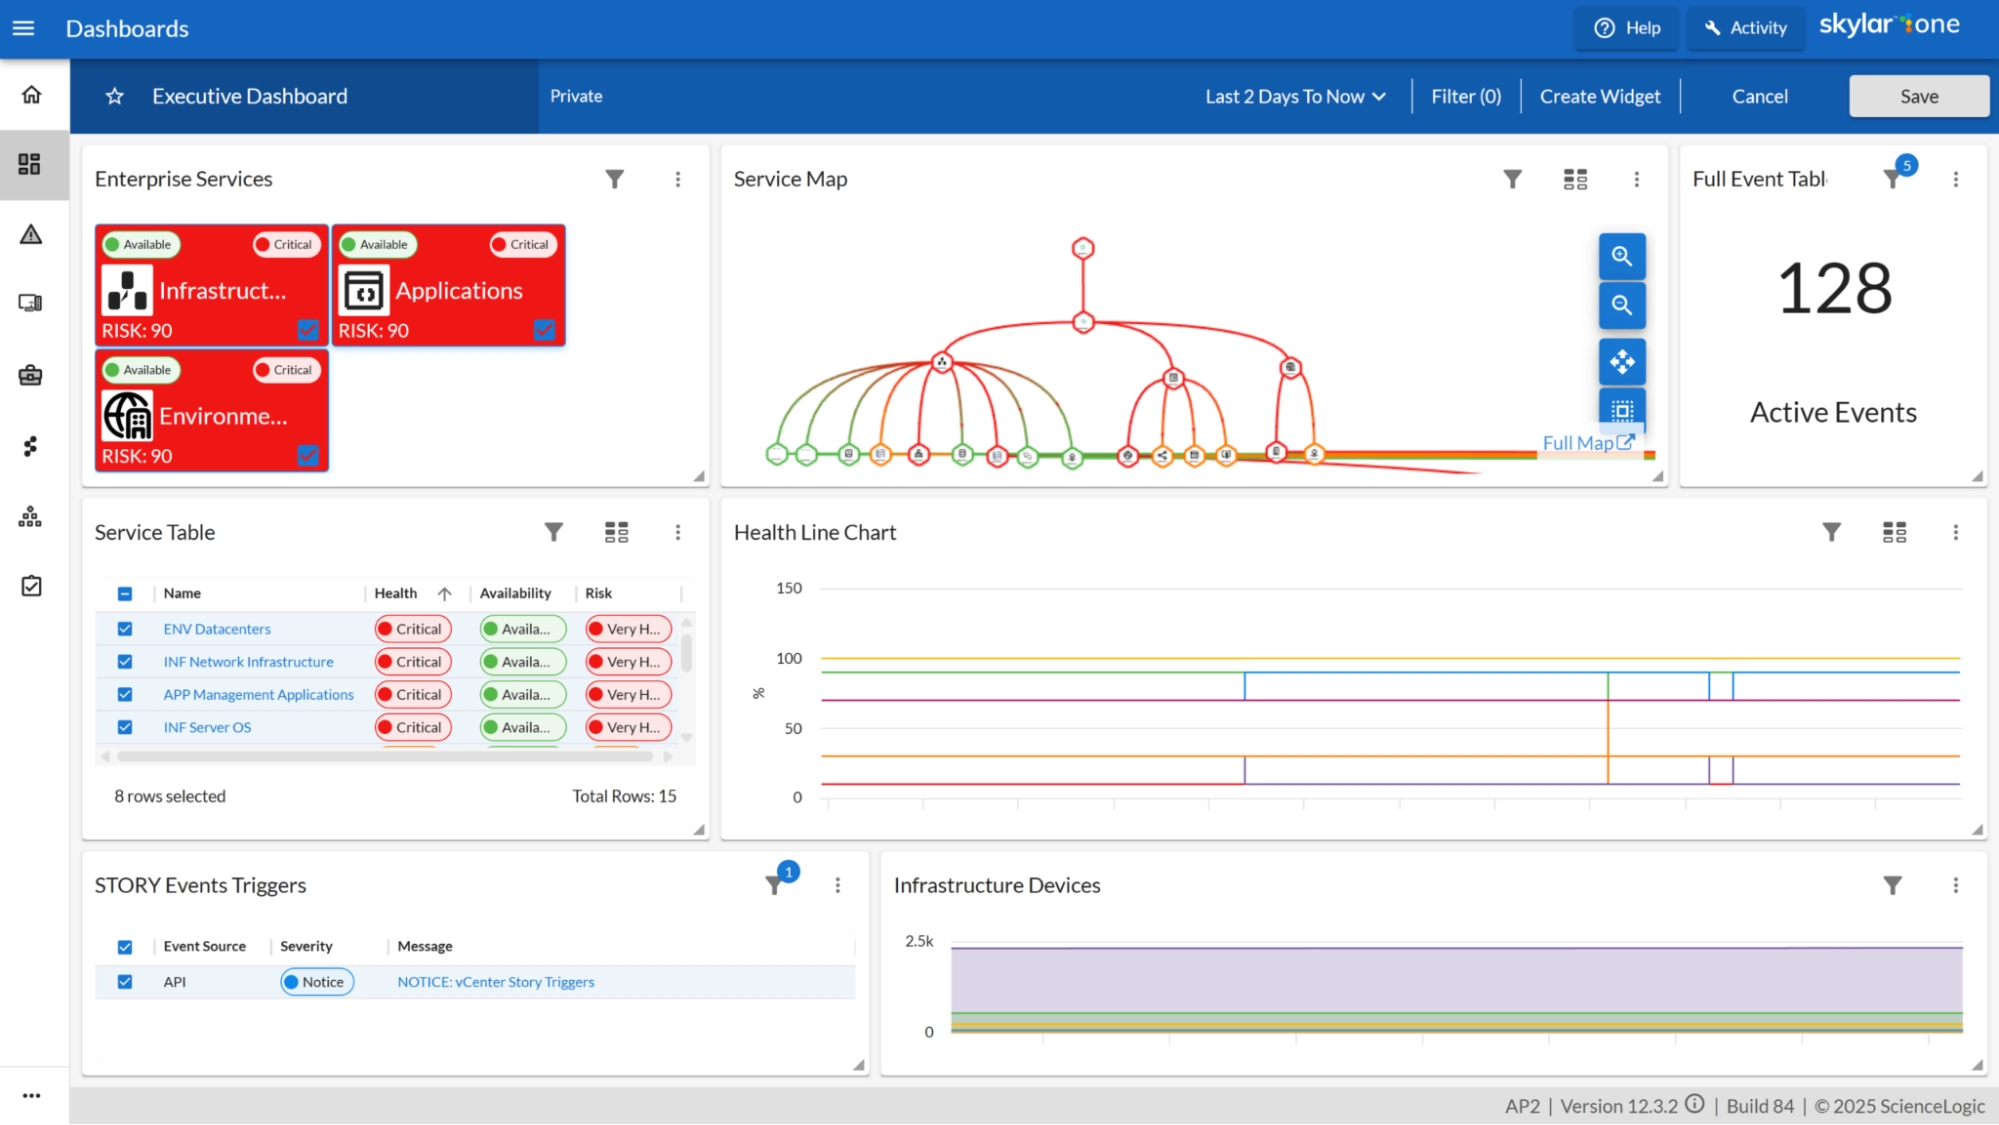
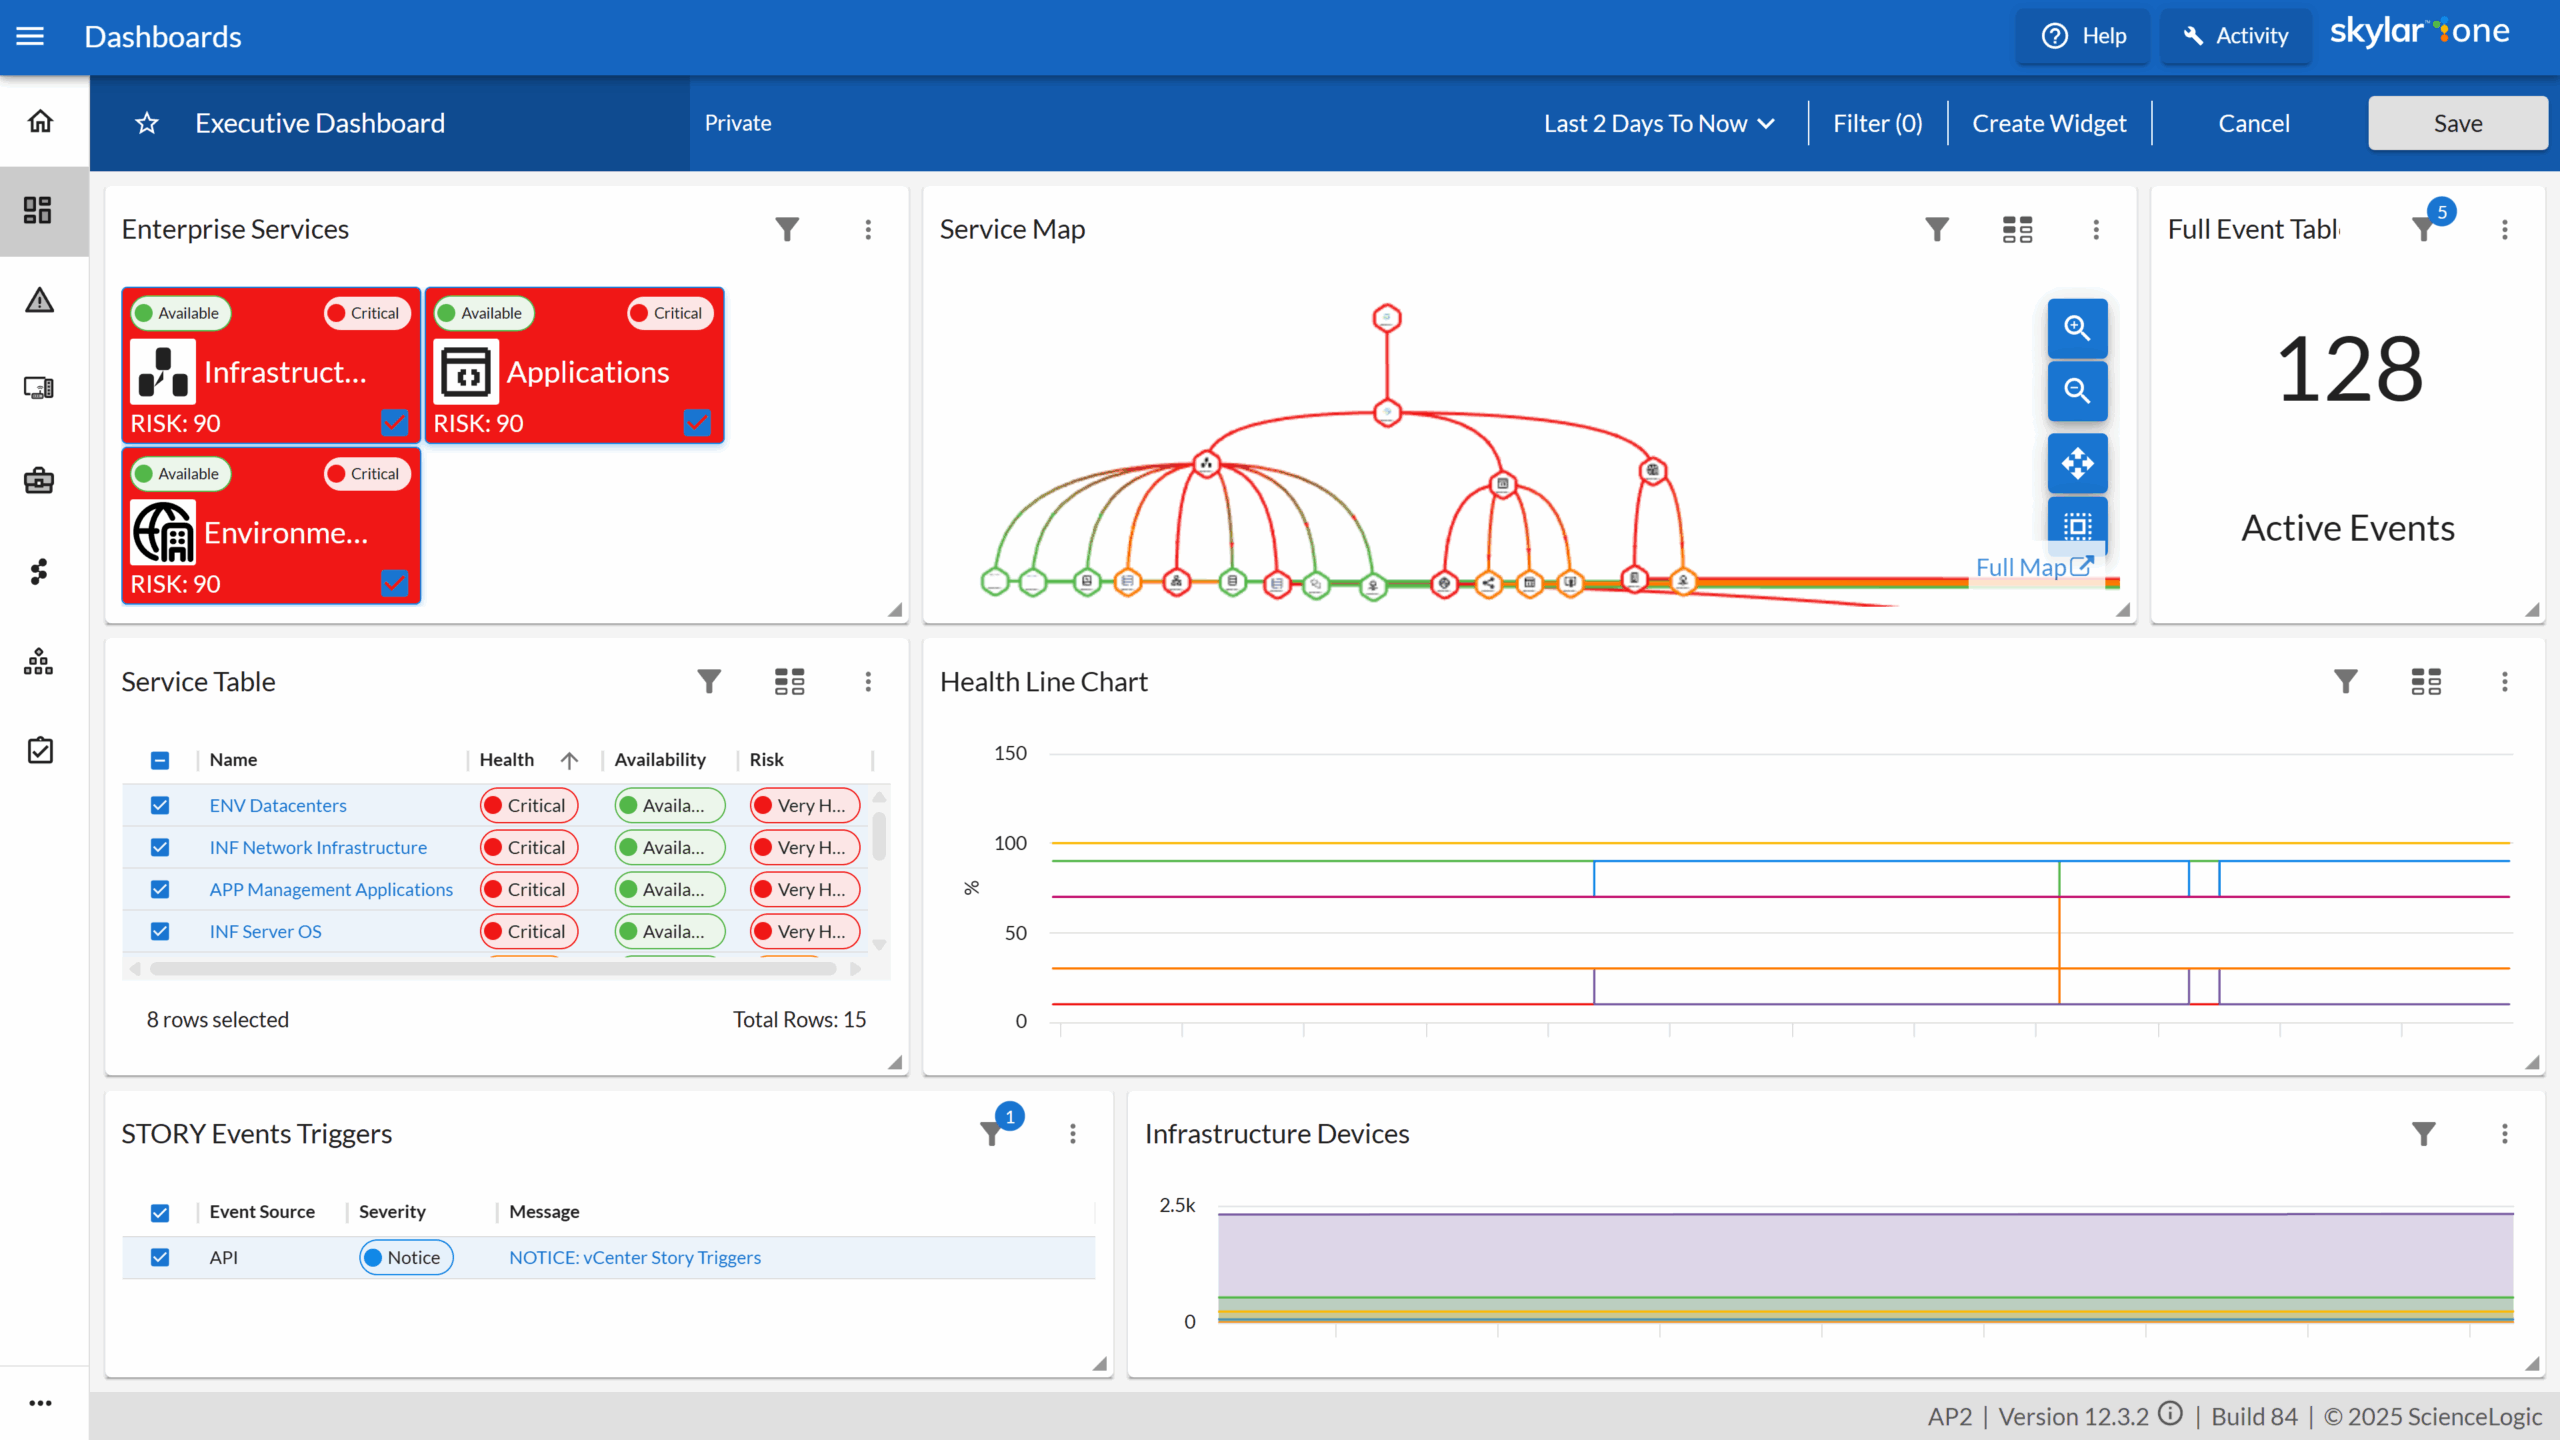
The ScienceLogic AI Platform provides real-time discovery and visibility across hybrid IT infrastructure, from legacy hardware to cloud and edge devices, consolidated into a single interface. Its core observability offering, Skylar One, unifies visibility across hybrid and multi-vendor environments.
The platform contextualizes data through relationship mapping so teams can see how infrastructure supports business services. It can be deployed on premises, in the cloud, across hybrid environments, or as a SaaS offering, which gives organizations moving off a self-hosted Nagios deployment a range of migration paths.
Key features include:
- Real-time discovery and monitoring: Ingests operational data across hybrid infrastructure and consolidates it into a single-pane-of-glass view.
- Relationship and service mapping: Contextualizes data through relationship mapping to show business service impact and identify service risks.
- Skylar AI analysis: Uses unsupervised learning to perform automated log analysis, deliver root cause analysis in plain language, and correlate anomalies.
- Configuration and compliance management: Skylar Compliance monitors, records and backs up network configurations with scheduled audits and one-click restoration.
- Workflow automation: Skylar Automation and PowerFlow synchronize IT assets with the CMDB, open ITSM tickets, and enrich them with diagnostic data.
- Hybrid cloud monitoring: Provides end-to-end visibility across multi-cloud architectures alongside on-premises environments.
Limitations (as reported by users on G2):
- Alert noise: Reviewers report false positives and describe alert tuning as a complicated exercise.
- Learning curve: Users unfamiliar with AIOps platforms describe needing weeks before they are comfortable customizing dashboards and correlation rules.
- Customization time: Modifying PowerPacks and dynamic applications is reported to take longer than expected.
- Device lifecycle management: Onboarding and decommissioning devices is described as less efficient than users would like.
Source: ScienceLogic
Open Source Monitoring Platforms
4. Zabbix

Best for: Free all-in-one monitoring of networks, servers and apps
Strengths: Agent and agentless collection, templates, proxies, SLA
Things to consider: Steep learning curve and dated interface
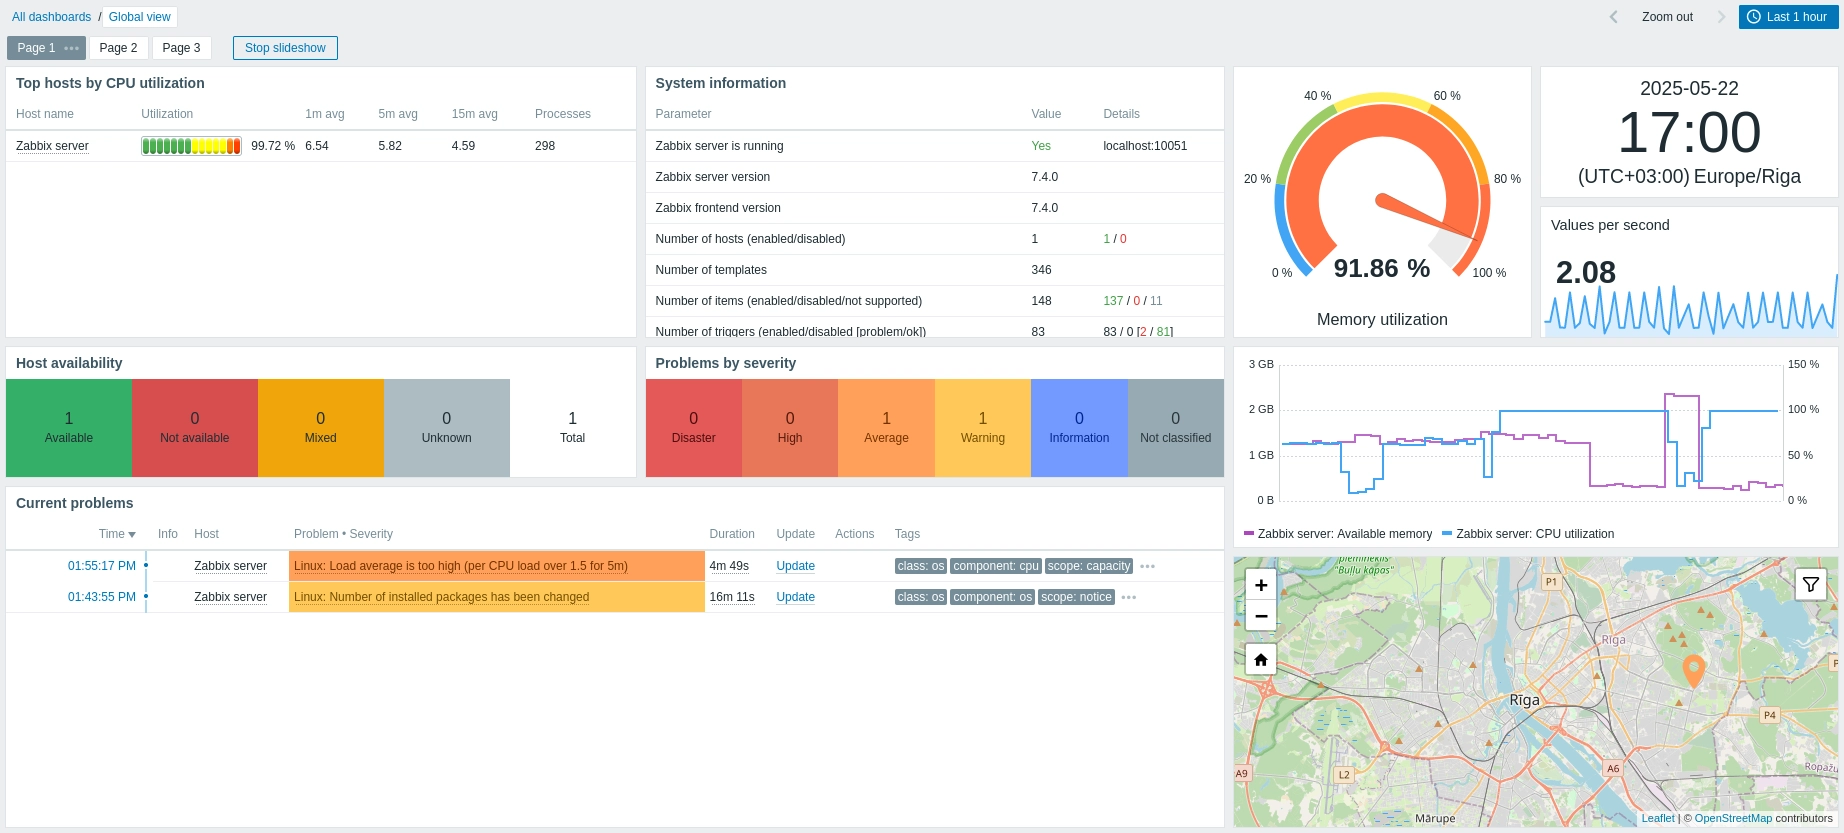
Zabbix is an open-source monitoring and observability platform that collects metrics from network devices, cloud services, containers, virtual machines, operating systems, log files, databases, applications and IoT sensors. It supports both push and pull collection with a minimum polling interval of one second.
For teams leaving Nagios, Zabbix keeps the self-hosted model but replaces file-based configuration with templates, discovery and a web interface. It also adds problem correlation, business service monitoring and SLA calculation on top of basic host and service checks.
Key features include:
- Agent and agentless collection: A native agent runs on Linux, Windows, Solaris, AIX, macOS and BSD, while agentless checks use SNMP v1/2c/3, IPMI, SSH, Telnet, ODBC, ICMP and TCP.
- Problem detection and prediction: Flexible trigger thresholds, flapping protection, baseline-driven anomaly detection and predictive functions that forecast when a threshold will be reached.
- Root cause correlation: Marks problems as cause or symptom events, suppressing floods of secondary issues so only the root cause is displayed.
- Business service monitoring: Hierarchical service trees calculate SLA levels and simulate outages to show business-level impact.
- Distributed monitoring with proxies: Zabbix proxies collect data behind firewalls or across remote locations while reporting to a central view.
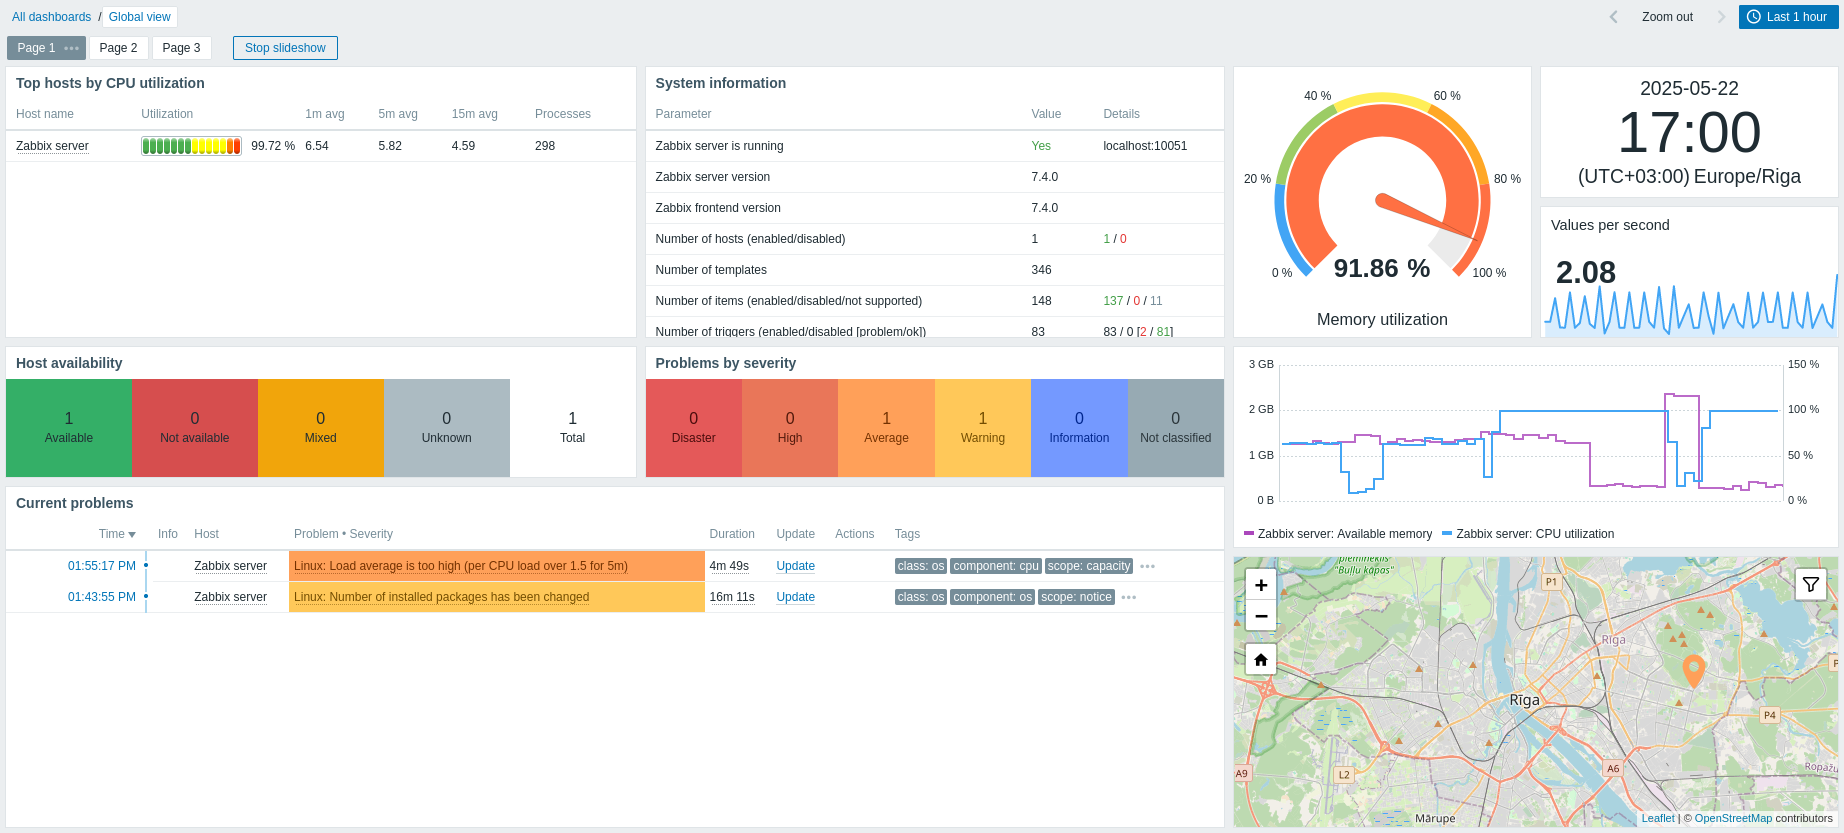
- Visualization and reporting: Widget-based dashboards, infrastructure and geo-maps, custom graphs and scheduled PDF reports.
Limitations (as reported by users on G2):
- Learning curve: Reviewers consistently describe initial setup, trigger configuration and key syntax as difficult for newcomers.
- Dashboard constraints: Several reviewers report that dashboards lack widgets and calculation options they expected, leading them to supplement with Grafana.
- Interface age: The web interface is repeatedly described as functional but dated.
- Database tuning at scale: Reviewers note that large deployments require database optimization and can slow under load.
- Support model: Reviewers point out that the free edition relies on community support, with professional support priced separately.
Source: Zabbix
5. Checkmk

Best for: Check-based monitoring with heavy configuration automation
Strengths: Auto-discovery, 2,000+ integrations, distributed sites
Things to consider: Complex configuration and alert handling
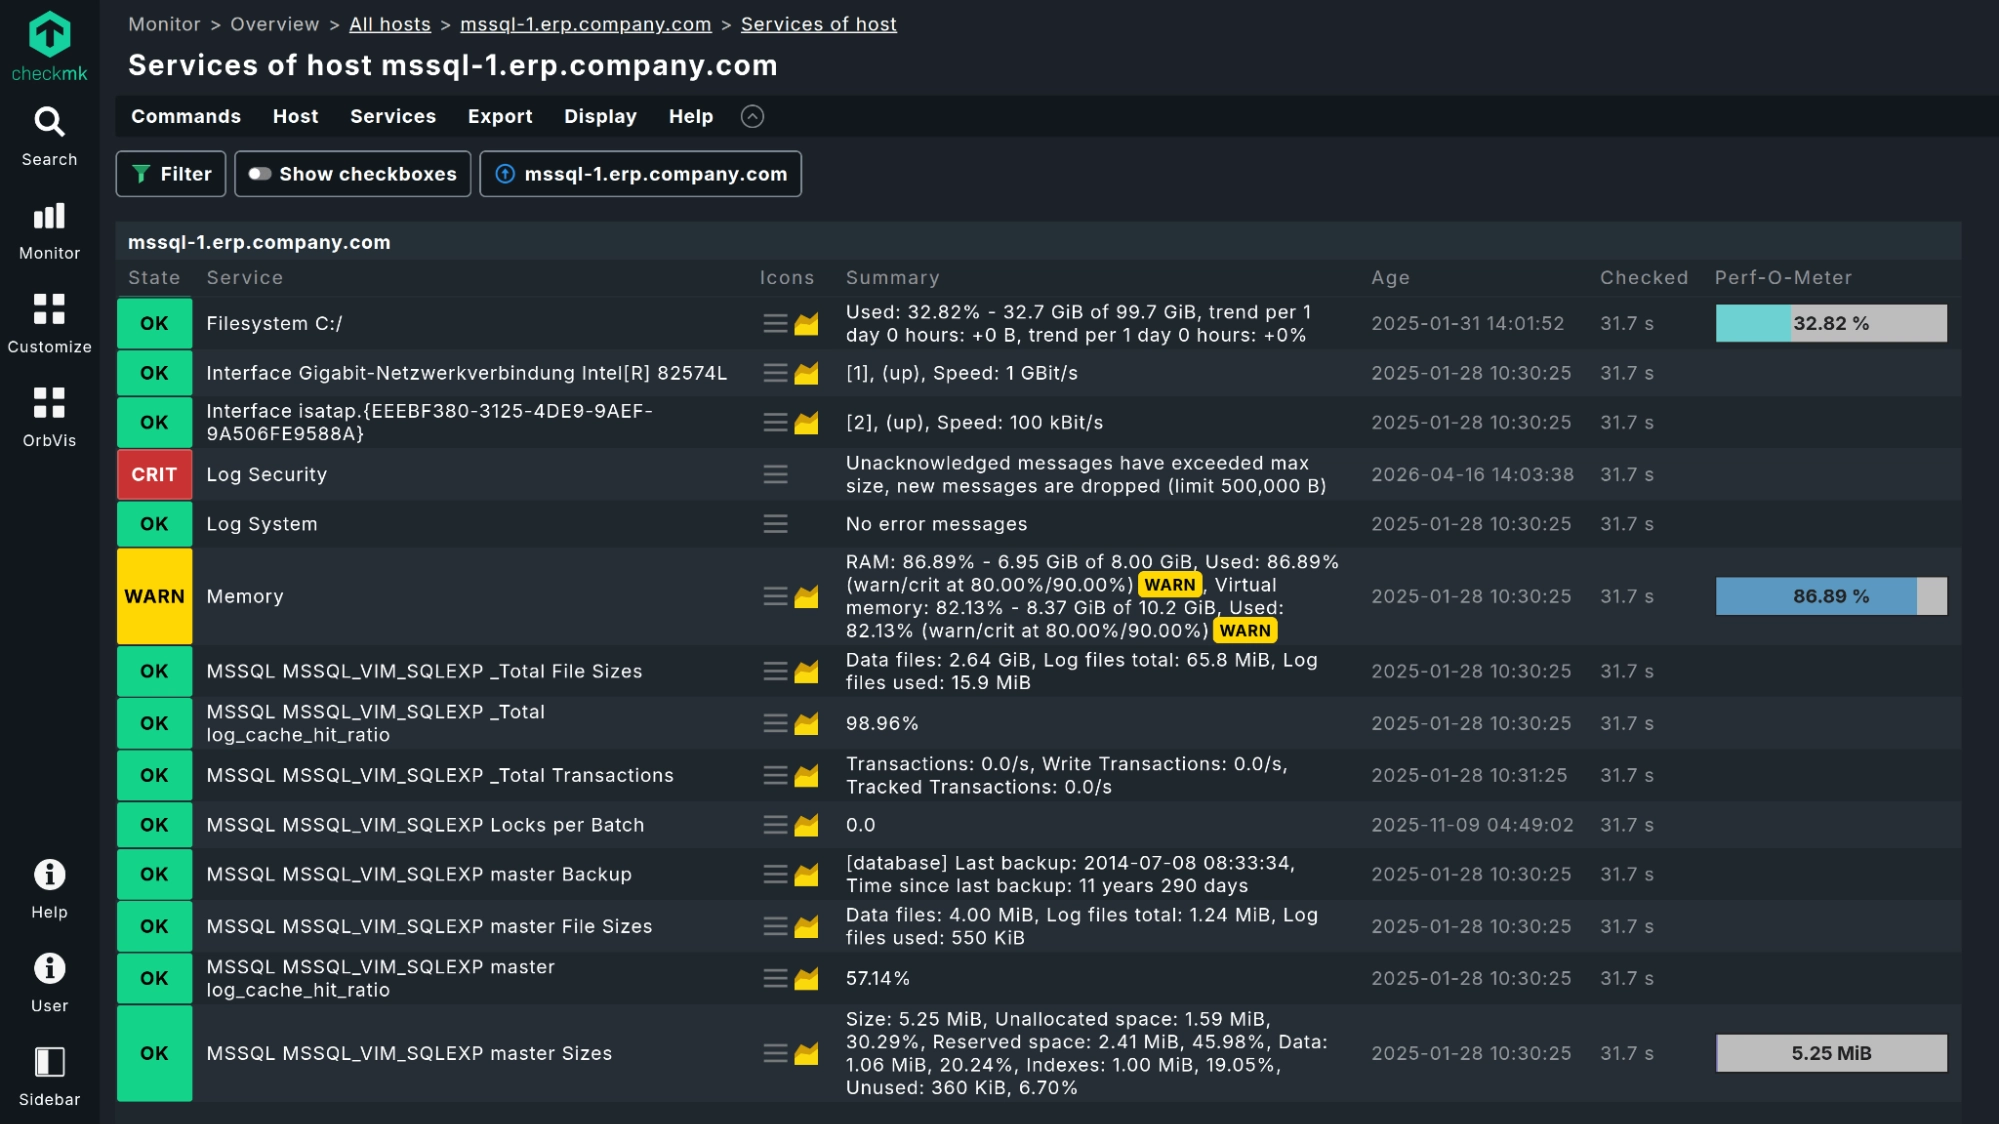
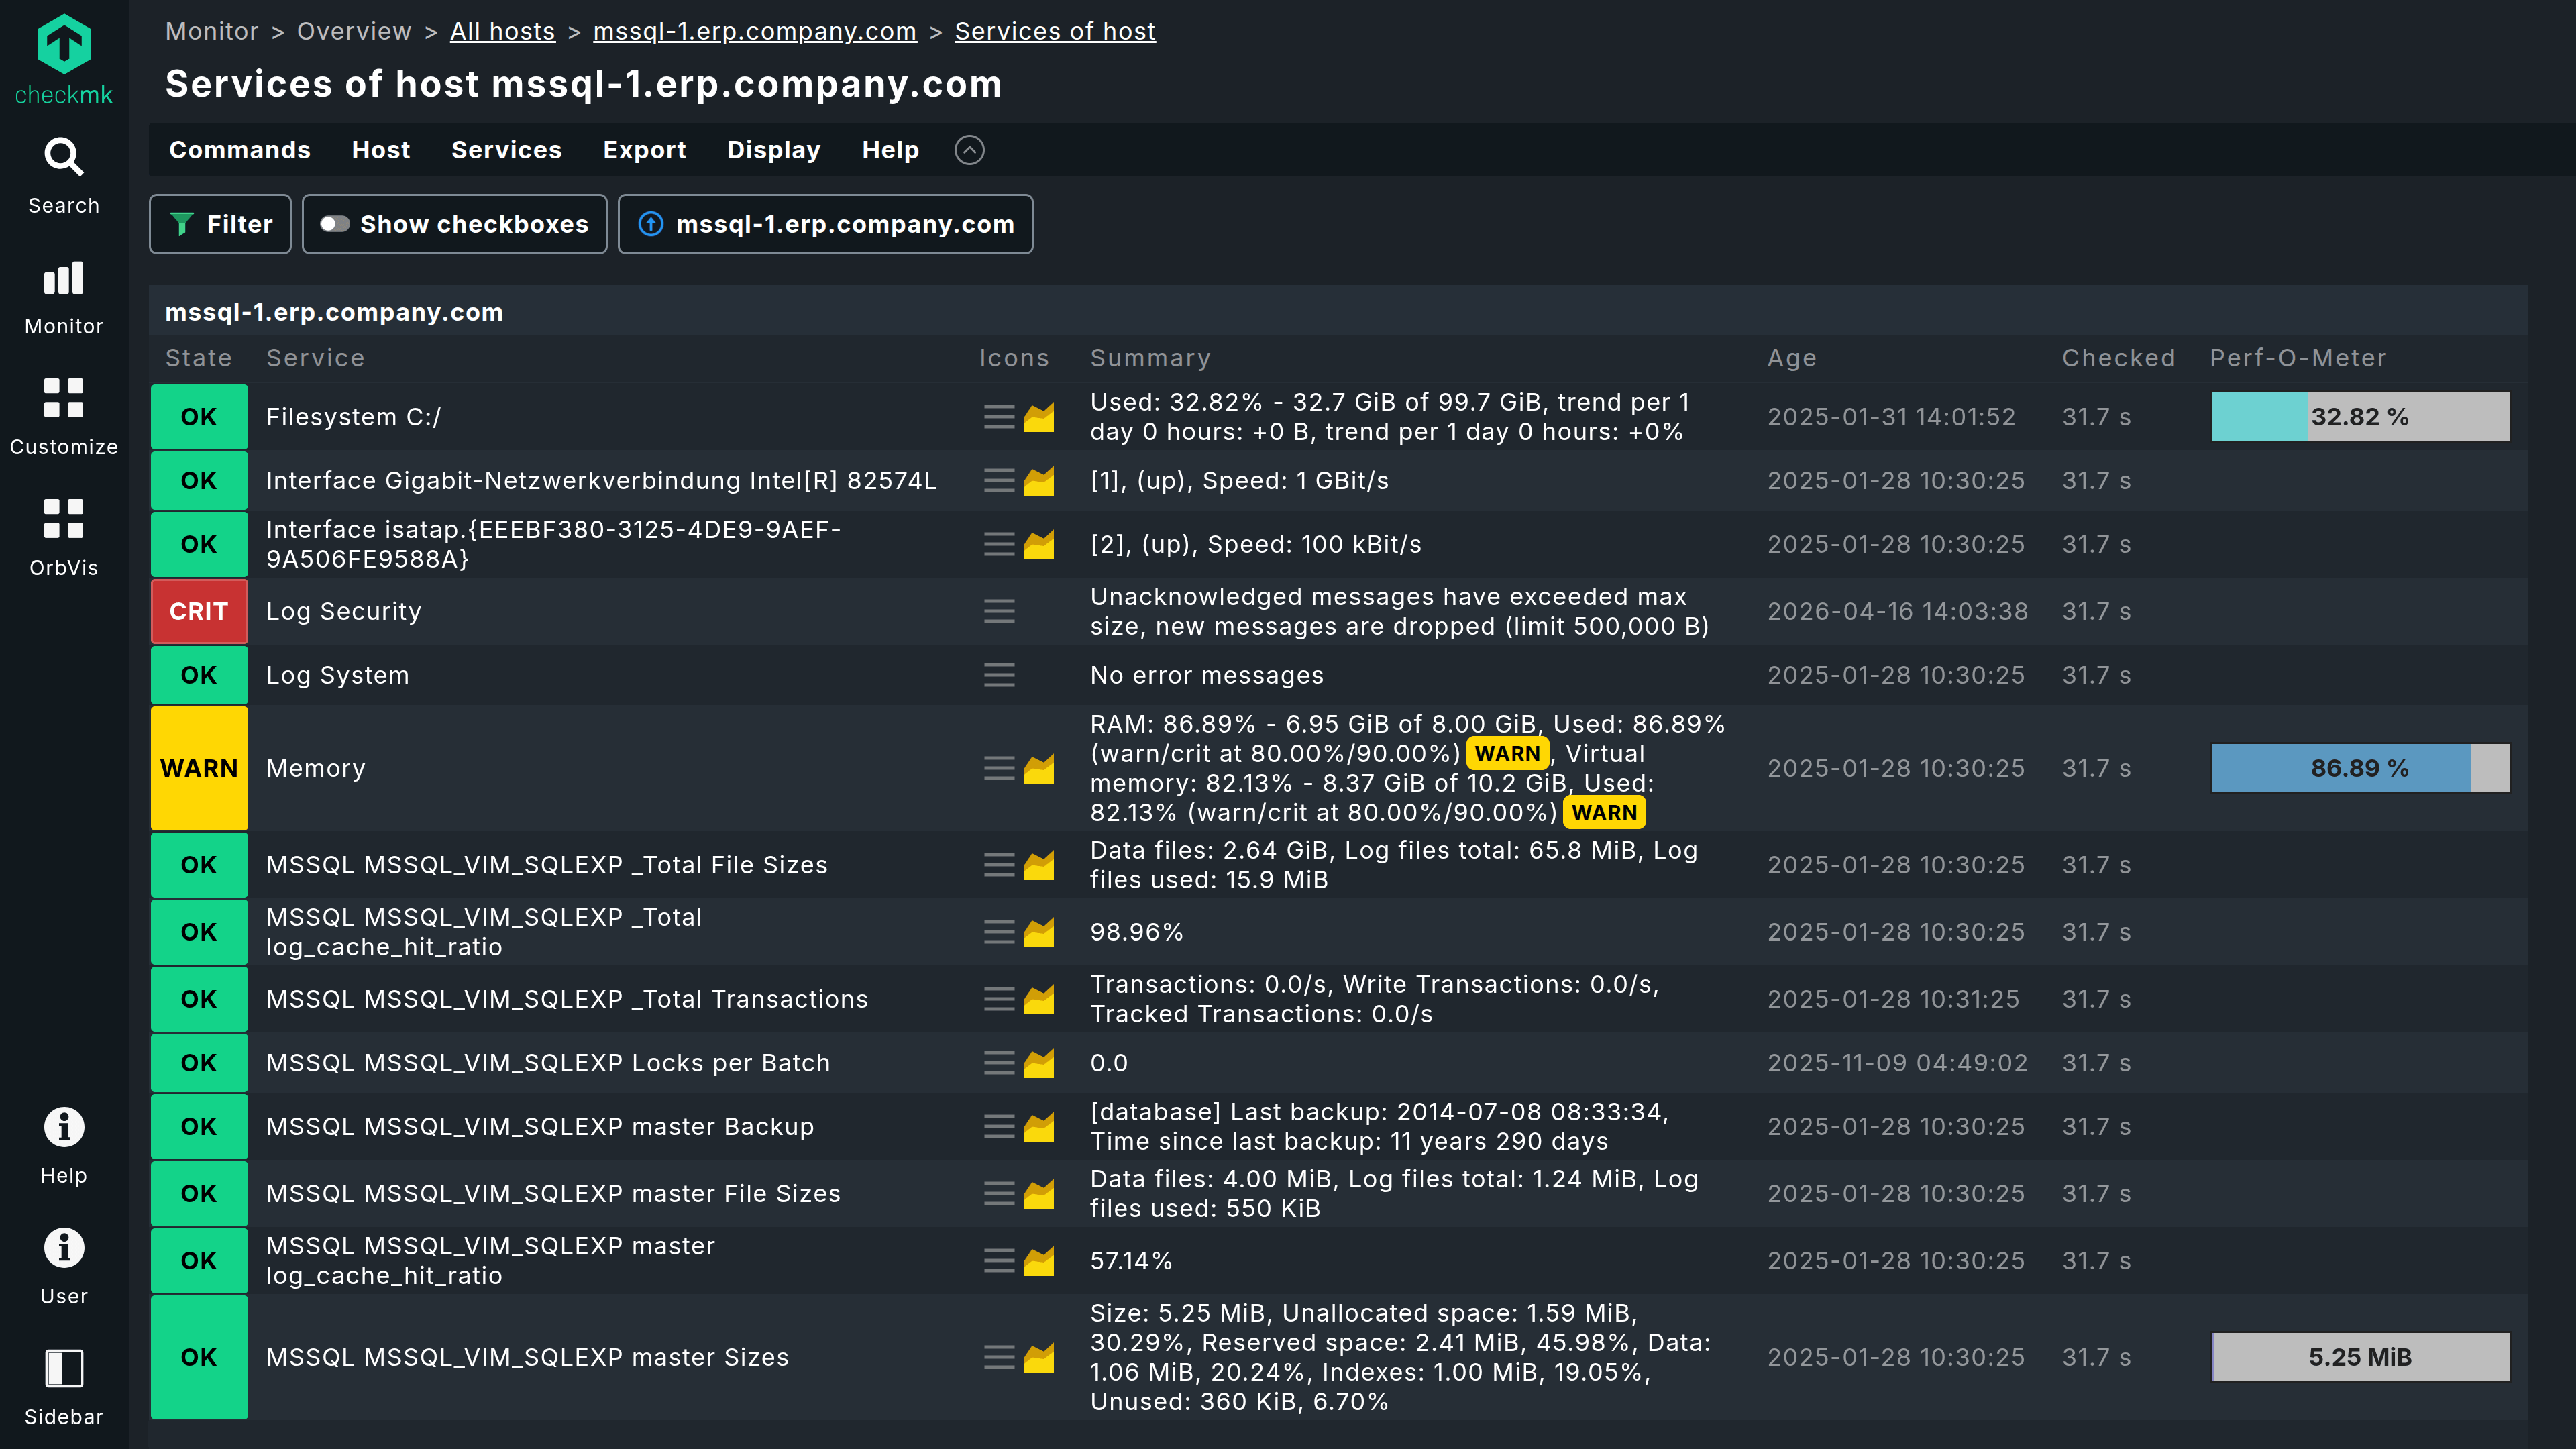
Checkmk unifies infrastructure monitoring, application observability and synthetic monitoring in one platform, with editions ranging from a free open-source community build to self-hosted and SaaS commercial tiers. Automated discovery finds and connects hosts and services across servers, networks, storage, cloud workloads, containers and applications.
Data collection is deliberately flexible. Standard collectors such as OpenTelemetry and Syslog, agentless methods including SNMP and vendor APIs, and lightweight agents all operate within the same platform, which removes much of the plugin assembly work a Nagios deployment requires.
Key features include:
- Automated discovery: Detects new hosts and services as soon as they appear, keeping monitoring current as infrastructure changes.
- Agent Bakery: Builds, customizes and distributes agent packages centrally so agents can be rolled out across thousands of hosts without manual work.
- Mixed collection methods: Combines OpenTelemetry and Syslog collectors, agentless SNMP and vendor API polling, and agent-based host monitoring in one system.
- AI-powered root cause analysis: Correlates alerts automatically and surfaces the most likely origin of an incident to cut through noise.
- Distributed deployments and multi-tenancy: Connects hundreds of remote sites to one central instance, with role-based access and strict data segregation between business units or clients.
- Integration library: More than 2,000 integrations cover servers, networks, databases, cloud platforms, Kubernetes, storage and SNMP devices.
Limitations (as reported by users on G2):
- Configuration complexity: Reviewers describe the configuration model and its components as difficult to understand initially.
- Onboarding difficulty: Occasional users report that onboarding is hard and the interface confusing without regular use.
- Advanced customization: Developing custom checks and using advanced configuration options is described as having a steep learning curve.
- Alert handling: Reviewers find acknowledging alerts unintuitive and cumbersome.
- Integration and export: Data export and certain third-party integrations are reported to need additional scripting.
Source: Checkmk
6. Icinga

Best for: Nagios-compatible monitoring with a modern API and UI
Strengths: Plugin compatibility, clustering, REST API, Director
Things to consider: Complex install and limited native dashboards
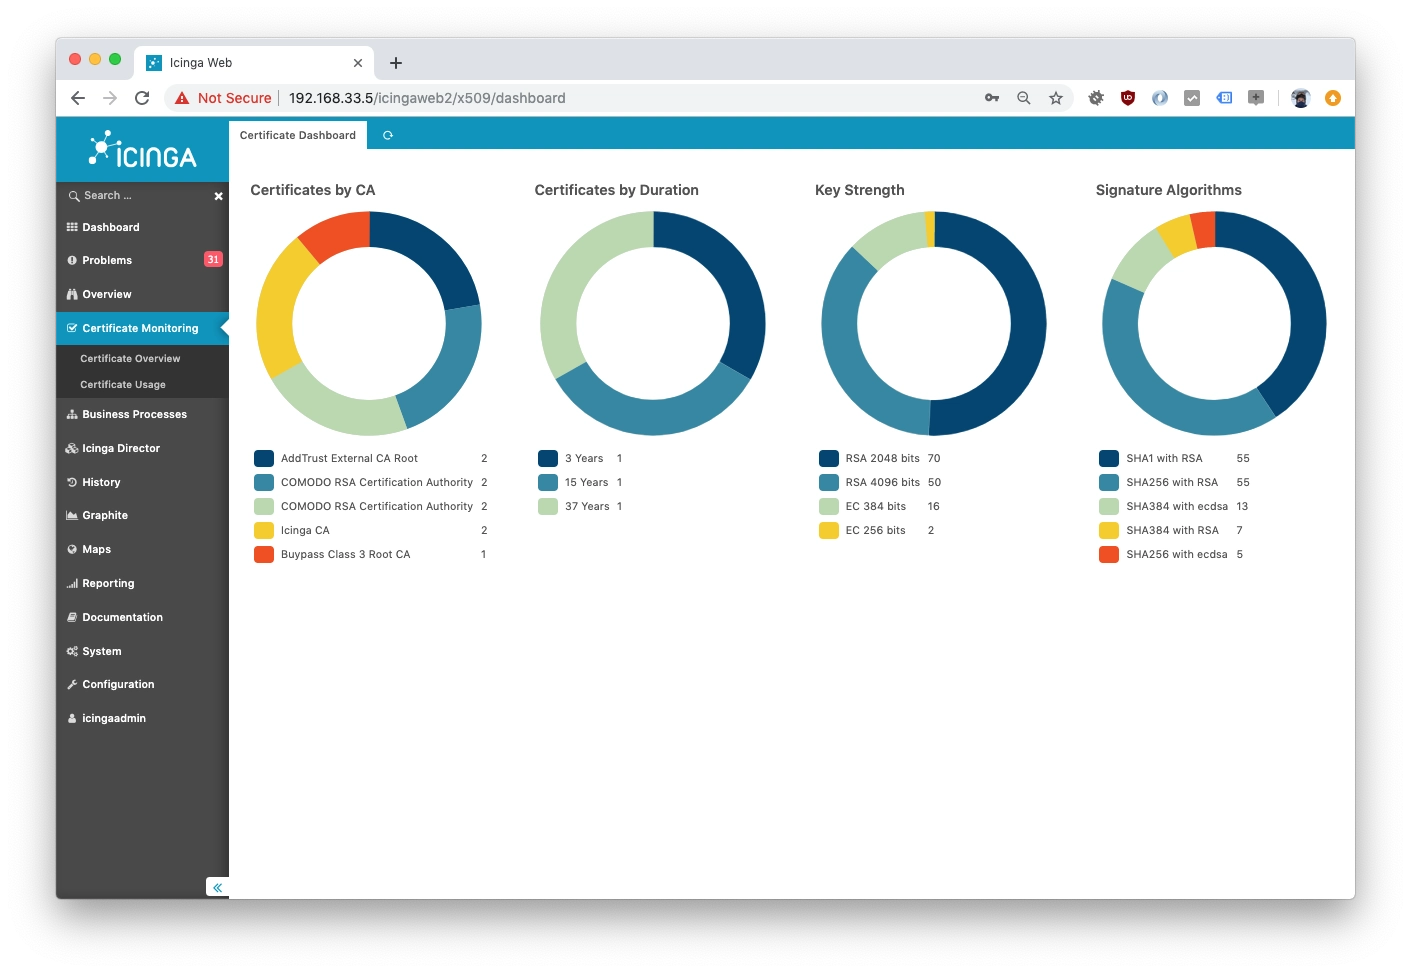
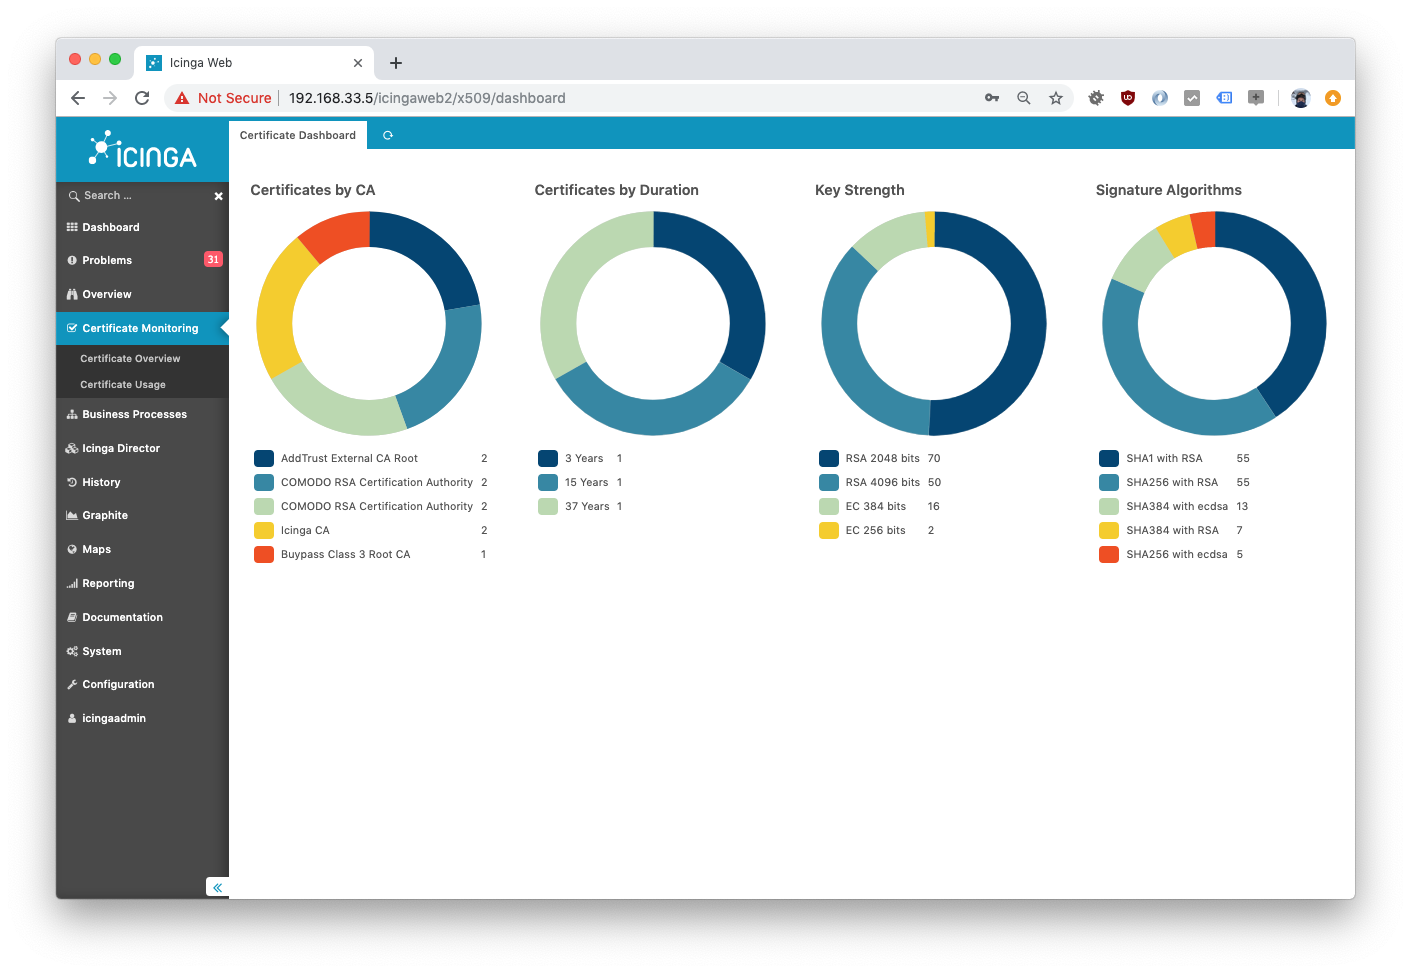
Icinga is an open-source monitoring platform that continuously checks the health and performance of networks, servers, applications and services from one centralized interface. It monitors on-premises, cloud and container environments in real time.
For Nagios users it is the most direct migration path, since existing configurations can often be reused or adapted thanks to its compatible architecture. Icinga adds apply rules, control structures and functions to configuration, plus clustering for high availability, and recent versions export metrics natively through OpenTelemetry to backends such as Prometheus and VictoriaMetrics.
Key features include:
- Nagios-compatible configuration: Existing Nagios-based configurations and monitoring plugins can typically be reused or adapted during migration.
- Rule-based configuration: Apply rules replace concrete object definitions, with control structures, functions and dependencies available in the configuration language.
- Clustering and high availability: Distributed setups scale to thousands of hosts with clustering that removes a single point of failure.
- APIs and automation: Advanced APIs and integrations with Ansible, Puppet and Terraform connect monitoring to existing automation workflows.
- Native OpenTelemetry export: Icinga 2 exports metrics to OTEL-compatible backends without additional tooling.
- Broad monitoring coverage: Dedicated capabilities for server, network, database, application, Windows, VMware and Kubernetes monitoring.
Limitations (as reported by users on PeerSpot):
- Installation and configuration: Reviewers describe installation and configuration as very complex, with a hard start for new users.
- Built-in dashboards: Users report that native dashboarding is less capable and less visually refined than dedicated APM tools.
- Notification gaps: Some reviewers report difficulty getting notifications working as expected in their deployments.
- Custom check development: Reviewers note that certain checks require writing backend scripts that they would prefer to be built in.
- Documentation coverage: Documentation is described as incomplete for less common operating systems and deployment paths.
Source: Icinga
7. Prometheus

Best for: Metrics collection and alerting in cloud-native environments
Strengths: Service discovery, PromQL, exporters, Alertmanager
Things to consider: Metrics only, with limited local retention
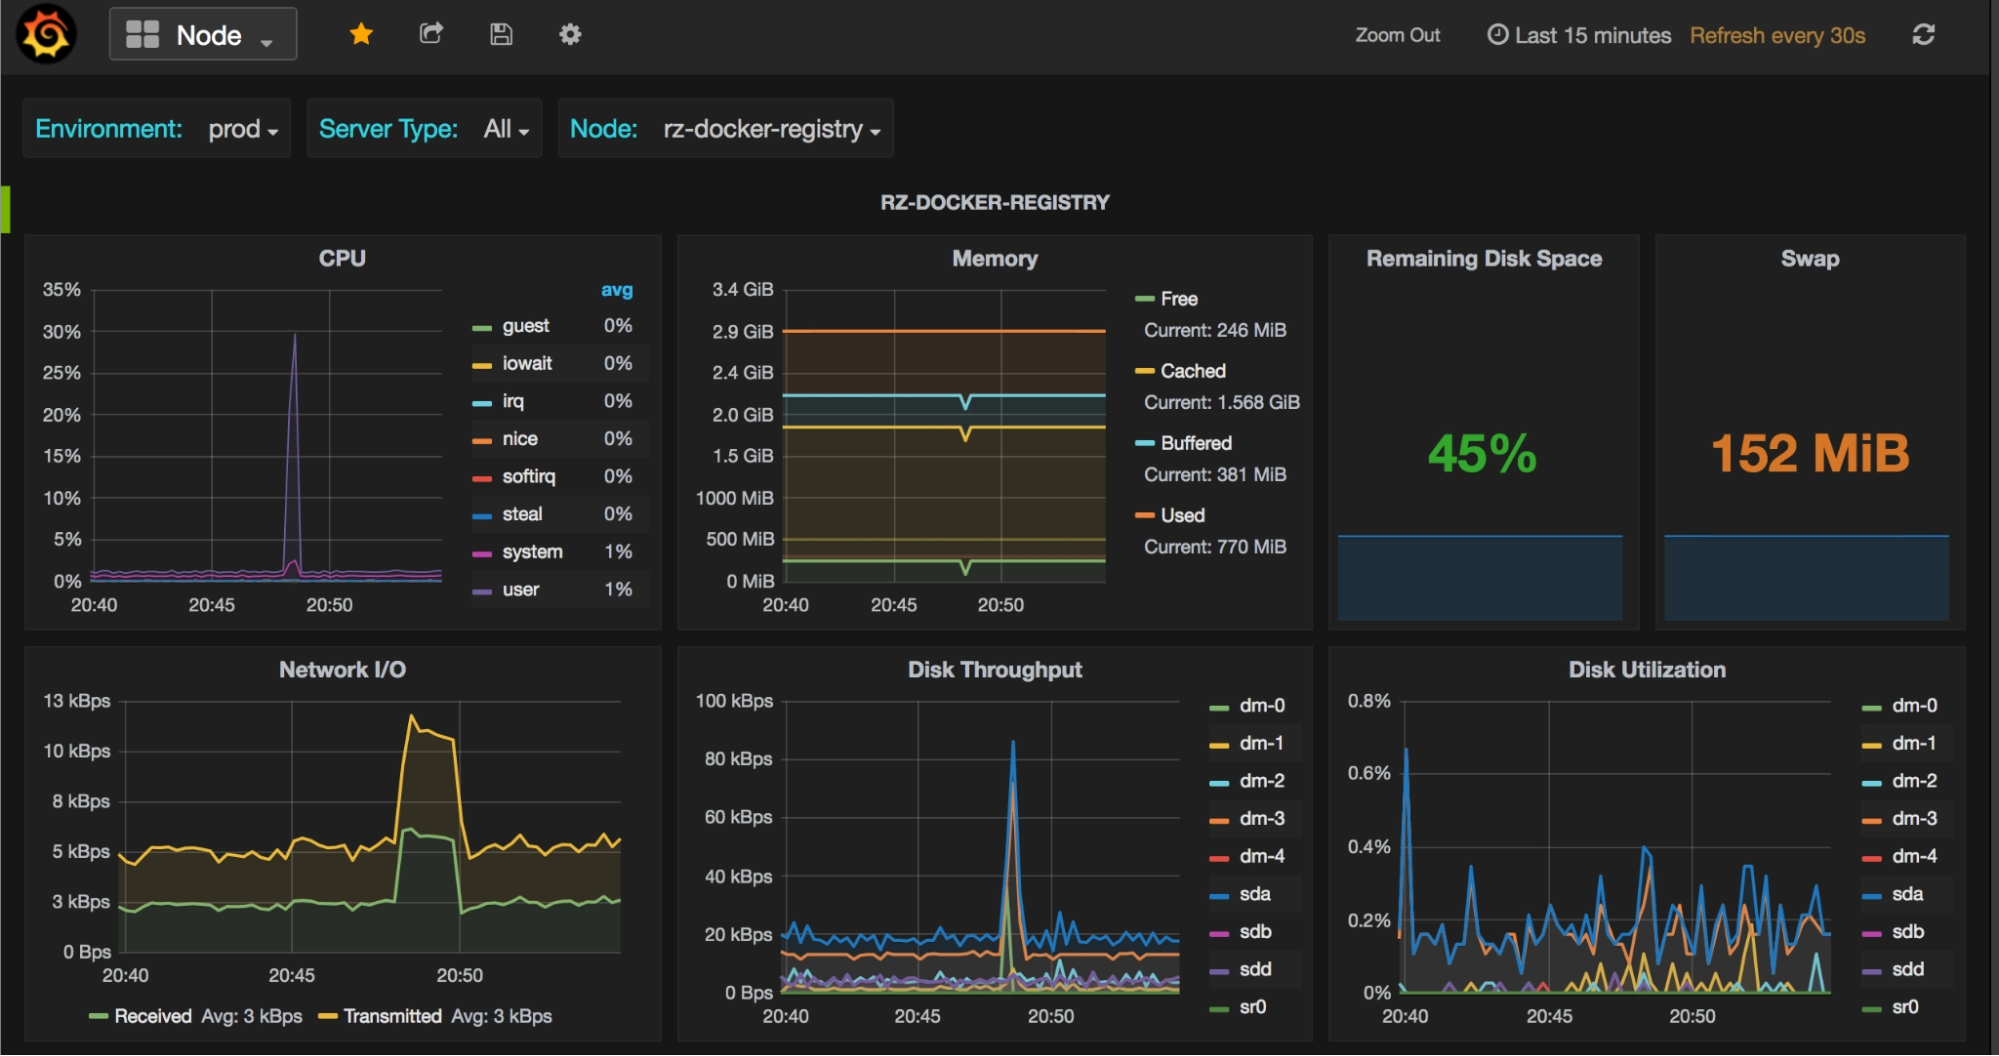
Prometheus is an open-source monitoring system and time series database that instruments, collects, stores and queries metrics for alerting and dashboarding. It models time series in a dimensional data model where each series is identified by a metric name and a set of key-value pairs.
It integrates with Kubernetes and other cloud and container managers to continuously discover and monitor services, which addresses the ephemeral-infrastructure problem that static Nagios host definitions handle poorly. Prometheus is a graduated Cloud Native Computing Foundation project and all components are available under the Apache 2 License.
Key features include:
- Service discovery: Integrates with Kubernetes and other container and cloud managers to find and monitor targets as they appear.
- PromQL query language: Queries, correlates and transforms time series data for visualizations and alerts.
- Alerting rules and Alertmanager: Alerting rules are written in PromQL, and a separate Alertmanager component handles notification routing and silencing.
- Independent server operation: Servers operate independently and rely only on local storage, with statically linked Go binaries that deploy across varied environments.
- Instrumentation libraries: Official and community-contributed client libraries cover most major programming languages.
- Exporter ecosystem: Hundreds of official and community integrations extract metrics from existing systems.
Limitations (as reported by users on PeerSpot):
- Metrics-only scope: Reviewers point out that Prometheus handles metrics rather than logs, so it is typically paired with other tools.
- Retention limits: Built-in storage is described as limited, with users adding external components for long-term data.
- Query language learning curve: Reviewers report that the query language and setup are difficult without technical expertise.
- Setup effort: Users describe needing dedicated staff to configure and manage the deployment.
- Clustering: Some reviewers note the absence of native clustering as a scalability constraint.
Source: Prometheus
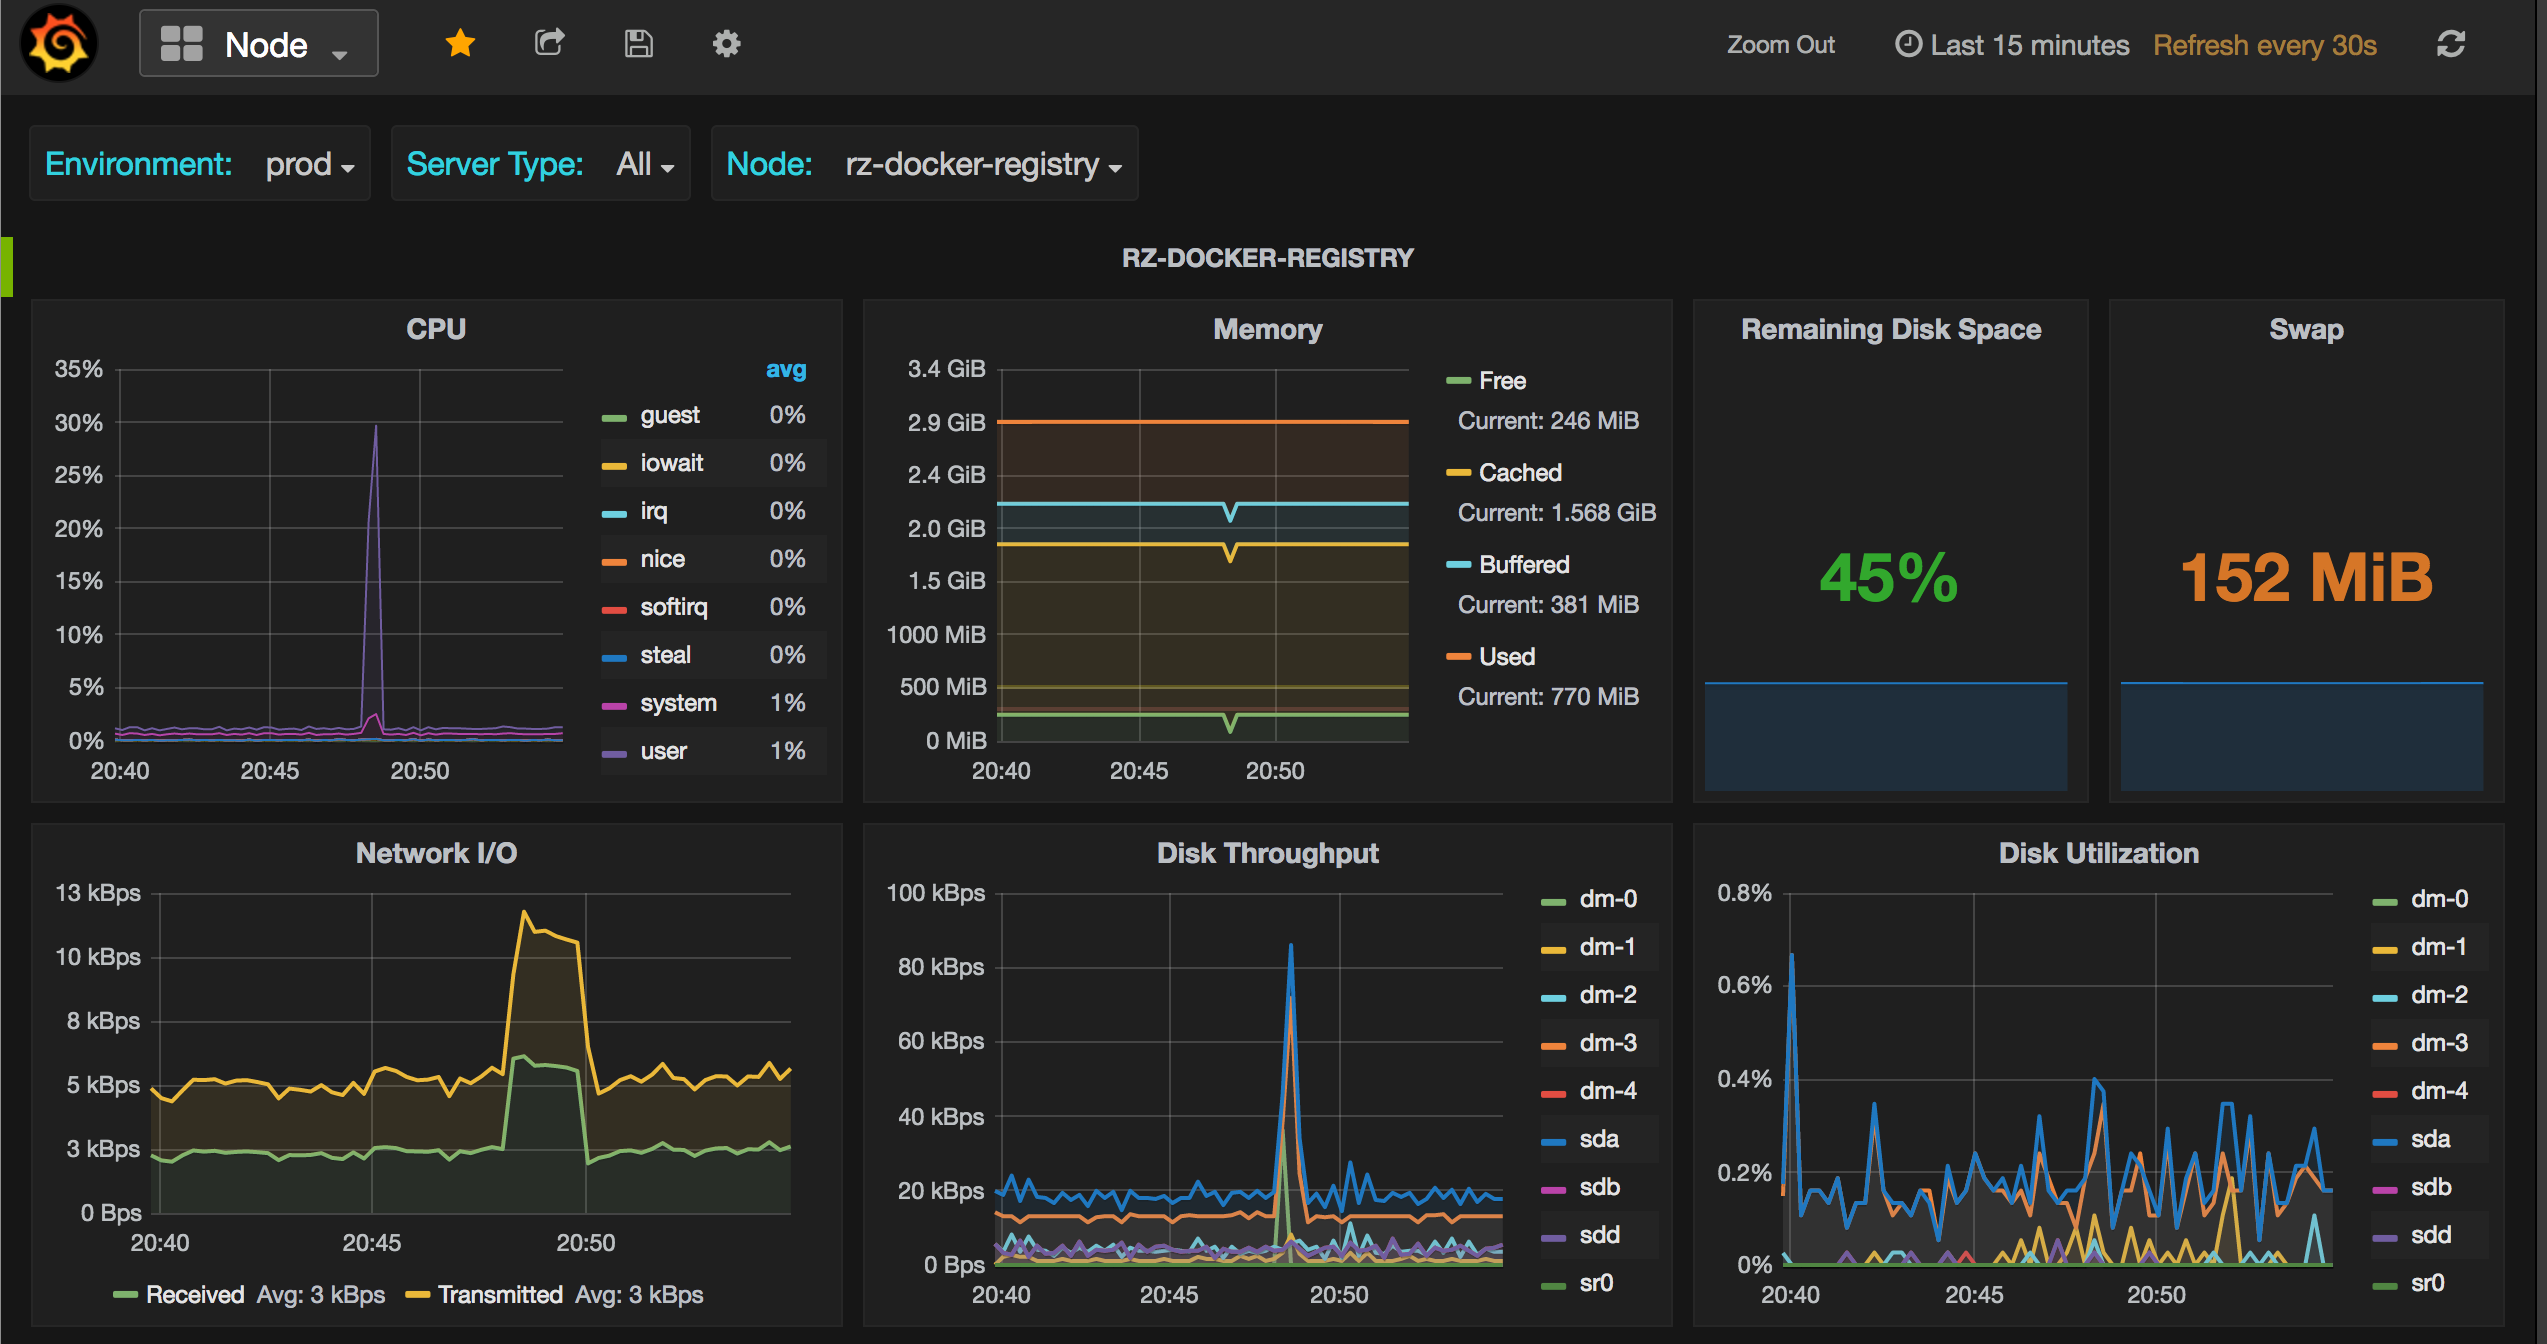
Commercial Infrastructure and Network Monitoring Tools
8. Paessler PRTG
Best for: Sensor-based monitoring of networks, servers and OT
Strengths: Easy setup, maps and dashboards, SNMP and flow support
Things to consider: Sensor licensing costs and UI speed at scale
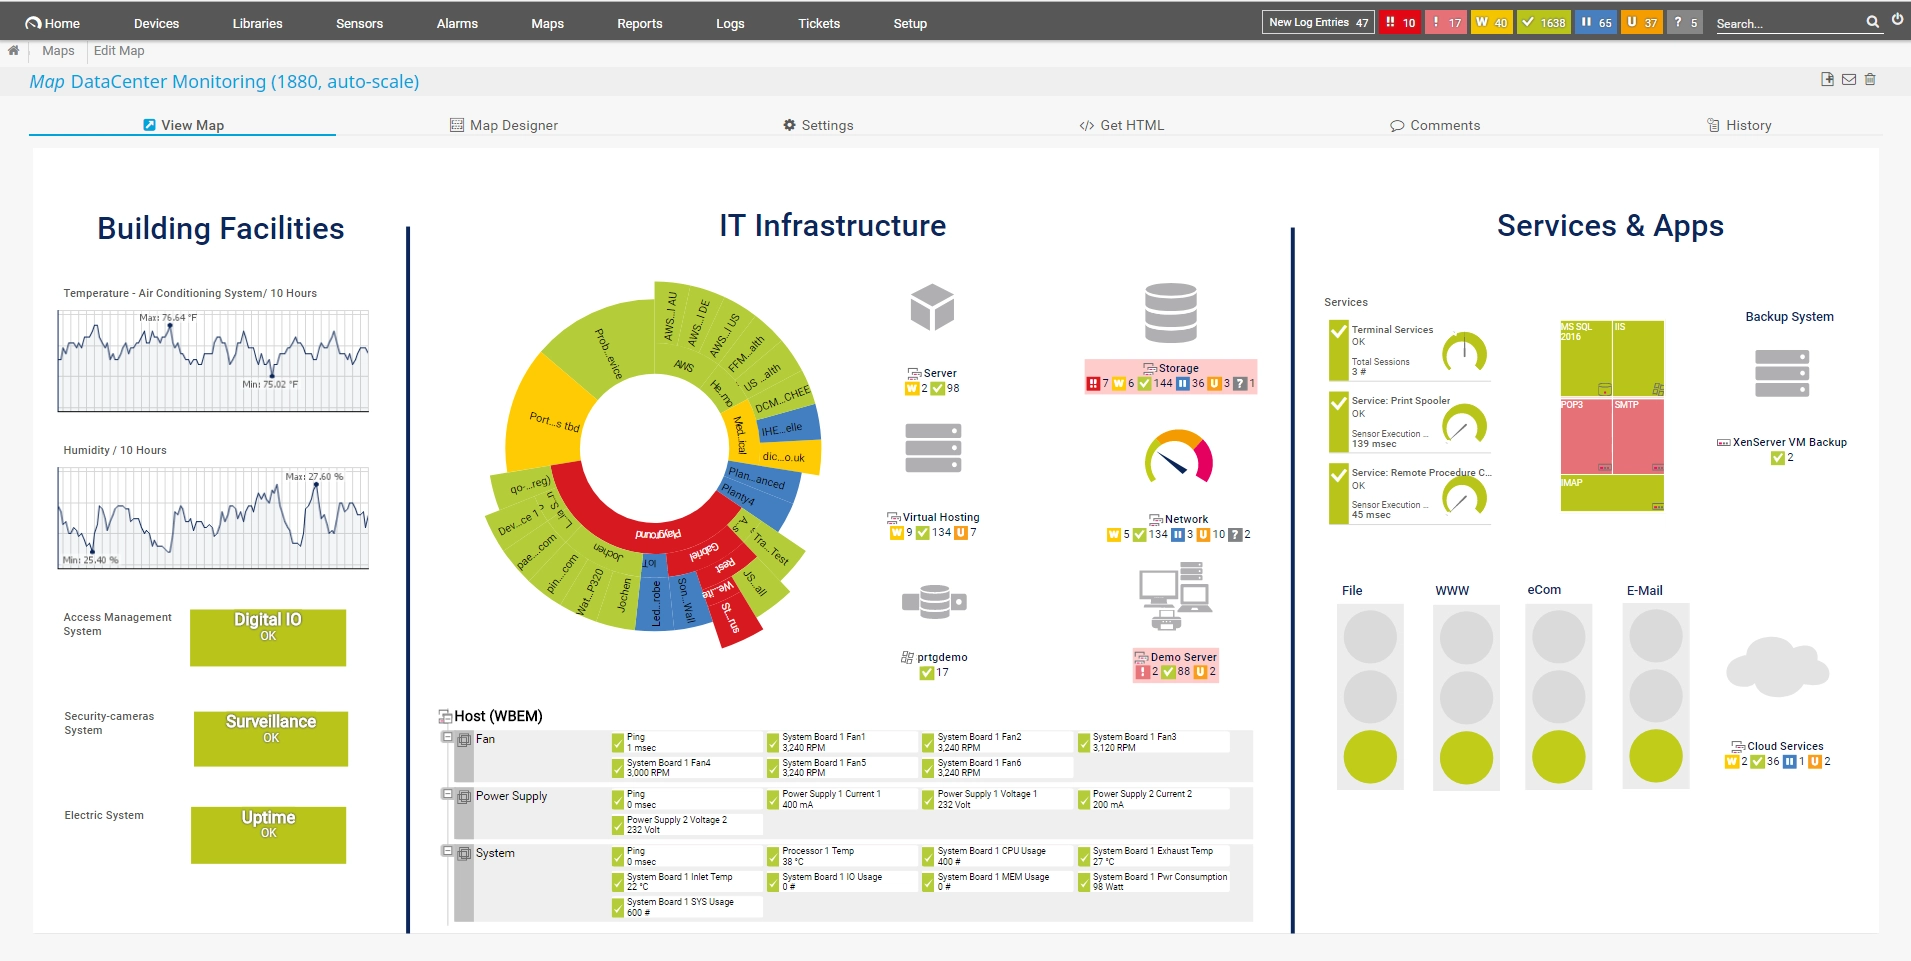
Paessler PRTG monitors systems, devices, traffic and applications across networks, servers, databases, cloud services and operational technology from a single platform. Monitoring is organized around sensors, with each sensor tracking a specific metric or service.
The product line spans PRTG Network Monitor, PRTG Enterprise Monitor and the hosted PRTG Hosted Monitor, alongside PRTG UVexplorer for network mapping. Configuration is done through a web interface, desktop app or mobile apps rather than text files, which is the main practical difference from Nagios for day-to-day administration.
Key features include:
- Broad monitoring coverage: Sensors monitor networks, LANs, servers, databases, applications and cloud services from one console.
- SNMP and traffic analysis: Monitors devices via SNMP and analyzes bandwidth using NetFlow, with a built-in network traffic analyzer and syslog server.
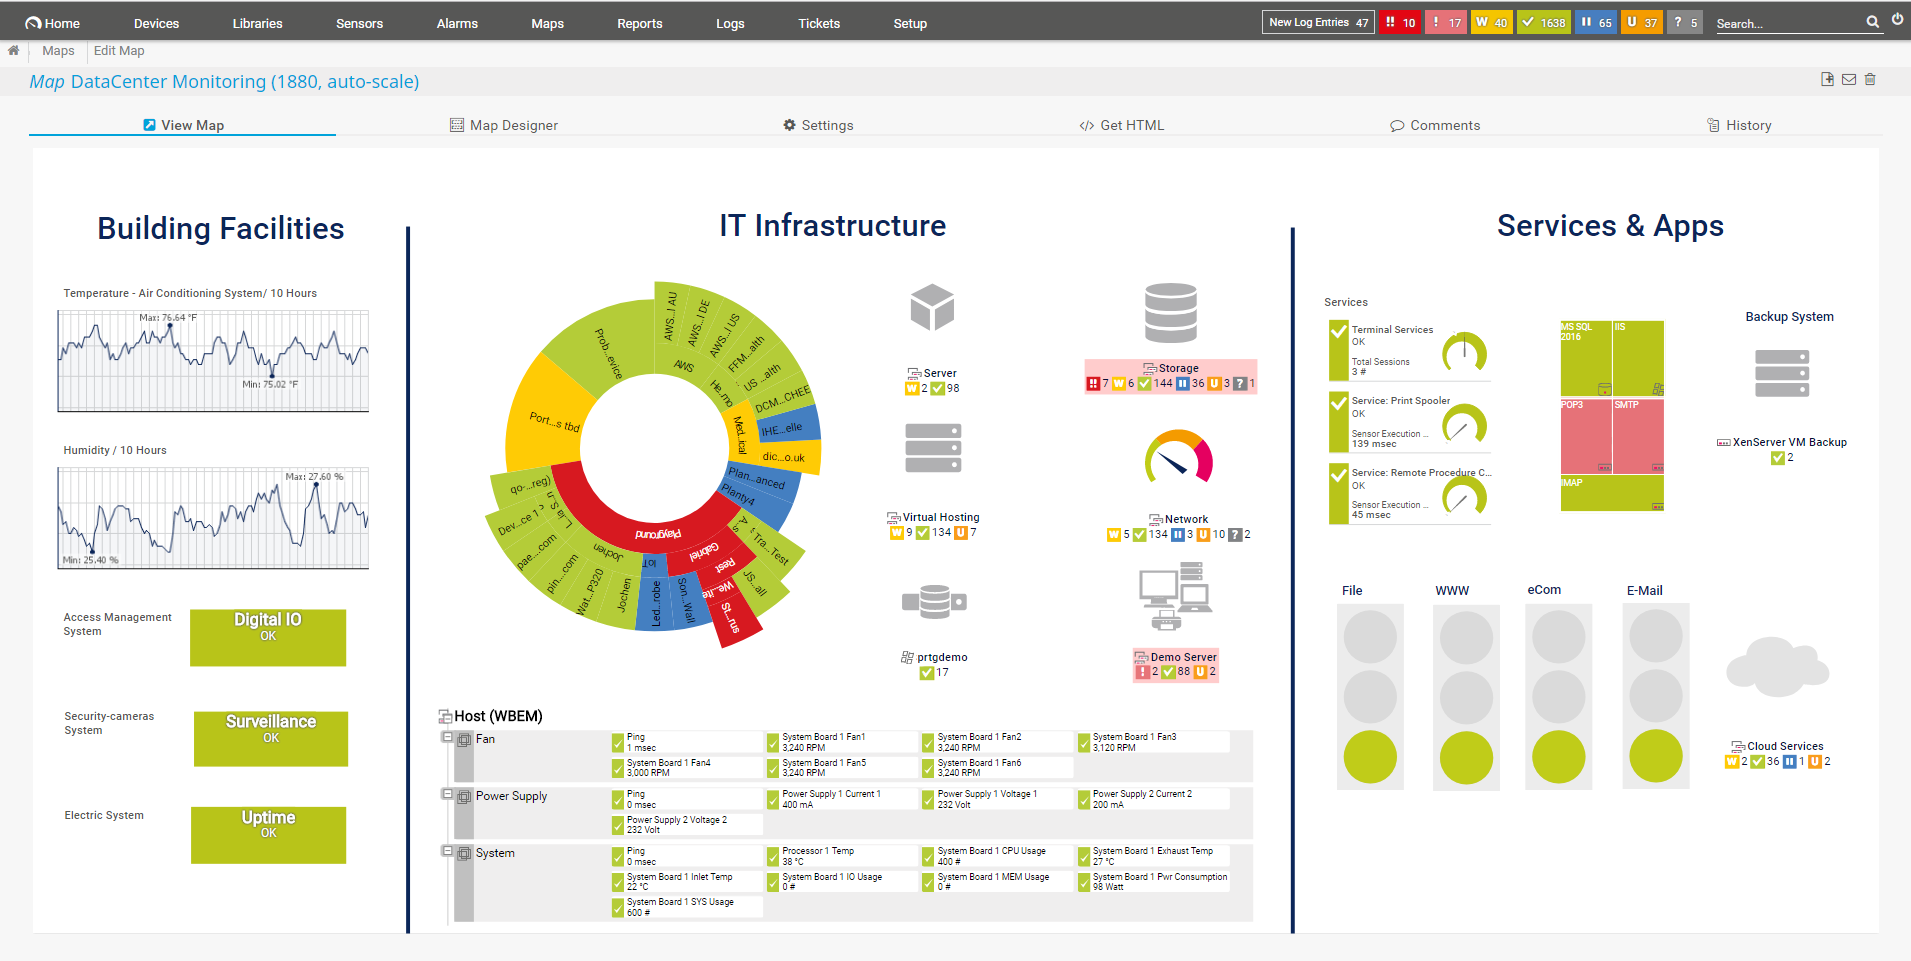
- Maps and dashboards: Real-time maps display live status information, and the map designer builds custom dashboards.
- Alerts and notifications: Custom thresholds trigger built-in notification methods including email, push and HTTP requests.
- Multiple interfaces: A web interface, a desktop app for bulk editing of monitoring objects, and iOS and Android apps.
- Extensibility: An HTTP API and custom sensors extend monitoring to systems not covered out of the box.
Limitations (as reported by users on G2):
- Sensor-based licensing: Reviewers report that costs rise as sensor counts grow, which they say constrains scalability in large environments.
- Performance at scale: Slow dashboard widget loading and general sluggishness are reported when managing large groups of servers.
- Interface design: The interface is frequently described as outdated, with inconvenient grouping and navigation.
- Initial configuration: Reviewers note that configuring complex infrastructures can feel overwhelming and that advanced customization requires deeper technical knowledge.
- Auto-discovery output: Some reviewers report that initial auto-discovery adds unnecessary sensors that then need pruning.
Source: Paessler
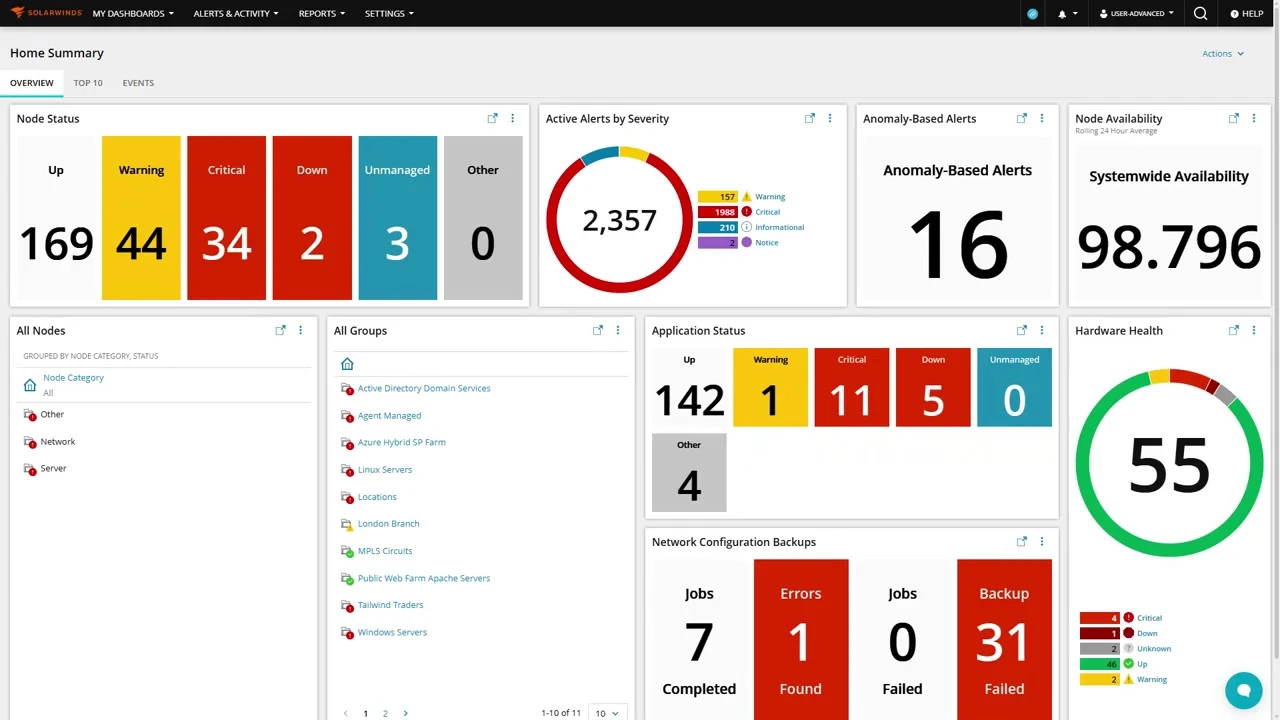
9. SolarWinds Observability Self-Hosted

Best for: Self-hosted hybrid monitoring across networks and apps
Strengths: Unified stack view, intelligent maps, anomaly alerting
Things to consider: Setup complexity and reporting limitations
SolarWinds Observability Self-Hosted, previously marketed as Hybrid Cloud Observability, brings networks, servers, applications, databases and cloud services into one view. It correlates data across the stack so teams troubleshoot from a shared source of truth.
The platform collects through agent-based, agentless and API-sourced methods, which lets it cover on-premises infrastructure alongside AWS, Azure and Google Cloud resources. Licensing is per node with polling engines included, and nodes can be allocated across instances under a single license.
Key features include:
- Unified hybrid visibility: Correlates network, server, application, database and cloud data to expose dependencies across the estate.
- Application and dependency views: Monitors applications, processes and services across Windows and Linux, with dependency mapping that indicates whether an issue originates in the app, the server or an external dependency.
- Network performance and routing analysis: Correlates routes, next hops, peers, interfaces and VRFs to identify unstable paths and isolate control-plane issues.
- Anomaly-based alerting: Machine learning establishes normal behavior and surfaces unusual performance to reduce reliance on static thresholds.
- Traffic and configuration management: Includes traffic and bandwidth analysis, network configuration management, IP address management and user device tracking.
- Flexible collection methods: Combines agent-based, agentless and API-sourced metrics across on-premises and hybrid environments.
Limitations (as reported by users on PeerSpot):
- Initial setup: Reviewers describe initial setup and configuration as complex for new users.
- Trend reporting: Building historical trend analysis reports is reported as difficult, with dashboards leaning toward live state.
- Performance with large data volumes: Handling extensive data is reported to slow the platform.
- Container and CI/CD coverage: Reviewers ask for stronger on-premises container monitoring and CI/CD observability.
- Third-party integrations: Users report gaps in integration coverage for some cloud platforms and network vendors.
Source: SolarWinds
10. ManageEngine OpManager

Best for: Fault and performance monitoring for network devices
Strengths: Layer 2 maps, WAN and wireless monitoring, distributed probes
Things to consider: Confusing licensing and alert noise
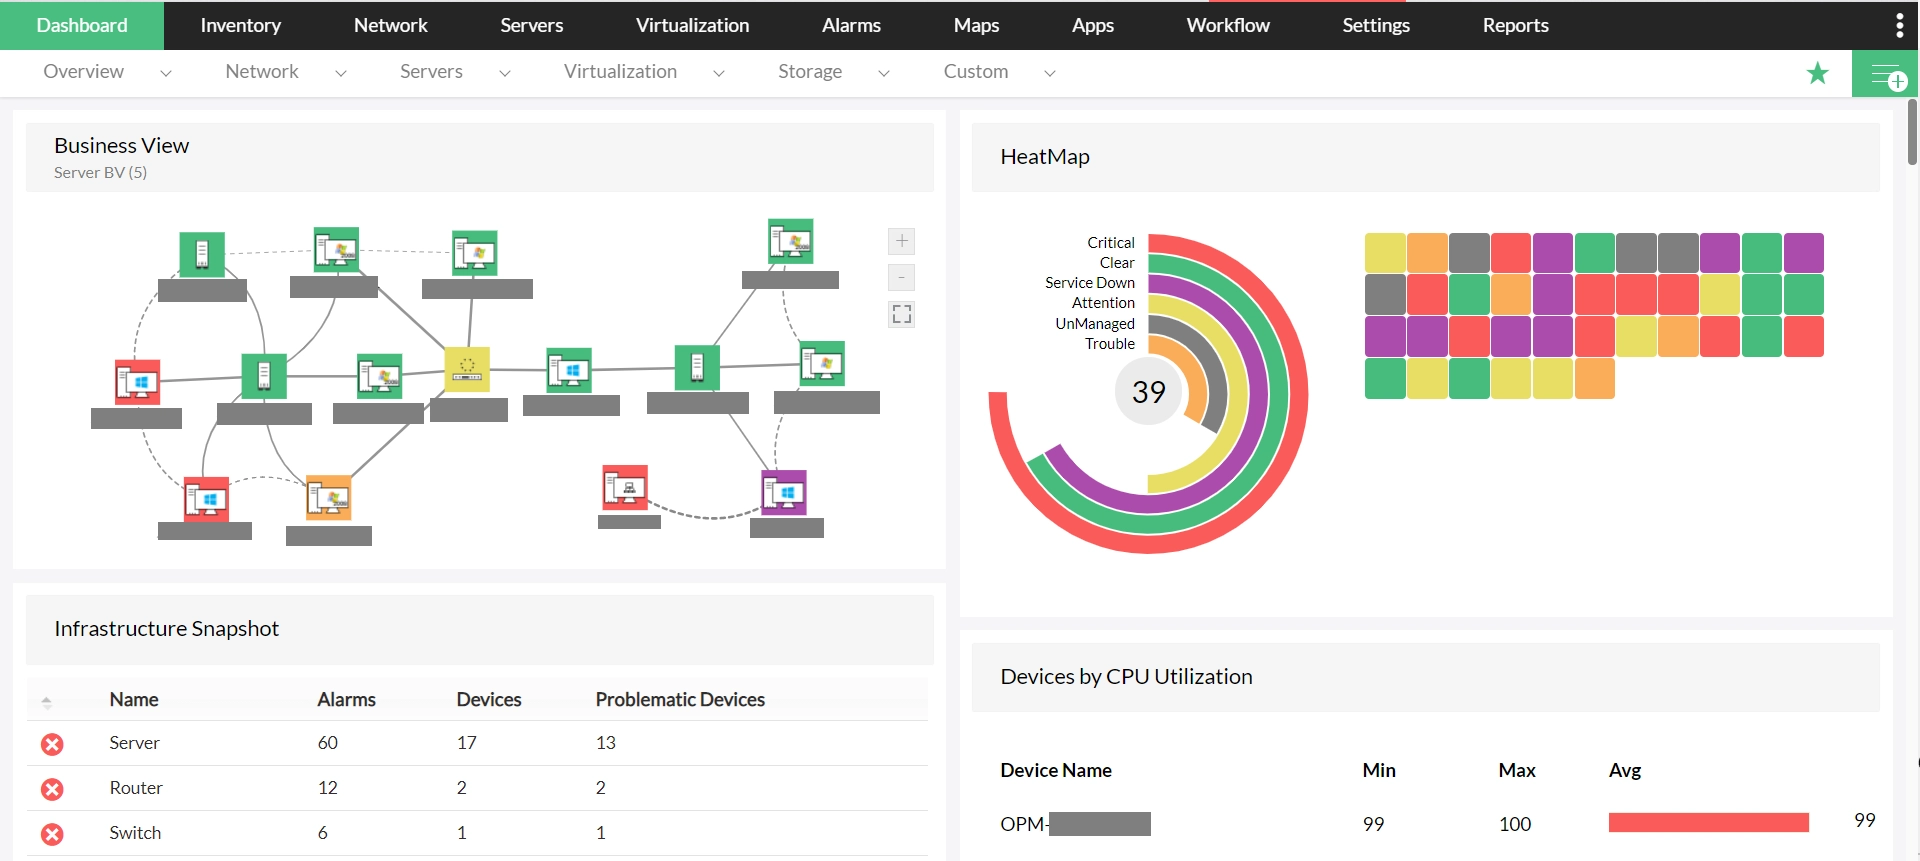
ManageEngine OpManager monitors routers, switches, firewalls, load balancers, wireless LAN controllers, servers, virtual machines, printers and storage devices for fault and performance. It provides real-time visibility into device health, availability and performance for any IP-based device.
The platform correlates raw network events, filters unwanted events and presents color-coded alarms classified by severity, which reduces the manual event handling typical of a plugin-based setup. Editions scale from a standard tier through professional and enterprise tiers that add distributed monitoring and high availability.
Key features include:
- Network and server monitoring: Covers network devices plus physical and virtual servers, including Hyper-V, VMware, Citrix, Xen and Nutanix HCI.
- Network visualization: Layer 2 maps, virtual topology maps, business views, and 3D floor and rack views for data centers.
- Fault management: Correlates raw events and filters noise into severity-classified alarms, with email and SMS notification.
- WAN and wireless monitoring: Uses Cisco IPSLA to monitor WAN link availability, and tracks access points, wireless routers and WiFi strength.
- Distributed monitoring: A central server aggregates health and performance across locations using remote probes with probe-specific controls.
- Storage and Cisco ACI monitoring: Monitors fiber channel switches, storage arrays and tape libraries, and discovers Cisco ACI fabric, tenants and endpoint groups.
Limitations (as reported by users on PeerSpot):
- Licensing model: Reviewers describe licensing as confusing and note that modular add-ons accumulate cost quickly.
- Setup complexity: Deployment is described as easy but configuration and customization as complicated, often requiring an experienced technician.
- Alert tuning: Reviewers report considerable alert noise out of the box, with threshold and dependency tuning needed to prevent alert storms.
- Reporting depth: Report content and customization options are described as limited.
- Documentation and support: Users report limited learning materials and long resolution times on support tickets.
Source: ManageEngine
11. Auvik

Best for: Automated network mapping and traffic visibility
Strengths: Live topology, config backup, 64+ preset alerts
Things to consider: No SNMP traps and limited reporting
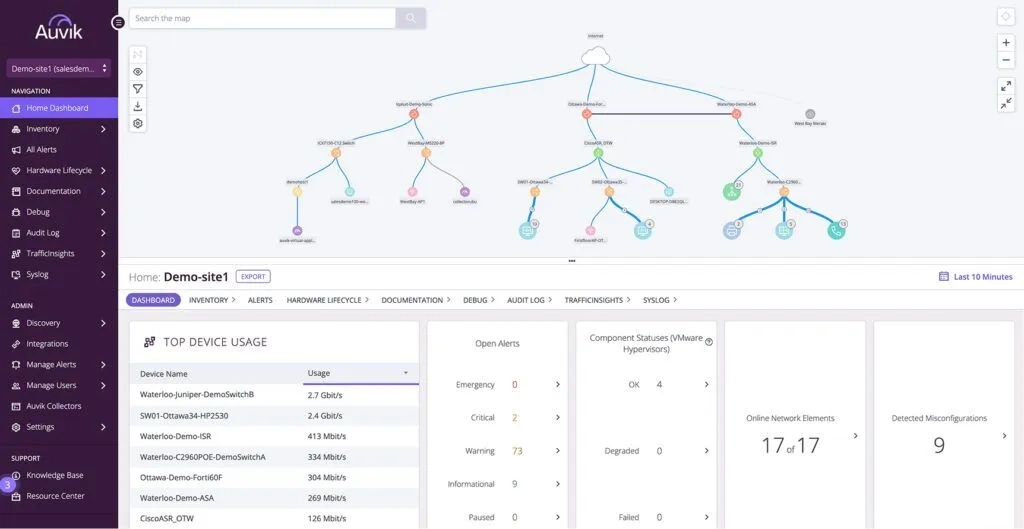
Auvik is a cloud-based network management platform that discovers devices and connections and keeps a live network map updated as the network changes. Deployment involves installing a collector, after which the platform inventories the environment automatically.
Beyond mapping, it analyzes traffic flows, backs up device configurations, and applies AI-guided troubleshooting that identifies likely root causes and recommends where to investigate next. It supports more than 700 device vendors out of the box, which removes much of the per-device configuration work a Nagios deployment needs.
Key features include:
- Automated discovery and inventory: Installing a collector pulls in the infrastructure automatically and documents devices without manual tracking.
- Live network mapping: Topology maps update in real time as the network changes, with drill-down into any device for traffic and performance detail.
- Pre-configured alerting: More than 64 preset alerts work from day one and surface directly on the live network map, with customization available.
- Traffic analysis: Provides visibility into flows across the network, including who is on the network and where traffic is going.
- Configuration management: Keeps a full history of device configurations as changes occur, with version comparison and backups for recovery.
- APIs and integrations: Alert history, inventory, credentials, tenants and usage APIs connect to ticketing and PSA tools including ConnectWise, ServiceNow, PagerDuty and Slack.
Limitations (as reported by users on PeerSpot):
- Reporting capabilities: Reviewers report the absence of a full reporting system, leading some to export data into external tools.
- SNMP trap support: Users note that infrastructure devices cannot push alerts into the platform via SNMP traps.
- Mapping accuracy: Some reviewers report maps that do not always reflect the actual network layout.
- False positives: Reviewers ask for easier ways to suppress unnecessary alerts.
- Dashboard customization: Dashboards are described as defined by the vendor rather than freely customizable.
- Device naming: Discovery sometimes returns generic names rather than hostnames, requiring manual correction.
Source: Auvik

SaaS Observability Platforms
12. Datadog
Best for: Managed monitoring across cloud, hybrid and on-prem
Strengths: 900+ integrations, tag-based analytics, AIOps correlation
Things to consider: Cost control and alert tuning at scale
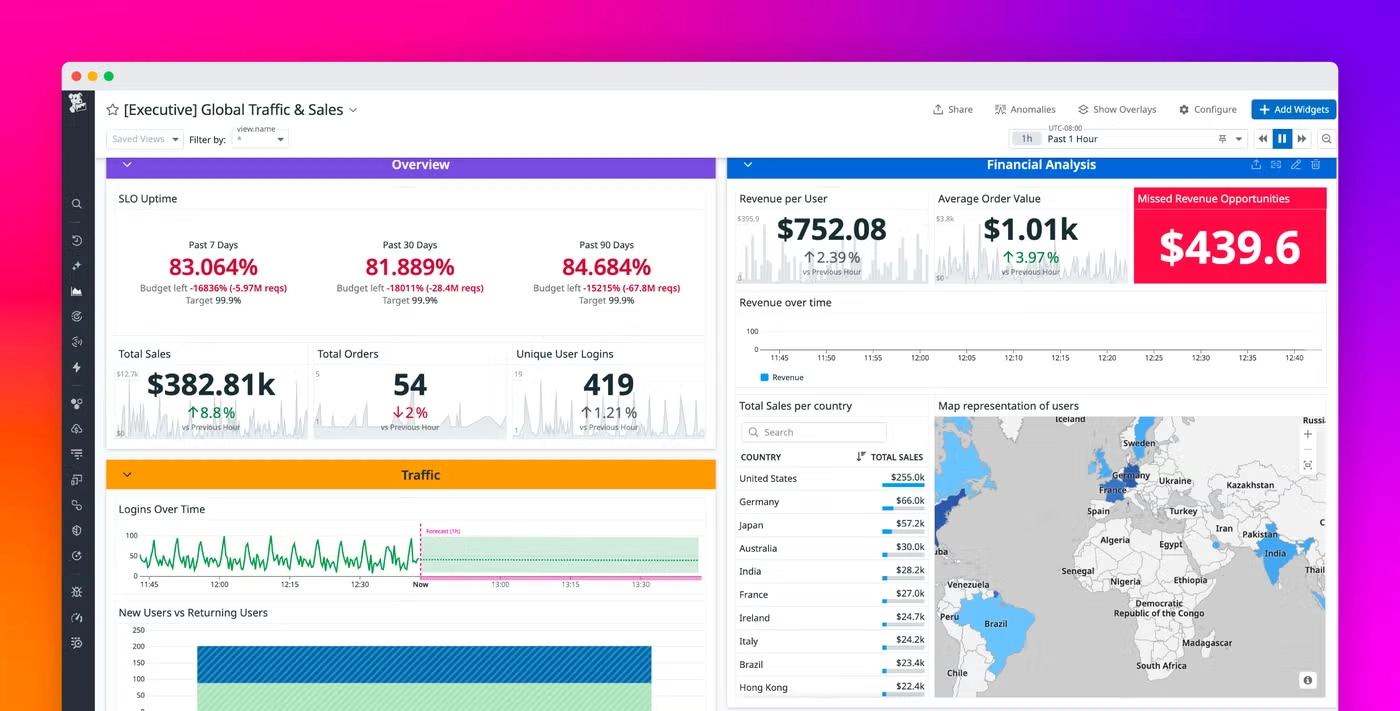
Datadog provides SaaS-based infrastructure monitoring with metrics, visualizations and alerting for cloud and hybrid environments. Deployment is designed to require little maintenance, which removes the backend server management that a self-hosted Nagios instance demands.
The platform tracks tens of thousands of infrastructure metrics out of the box and retains continuous historical records, including for infrastructure that no longer exists. Infrastructure monitoring sits alongside APM, log management, network monitoring and cloud security within the same platform.
Key features include:
- Broad stack coverage: Deploys across on-premises, hybrid, edge and multi-cloud environments with vendor-backed integrations for Kubernetes, serverless platforms and over 900 other technologies.
- Tag-based search and analytics: Slices infrastructure by tags for filtering and analysis across large estates.
- Cross-signal correlation: One-click correlation links related metrics, traces, logs and security signals from across the stack.
- AIOps event correlation: Correlates events and surfaces issues automatically to reduce alert fatigue.
- Configuration change tracking: Tracks configuration changes across multi-cloud environments and highlights tagging gaps.
- Custom metrics handling: Ingests custom metrics with selective indexing, and uses distribution metrics to calculate globally accurate percentiles.
Limitations (as reported by users on PeerSpot):
- Cost predictability: Reviewers describe the pricing model as complex and report unexpected costs when data volumes spike.
- Cost controls: Users ask for harder administrative limits to cap consumption automatically rather than through team-by-team intervention.
- Alert quality: Reviewers report that the platform generates many non-actionable alerts until it is tuned.
- Query performance: Slower response times are reported when querying large datasets.
- Agent management: Installing and managing agents across non-containerized hosts and mixed database environments is described as tricky.
Source: Datadog
13. Dynatrace

Best for: Automatic topology and AI-driven root cause analysis
Strengths: Smartscape mapping, Davis AI, Grail, AutomationEngine
Things to consider: Pricing model and configuration effort
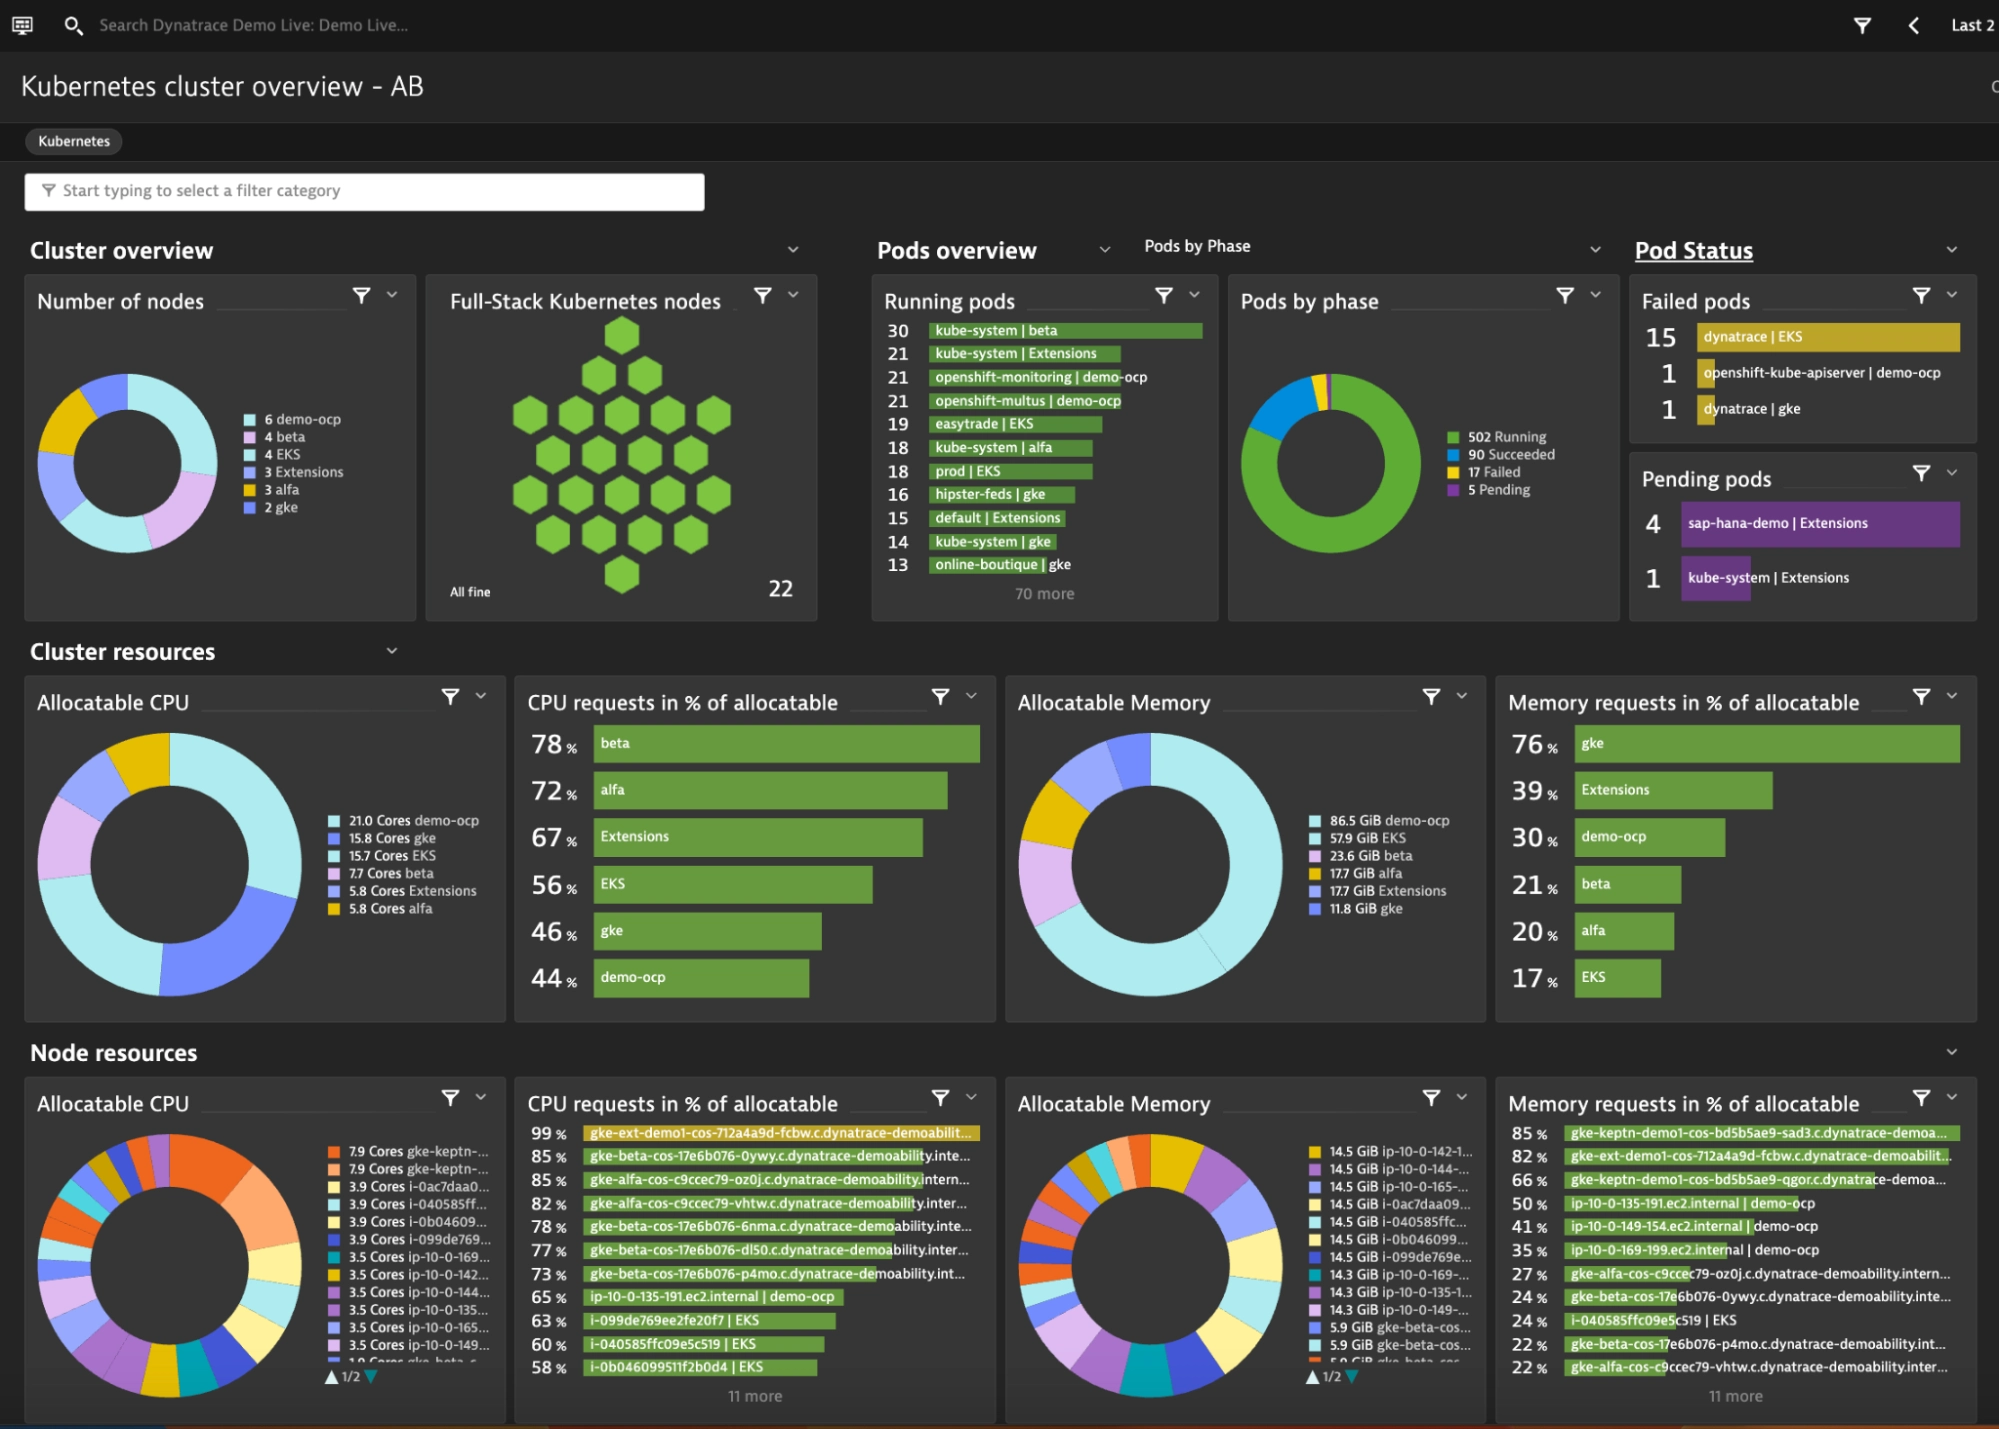
Dynatrace Infrastructure Observability provides continuous discovery and monitoring across hosts, virtual machines, containers, networks, servers, cloud platforms, and events and logs. It visualizes dynamic environments automatically, so inventory does not have to be maintained by hand.
The platform is built for hybrid and multi-cloud architectures, delivering end-to-end observability across on-premises infrastructure and major cloud environments in one view. Coverage spans bare-metal servers through to containerized microservices on Kubernetes, with automatic discovery of clusters, nodes and workloads.
Key features include:
- Automatic discovery and mapping: Discovers and maps hosts, containers, networks and cloud resources across hybrid environments without manual configuration.
- AI-driven root cause analysis: Dynatrace Intelligence continuously monitors infrastructure and pinpoints root cause, filtering thousands of events down to actionable problems.
- Grail data lakehouse: Ingests logs without predefined schemas, retains data context automatically, and correlates logs to traces without manual tagging.
- AutomationEngine: Connects to incident management and automation tools to trigger remediation runbooks, open tickets and update the CMDB.
- Kubernetes and container visibility: Automatic discovery of clusters, nodes and containerized workloads without manual instrumentation.
- Hybrid cloud integrations and extensions: Covers AWS, Azure, Google Cloud, VMware, Nutanix and Hyper-V, extended through an open API framework and the Dynatrace Hub.
Limitations (as reported by users on PeerSpot):
- Cost: Reviewers consistently describe Dynatrace as more expensive than comparable platforms.
- Licensing model: Sizing host counts for licensing is described as confusing and difficult to determine without vendor assistance.
- Setup complexity: Configuration in environments with many applications and JVMs is reported to require significant expertise.
- Management interface: Reviewers describe the administrative interface as unintuitive for common tasks such as sharing dashboards in bulk.
- Integrations and data export: Users report friction with third-party integrations and ask for more flexible data export functions and APIs.
Source: Dynatrace

14. New Relic

Best for: Correlating host health with application performance
Strengths: Change tracking, automap, 780+ integrations, inventory
Things to consider: Cost at volume and data retention limits
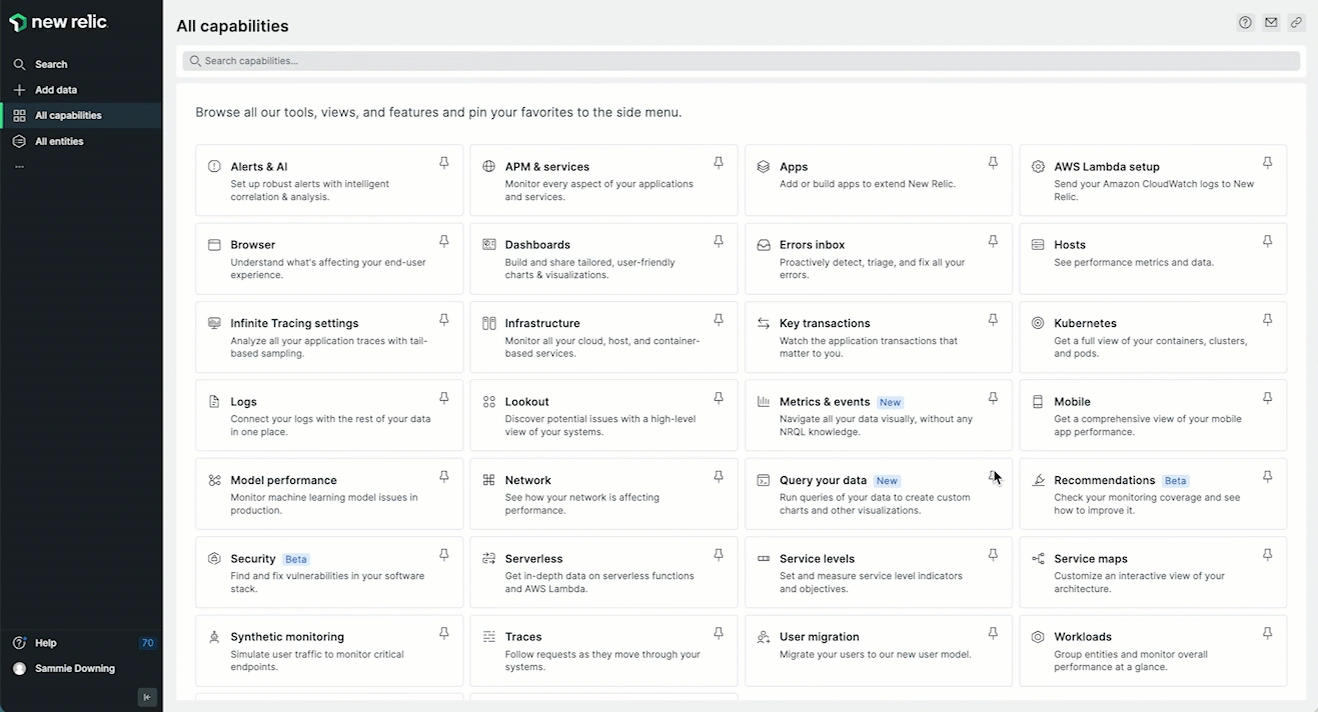
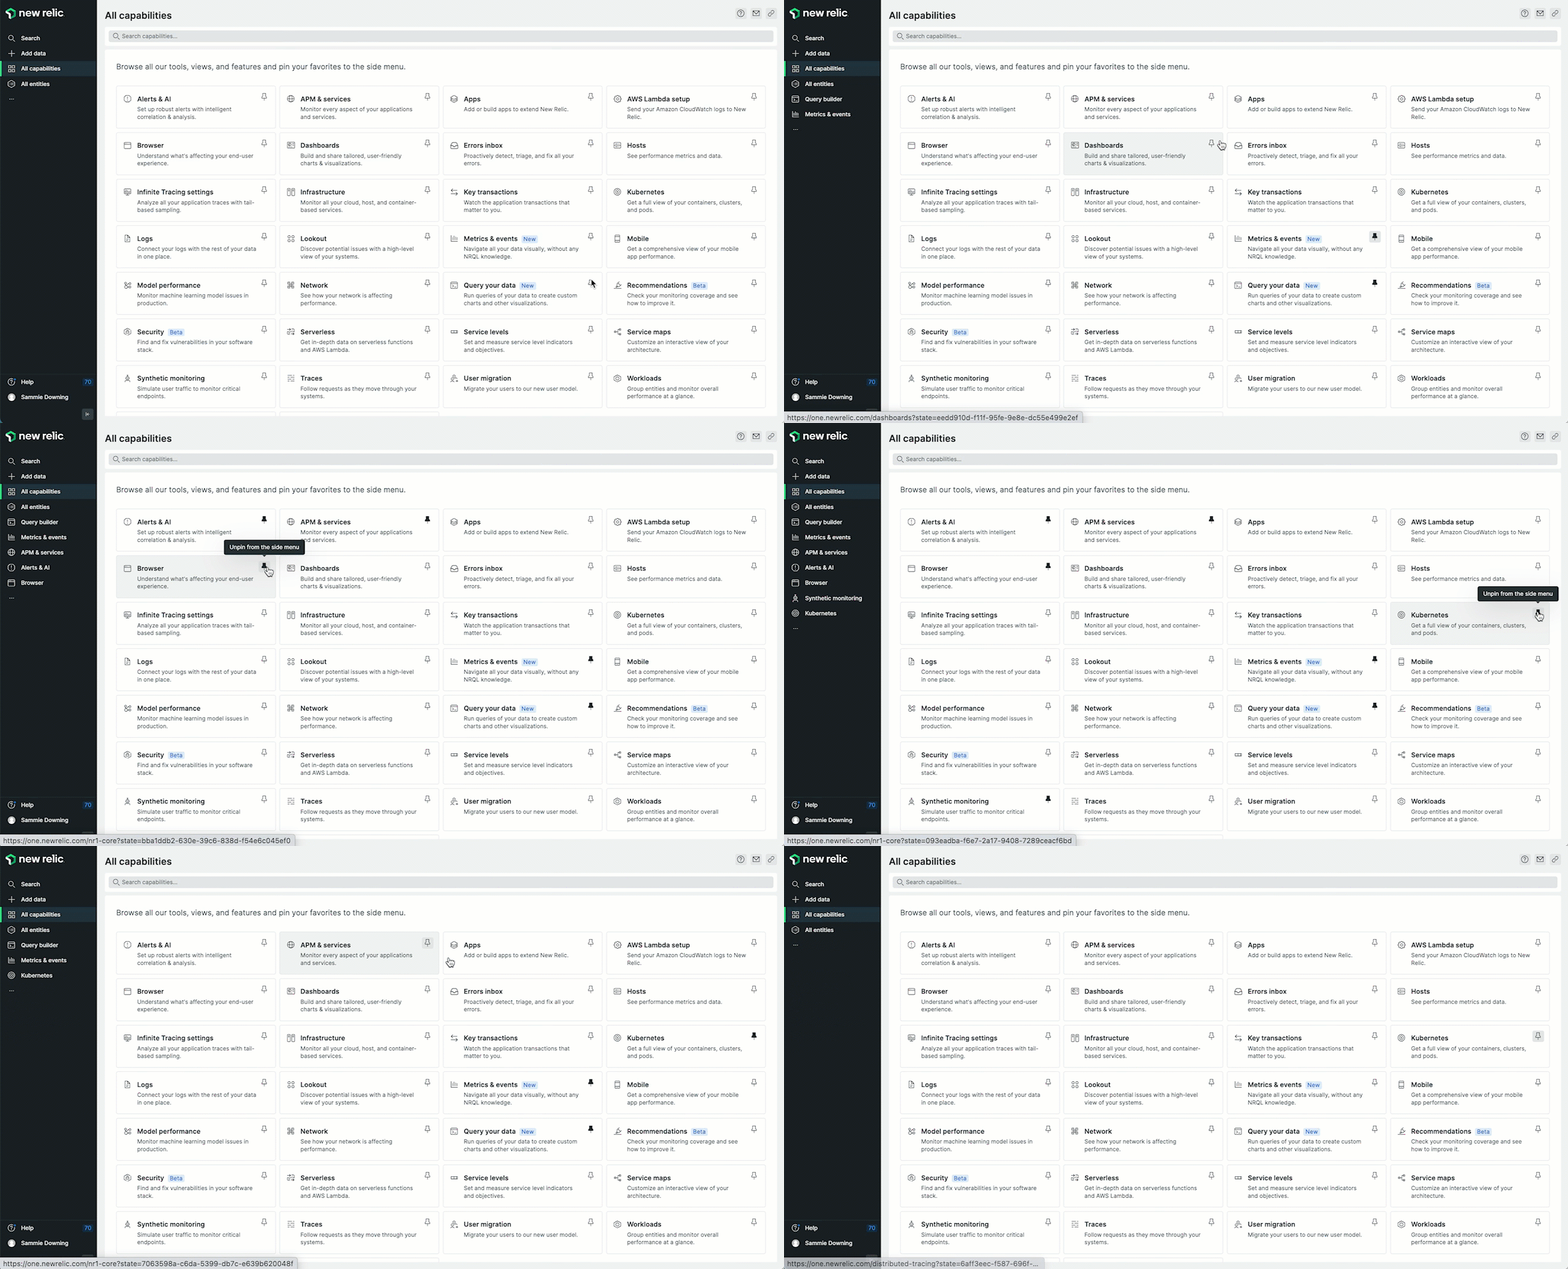
New Relic infrastructure monitoring covers services running in the cloud, on dedicated hosts and in Kubernetes containers, correlating host health with application context, logs and configuration changes. Infrastructure and APM data sit in the same platform rather than in separate tools.
The infrastructure agent supports Linux, macOS and Windows, and cloud integrations connect directly to AWS, Azure and Google Cloud accounts without requiring the agent. On-host integrations extend coverage to databases, messaging services and application servers, and the platform ingests data from Prometheus, StatsD and JMX.
Key features include:
- Infrastructure and APM correlation: Views CPU and memory for hosts, containers and VMs within APM, correlating drops in application performance with host metrics.
- Change tracking: Tracks host and configuration changes and compares host performance against software change events to determine root causes.
- Automap and entity relationships: Visualizes relationships and dependencies across infrastructure and applications to pinpoint the source of an issue.
- Searchable inventory: Searches across the estate to find which hosts contain particular packages, configurations or startup scripts.
- Live event tracking: A real-time feed records changes to hosts, services, processes, config files and kernel settings within a chosen time frame.
- Dynamic alerting and filter sets: Alerts attach to host attributes and tags so they scale as hosts change, with filter sets grouping entities for investigation.
Limitations (as reported by users on PeerSpot):
- Pricing: Reviewers describe pricing as high, particularly for growing organizations, with per-user costs and additional charges for extra capabilities.
- Data retention: Limited historical data retention is reported as a constraint on long-term planning, with extended history charged separately.
- Licensing tiers: Reviewers criticize the suite licensing structure for view-only users.
- Alert and dashboard customization: Users report that customizing alerts and dashboards and integrating third-party plugins needs improvement.
- Support response times: Some reviewers report support SLAs of seven to ten working days on certain issues.
Source: New Relic
15. LogicMonitor Envision

Best for: Agentless hybrid monitoring with topology awareness
Strengths: Agentless collectors, 3,000+ integrations, anomaly detection
Things to consider: Alert sensitivity and module-based pricing
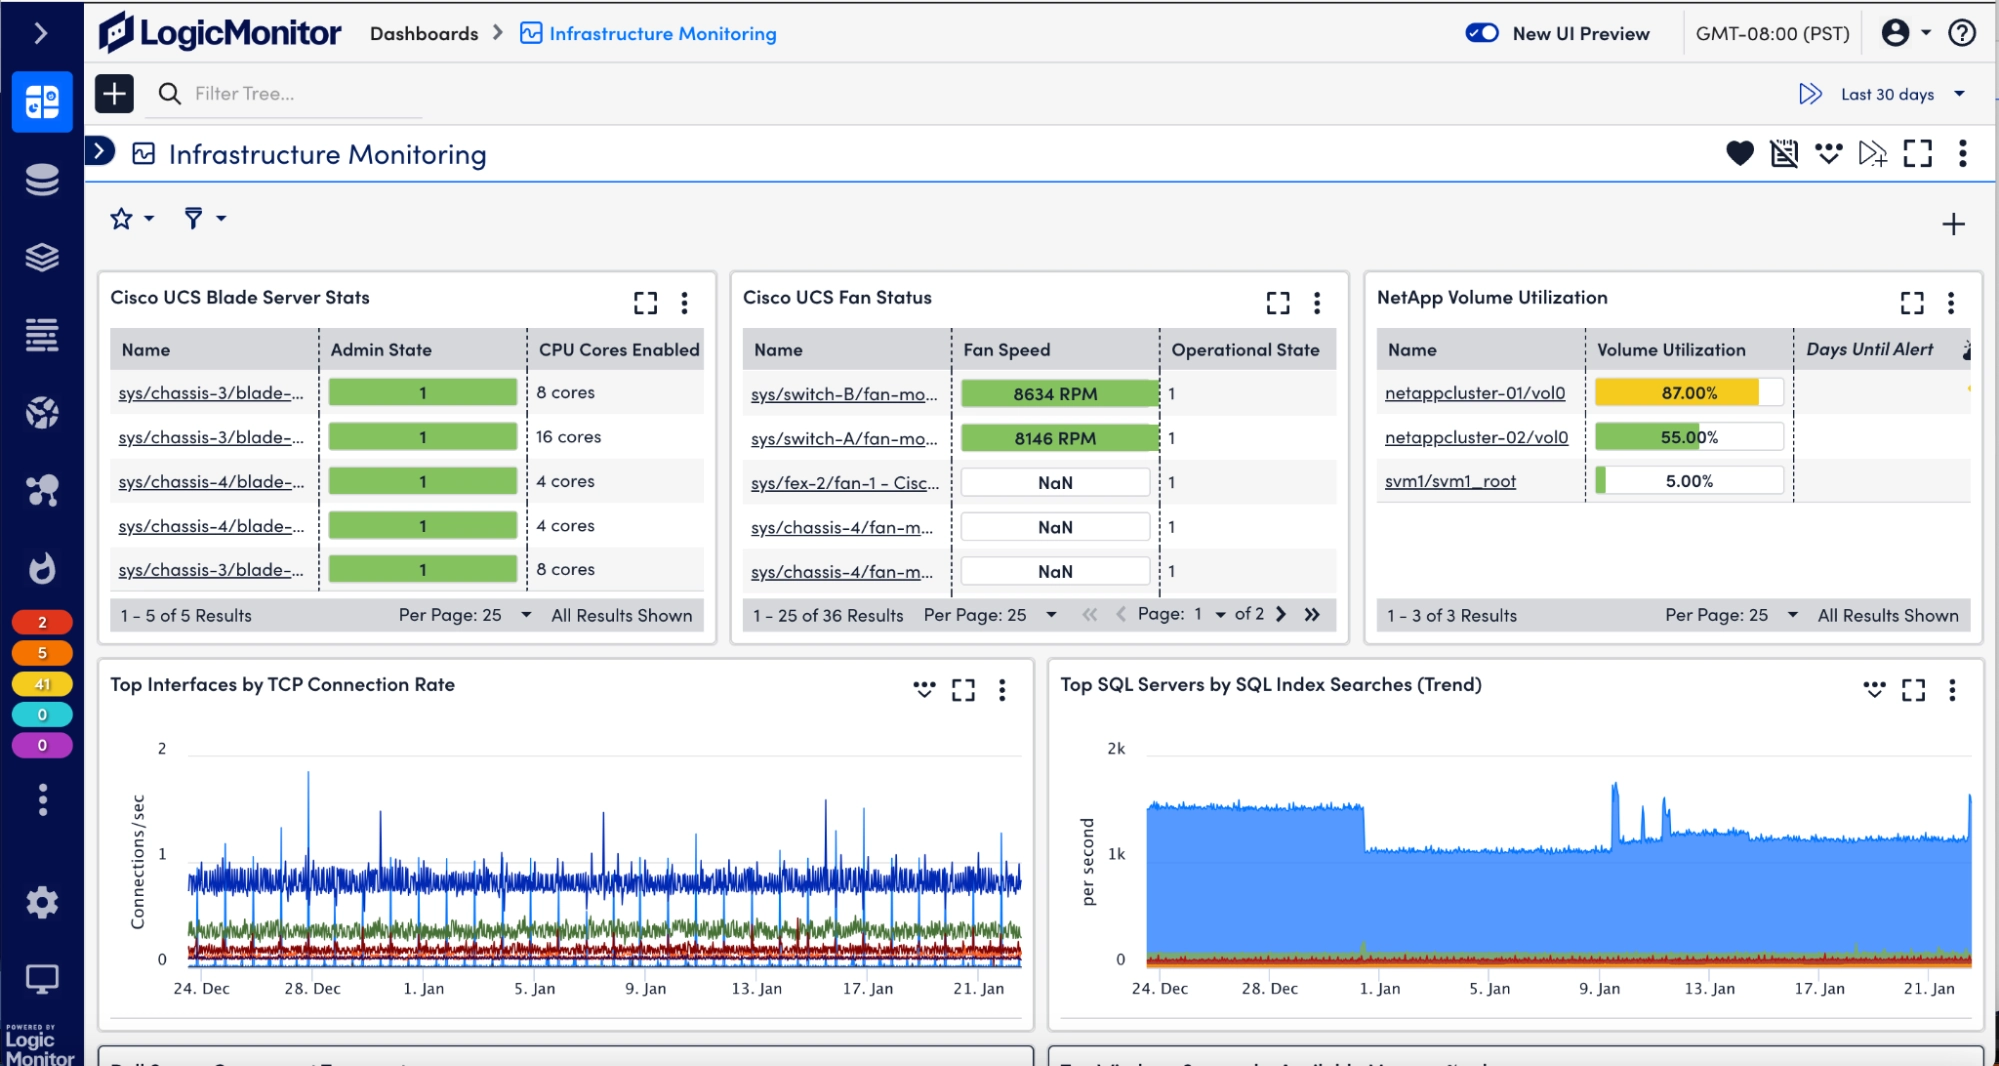
LogicMonitor Envision unifies metrics, logs, events and traces in a single platform covering data centers and distributed clouds. Onboarding uses lightweight agentless collectors with automated discovery, so no scripting or manual configuration is needed to bring infrastructure into monitoring.
Coverage spans network devices, physical and virtual servers, VMs and hypervisors including vSphere, Hyper-V and Nutanix, SD-WAN tunnels, databases, storage arrays and configuration state. Topology mapping links infrastructure components so incidents can be traced to a probable cause rather than investigated symptom by symptom.
Key features include:
- Agentless collectors with auto-discovery: Collectors onboard infrastructure in minutes without scripting or manual configuration.
- Topology and trend visualization: Maps relationships between infrastructure components to speed root cause analysis and identify trends over time.
- Network and device monitoring: Real-time visibility into routers, switches and cloud networks covering traffic, interfaces and device health.
- Configuration monitoring: Tracks device configuration drift with real-time alerts, full config history and performance correlation.
- Anomaly detection and forecasting: AI-powered anomaly detection, dynamic thresholds and usage forecasting identify risks before performance degrades.
- Integration breadth: More than 3,000 collector-based and API-friendly integrations span infrastructure, cloud, networking, applications, ITSM and CI/CD.
Limitations (as reported by users on PeerSpot):
- Alert sensitivity: Reviewers report that real-time monitoring can be overly sensitive, producing excess alerts, and that parent and child alarm logic needs work.
- Alert tuning effort: Users describe alert tuning as time-consuming to understand initially.
- Collector upgrades: Upgrading collectors is described as confusing and in need of simplification.
- Monitoring customization: Customizing monitoring from repositories is reported as cumbersome, often requiring forum searches for specific equipment codes.
- Automated remediation: Reviewers ask for more hands-free automated remediation of identified problems.
- Licensing cost: The license model is described as costly, particularly for additional modules.
Source: LogicMonitor
Conclusion
Organizations can overcome complex monitoring challenges by selecting a solution that directly aligns with their operational needs, whether they prioritize agentless discovery, open-source flexibility, or comprehensive SaaS observability. Moving away from legacy, configuration-heavy methods is a strategic step toward modernizing infrastructure management. By choosing an approach that suits their architecture, teams can significantly improve environment visibility and reduce maintenance overhead.